I. INTRODUCTION
It has been a long-standing goal to integrate III–V materials with Si for the purpose of achieving optoelectronic integrated circuits, such as laser and transistor devices, and forming multijunction and heterojunction solar cells which can attain an overall cost-competitive system. Reference Green, Emery, Hishikawa, Warta, Dunlop, Levi and Ho-Baillie1 In addition to crystal quality issues, arising from the lattice mismatch (f) between most III–V materials and Si, achieving a high performance III–V/Si solar cell requires improving the carrier transport through the device by implementing novel contact architectures. Reference Wurfel, Cuevas and Wurfel2 Among III–V material systems, gallium phosphide (GaP) is a good candidate for this integration. The lattice mismatch between GaP and Si is ∼0.4%, smallest among all the III–V binary materials with respect to Si, which enables pseudomorphic (coherent) epitaxial growth with low dislocation density on the Si substrates. Also, its wide and indirect band gap (E g ≈ 2.26 eV) allows less absorption loss compared to the homo-Si structure. These properties make GaP a suitable candidate for integration with Si heterojunction solar cells.
Amorphous Si (a-Si) is widely used as a passivation and a contact layer in Si heterojunction solar cells, enabling efficiencies of more than 25%. Reference Yoshikawa, Kawasaki, Yoshida, Irie, Konishi, Nakano, Uto, Adachi, Kanematsu, Uzu and Yamamoto3 However, a-Si has a low electric conductivity due to low mobility and its high resistance loss can lead to low fill factor (FF) values, which limits the overall Si heterojunction solar cell performance. GaP offers significant advantages over a-Si, such as high carrier mobility, high valance band-offset (ΔE V = 1.05 eV), and low conduction band-offset (ΔE C = 0.09 eV) with Si. Reference Sakata and Kawanami4 The last two features enable GaP to form a minority-carrier (electron) selective interface with Si, leading to suppression of the thermionic emission and tunneling of photogenerated holes into other layers where they can recombine nonradiatively. Reference Limpert, Ghosh, Wagner, Bowden, Honsberg, Goodnick, Bremner, Ho-Baillie and Green5
GaP layers have been successfully used in Si solar cells with different architectures to improve the overall carrier collection efficiency. Reference Feifel, Rachow, Benick, Ohlmann, Janz, Hermle, Dimroth and Lackner6–Reference Beck, Blakeslee and Gessert9 Recently, GaP was demonstrated in a homojunction Si solar cell, as a window layer, with an open-circuit voltage (V OC) of 632 mV and efficiency (η) of 12.4%. Reference Feifel, Rachow, Benick, Ohlmann, Janz, Hermle, Dimroth and Lackner6 In addition, a GaP/Si heterojunction solar cell with an n-type GaP emitter has been theoretically shown to produce higher V OC and η compared to the passivated emitter rear contact solar cell (PERC). Reference Wagner, Ohrdes, Dastgheib-Shirazi, Puthen-Veettil, König and Altermatt10 In our earlier work, we have experimentally shown a heteroemitter n-GaP/p-Si solar cell for the first time; however, the performance of the cell showed to be poor. Reference Zhang, Faleev, Ding, Boccard, Bertoni, Holman, King and Honsberg11 Feifel et al. have shown higher quantum efficiency in the short wavelength regime (∼350 to ∼700 nm) by using the n-GaP/p-Si heterojunction compared to the n-GaP/n-Si/p-Si homojunction in which GaP was used as a window layer. Reference Feifel, Ohlmann, Benick, Rachow, Janz, Hermle, Dimroth, Belz, Beyer, Volz and Lackner8 Nevertheless, the reported V OC and η show low values of 561 mV and 12.4%, respectively, which are still not comparable to the conventional PERC cell performance. Reference Green12 So far, a high efficiency GaP/Si solar cell (above 20%) has not been demonstrated yet. To do so, having a high Si bulk lifetime along with a high quality electron-selective GaP contact layer—with low interface recombination velocity and low contact resistance—is crucial.
It has been widely reported that after the thermal treatment of Si wafers at high growth temperatures, mostly for the purpose of surface oxide desorption and/or surface reconstruction, a drastic reduction of the Si minority-carrier lifetime occurs, both in the hydrogen atmosphere of metal–organic chemical vapor deposition (MOCVD) reactors Reference García-Tabarés, Carlin, Grassman, Martín, Rey-Stolle and Ringel13–Reference Warren, Kibbler, France, Norman, Olson and McMahon15 and ultra-high vacuum environments such as molecular beam epitaxy (MBE). Reference Zhang, Faleev, Ding, Boccard, Bertoni, Holman, King and Honsberg11,Reference Ding, Zhang, Nærland, Faleev, Honsberg and Bertoni16,Reference Ding, Zhang, Norland, Faleev, Honsberg and Bertoni17 In the case of MBE growth, in our previous work, we have shown that a significant Si lifetime degradation occurs mainly at temperatures above 500 °C. Reference Zhang, Faleev, Ding, Boccard, Bertoni, Holman, King and Honsberg11 We assigned this increased recombination rate to extrinsic, fast-, and medium-diffusing impurities, originating from the MBE environment during the thermal treatments in the MBE chamber. Reference Ding, Zhang, Norland, Faleev, Honsberg and Bertoni17 Also, it was found that the density of impurities that causes the Si lifetime to reduce is below the detection limit of typical characterization methods, such as deep-level transient spectroscopy and secondary-ion mass spectrometry, Reference Varache, Darnon, Descazeaux, Martin, Baron and Muñoz14 which makes the identification of the culprits quite difficult. Thus, demonstrating practical approaches in which the Si lifetime can be preserved during high temperature treatments in deposition systems is important for obtaining a high efficiency GaP/Si heterojunction solar cell and for forming devices with the heterogeneous integration of compound semiconductors with Si in general. García-Tabarés et al. were able to maintain the Si lifetime after thermal treatment inside a MOCVD chamber by applying a phosphine treatment to the Si surface. Reference García-Tabarés, Carlin, Grassman, Martín, Rey-Stolle and Ringel13 This is mainly attributed to either gettering of the impurities by the diffused phosphorus (P) layer or introducing hydrogen passivation onto defects. Reference García-Tabarés, Carlin, Grassman, Martín, Rey-Stolle and Ringel13 Furthermore, SiN x Reference Zhang, Faleev, Ding, Boccard, Bertoni, Holman, King and Honsberg11,Reference Zhang, Kim, Faleev and Honsberg18 and SiO2/SiN x Reference Ohlmann, Feifel, Rachow, Benick, Janz, Dimroth and Lackner19 diffusion barriers have been shown to be able to prevent contamination of Si wafers by blocking extrinsic impurities. We have also demonstrated that gettering by phosphorus diffusion in a furnace can recover the lifetime of Si wafers that was degraded by the MBE thermal treatment. Reference Ding, Zhang, Nærland, Faleev, Honsberg and Bertoni16 In this work, we studied two practical methods—low temperature MBE growth and phosphorus diffusion layer as a sacrificial n+ layer (gettering agent)—to effectively maintain Si bulk lifetime during MBE growth. Finally, we implemented these methods into different GaP/Si solar cells and compared their electrical performances.
After establishing the effectiveness of these Si lifetime-saving methods on the performance of GaP/Si solar cells, carrier collection efficiency is further improved by implementing a novel p-emitter design to serve as a hole-selective contact through reduction of parasitic absorption loss at short wavelengths, as observed in (p+)a-Si/(i)a-Si stacks of Si solar cells. In particular, we have shown that by using a molybdenum oxide layer (MoO x ) as a p-type carrier-selective contact, with a higher band gap (∼3 eV) than a-Si (∼1.7 eV), a higher quantum efficiency can be achieved.
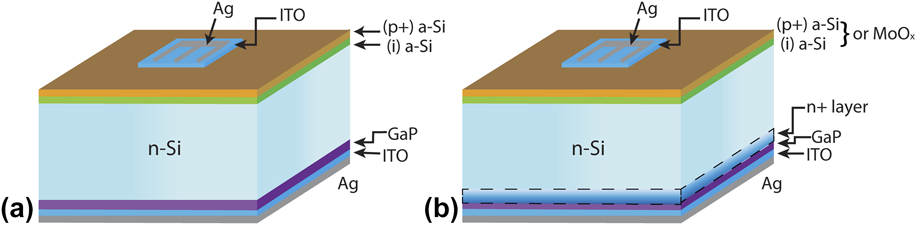
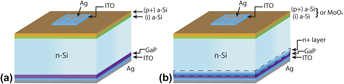
In the present work, four heterojunction GaP/Si solar cells with different architectures of electron- and hole-selective contacts are grown, fabricated, and tested to give an insight into carrier transport of GaP/Si solar cells, Fig. 1.
(a) Schematic of structure I and structure II, (b) schematic of structure IIIA with a-Si-based layers on top. Structure IIIB has an MoO x layer instead of a-Si as a hole-selective contact. The active area of the solar cells is defined as the area within the aperture (1 × 1 cm2) that is not shaded by metal.

II. EXPERIMENTAL DETAILS
All the n-type Si wafers used in this study were 4-inch-diameter, float-zone, double-side-polished wafers, with (001) orientation, and with thickness and resistivity of 270 µm and 3 Ω cm, respectively. The wafers were chemically cleaned with an RCA (Radio Corporation of America, New York, New York) solution (HCl:H2O2:H2O 1:1:6 mixture) followed by a diluted hydrofluoric acid (5% HF) solution for 30 s, rinsed in deionized water (DI), and nitrogen dried immediately prior to loading into the MBE chamber. All the epitaxially grown samples were grown using a Veeco GEN III MBE system (Veeco Instruments, Saint Paul, Minnesota) equipped with a phosphorus valved cracker operated at 960 °C, and Ga and Si effusion cells. The surface reconstruction of the samples during the MBE growth was monitored via in situ reflection high energy electron diffraction (RHEED) patterns.
The nominal doping level of the n-type GaP layers used in this study is ∼1018 cm−3 with Si as the n-type dopant species. After deposition of GaP on the back side of the solar cell (the side away from the sun during solar cell operation), samples were taken out of the MBE vacuum chamber and (p+)a-Si/(i)a-Si amorphous silicon passivating layers were deposited on the front side (the sunward side) of the solar cell by plasma-enhanced chemical vapor deposition (PECVD) at 250 °C. These hydrogenated amorphous silicon layers are very effective at reducing interface state density and recombination velocity at the silicon surface, and additionally form the p–i–n junction structure of these heterojunction Si solar cells.
Finally, indium-tin-oxide (ITO) and silver (Ag) with thicknesses of ∼75 nm and ∼200 nm, respectively, were deposited on both sides of the cell by RF sputtering, as illustrated in Fig. 1(a). The front ITO film, as a transparent conductive oxide layer, was deposited on the (p+)a-Si layer to attain good lateral conductivity and low ohmic contact resistance to the Ag electrodes. In addition, the front ITO layer acts as an antireflection coating to enhance light coupling into the device. The rear ITO/Ag layers simultaneously serve as a current spreading layer and an infrared reflector. Finally, all the cells in this study that were capped with ITO layers were annealed in a muffle furnace at 220 °C for 20 min in an air environment to recover the a-Si interface passivation, which was degraded during the RF sputtering process. The fabricated solar cells in this work have total areas of 1 × 1 cm2.
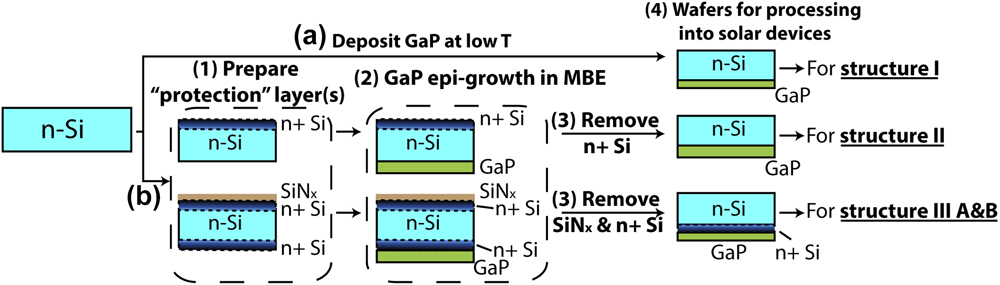
As shown in Fig. 2(a), to avoid introducing contaminants into the Si wafer, the first GaP/Si solar cell (structure I) was grown at 440 °C, well below the critical temperature (T ≈ 500 °C) at which Si minority-carrier lifetime (τeff) begins to degrade significantly. It has been shown in our earlier work that by avoiding high temperature surface treatment (T < 500 °C), Si lifetimes of greater than ∼1 ms are achievable, comparable to those in unannealed Si wafers. Reference Zhang, Kim, Faleev and Honsberg18 The growth of structure I was initiated without oxide desorption of the Si surface, which typically can be achieved at high temperatures (T ≈ 800 °C). Clear and sharp (2 × 1) RHEED patterns are expected during the Si oxide desorption process at such high temperatures. Reference Bevk, Mannaerts, Feldman, Davidson and Ourmazd20 Without oxide desorption of the Si surface, a low crystal quality GaP layer is expected to be formed on Si, most likely due to the low lateral surface diffusion. Dim and spotty (1 × 1) RHEED patterns (not shown here) were observed during the ∼20 nm GaP:Si growth of structure I, indicating that the GaP layer was formed from the coalescence of islands.
Simplified schematic diagram of preparing GaP/Si structures for (a) structure I, (b) structure II, IIIA, and IIIB.
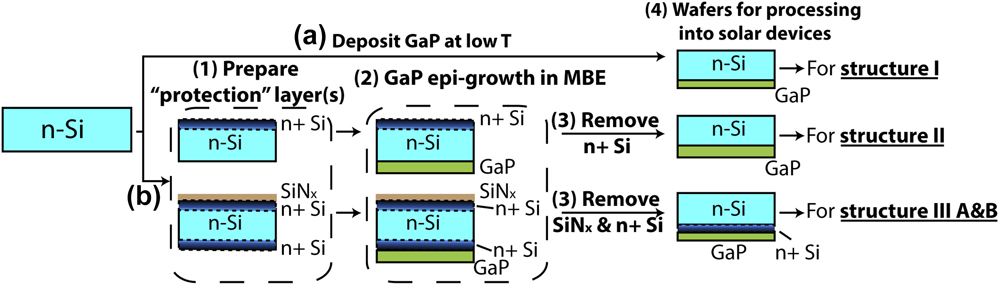
For the second GaP/Si solar cell (structure II), as illustrated in Fig. 2(b), an n+ Si diffused layer was formed on the front side of the Si solar cell wafer to act as a gettering agent for contaminants. To form the n+ region, a 200-nm-thick SiO2 layer was initially deposited on the back side of the Si wafer at 200 °C by PECVD to prevent P diffusion into the backside of Si. The Si wafer coated with SiO2 was then loaded into the diffusion furnace and exposed to a mixture of O2 and POCl3 at 830 °C to form a diffused phosphorus layer on the front side. After the phosphorus diffusion, the SiO2 layer was removed by using a buffered oxide etch (BOE) solution for 10 min and the wafer was then rinsed in DI water. A simplified schematic diagram of the fabrication sequence of structure II is depicted in Fig. 2. After SiO2 removal, the Si wafer was loaded into the MBE chamber (bare Si side facing up) for GaP deposition on the back side. The growth was initiated with thermal treatment of the wafer at 800 °C for 10 min to remove native oxide and achieve a high surface quality. A nominally 100-nm-thick GaP:Si layer was then deposited at 540 °C by a migration enhanced epitaxy (MEE) growth mode. Reference Takagi, Yonezu, Samonji, Tsuji and Ohshima21 After the MEE GaP growth, ∼30 μm of the Si (front) side, including the n+ region, was isotropically etched by a mixture of hydrofluoric, nitric, and acetic acids (HNA) (10:73:17) at room temperature. This was followed by the deposition of (i)a-Si (8 nm) and (p+)a-Si (12 nm) on the etched (front) side of the Si. Finally, ITO and Ag layers were deposited using RF sputtering as contacts to the n-GaP and (p+)a-Si. The device schematic of structure II is shown in Fig. 1(a).
For the third GaP/Si solar cell (structure III), n+ layers were first formed on both sides of the Si wafer by the phosphorus diffusion process in the furnace, as explained earlier. Afterward, a 150-nm-thick SiN x diffusion barrier was deposited on the front side of the wafer by PECVD, as shown in Fig. 2(b). The sample was then loaded into the MBE chamber and after the thermal treatment at 800 °C, a 25-nm-thick GaP:Si layer was deposited at 580 °C by MEE. As shown in Fig. 2, the SiN x layer was etched by a concentrated HF (49%) solution and ∼30 µm of the Si wafer, including the n+ layer, was then removed by the HNA solution to ensure complete removal of the n+ layer from the front side. It is worth mentioning that the GaP layer was protected during the etching process. One piece of the etched wafer was passivated by a 50-nm-thick (i)a-Si:H film (bare Si side) for the effective minority-carrier lifetime measurement. Furthermore, ∼30 µm of the Si wafer, including the n+ and GaP layers, was etched off from the GaP side and a 50-nm-thick a-Si:H passivation layer was then deposited for measuring the Si bulk lifetime. The prepared GaP/Si sample [as shown in Fig. 2(b)] was used to fabricate two separate solar cells with different hole contact structures, a-Si (structure IIIA) and MoO x (structure IIIB). For structure IIIA, (i)a-Si (9 nm) and (p+)a-Si (16 nm) layers were deposited on the bare side of the Si for the purpose of Si passivation and forming a p-emitter layer. For structure IIIB, a 9-nm-thick MoO x layer was deposited using thermal evaporation from a MoO3 (99.99%) source with a deposition rate of 0.5 Å/s. To fabricate these two samples into the solar cell, ITO and Ag layers were deposited on both sides of the samples, using RF sputtering as shown in Fig. 1(b).
External quantum efficiency (EQE) was measured using a PV Measurements (QEX10; Point Roberts, Washington) system equipped with a dual grating monochromator. Internal quantum efficiency (IQE) was generated from the reflection corrected EQE data. Light J–V characteristics of the solar cells were measured using a class A Newport solar simulator (under one-sun AM1.5G spectrum with an irradiation intensity of 1000 W/m2); no shading correction factor was considered. Suns-V OC (illumination-dependent or pseudo light J–V) characteristics of the cells were acquired by a flash tester provided by Sinton Instruments (Boulder, Colorado). The pseudo light J–V analysis allows the effect of series resistance (R S) to be separated from the inherent recombination properties of the solar cell. Reflection losses were also acquired with a dual-beam spectrophotometer equipped with an integrating sphere. All the measurements were made in-house on the best-performing cell and the active area of the cell was considered as the total area. The effective minority-carrier lifetime (τeff) was measured from quasi-steady state photoconductance decay using a Sinton lifetime tester.
III. RESULTS AND ANALYSIS
A. GaP/Si solar cell grown at low temperature (structure I)
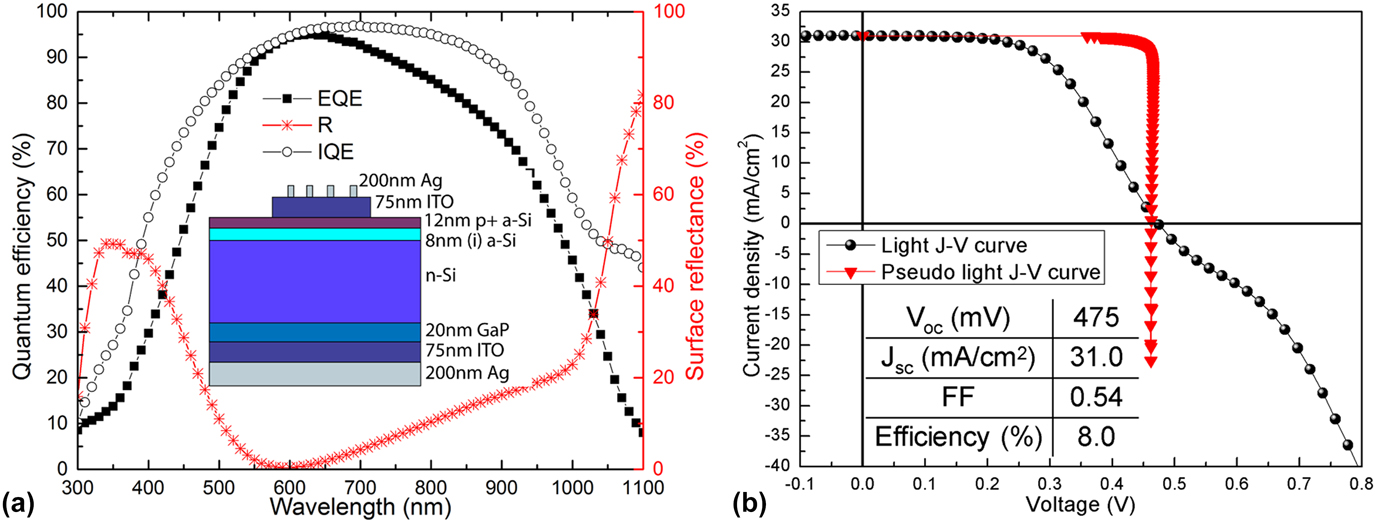
As mentioned in the previous section, the first GaP/Si solar cell (structure I) was grown in a low temperature regime (T < 500 °C), without Si surface reconstruction processes which require high temperature treatments (T > 700 °C). The EQE and IQE curves of structure I are shown in Fig. 3(a). Figure 3(b) illustrates the light J–V and Suns-V OC curves. The IQE curve shows values of more than 90% for the wavelength range from ∼550 to ∼880 nm. The J SC and V OC show values of 31.0 mA/cm2 and 475 mV, respectively. The electrical characteristics of all the n-GaP/n-Si solar cells are shown in Table I. As evident, the light J–V curve has a kink shape near the open circuit, which can be caused by the formation of a barrier for the carriers’ transport in the structure. In particular, this “S” shape could be explained by a band alignment issue at the GaP/Si interface, which can impede efficient extraction of electrons. In addition, the observed behavior may be related to a poor quality of the GaP:Si layer and the presence of interface states. Further investigation is necessary to understand the origin of this “S” shape.
(a) EQE, IQE, and surface reflectance of structure I. (b) Light and pseudo J–V curves of structure I (under AM1.5G spectrum with irradiation intensity of 1000 W/m2). IQE is generated from the EQE and the reflectance data according to IQE = EQE/(1 − R).

Light and pseudo J–V values for GaP/Si heterojunction solar cells presented in this work.

The pseudo-fill factor (FF0) and pseudo-efficiency (η0) show values of 93% and 13.3%, respectively. However, the actual FF and η have lower values of ∼54% and ∼8%, respectively. The Si bulk lifetime after the growth is measured to be ∼1 ms and it is comparable to the as-received Si wafers’ lifetime, which indicates that the low temperature growth mode was able to preserve the Si lifetime and, thus, contaminants did not contribute to the low conversion efficiency. The high FF offset (ΔFF = FF − FF0 ≈ 39%) and high Si lifetime suggest that the device performance is significantly impacted by losses associated with series resistance and carrier transport. These two loss mechanisms can be related to the GaP crystal quality and/or a poor quality of the GaP/Si interface passivation. We believe that the low quality of the GaP layer and its poor interface with the Si are mostly related to the residual oxygen and carbon contamination on the Si surface. Reference Ishizaka and Shiraki22 It is possible that these contaminants were not completely removed from the Si surface, due to lack of Si surface oxide desorption. Thus, development of another practical method in which we are able to achieve both high Si lifetime and high quality GaP is crucial for the purpose of achieving high efficiency n-GaP/n-Si solar cells.
B. Maintaining high Si lifetime with phosphorus diffusion layer
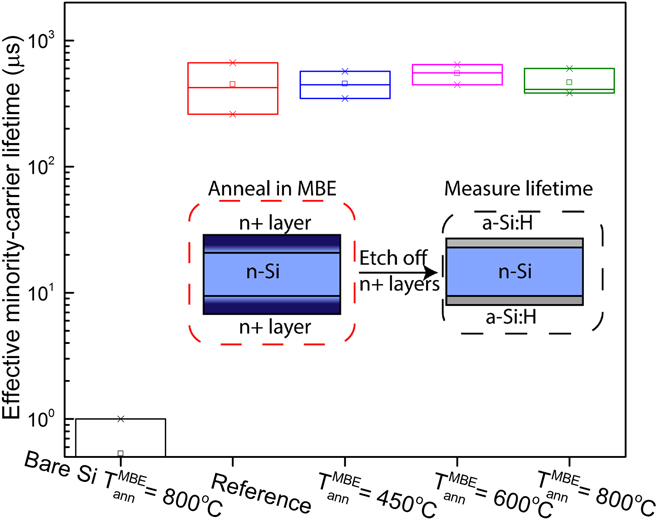
A new practical method was implemented for maintaining Si lifetime and attaining high crystal quality of GaP. This method involves the formation of n+ regions on both sides of the Si wafer by phosphorus diffusion. Prior to forming GaP/Si solar cells by this method, the effect of forming the n+ regions, as diffusion barriers and gettering agents, on the τeff was investigated. The inset of Fig. 4 shows the schematic structure of the samples used for lifetime measurement studies. The cleaned Si wafers were loaded into the diffusion furnace to form diffused phosphorus layers (n+ layers) on the both sides. After the diffusion, wafers were cleaned in a BOE solution, rinsed in the DI water, and dried with N2. The Si wafers with n+ layers were annealed in the MBE chamber at different temperatures (450, 600, and 800 °C) for 30 min. In addition, a reference Si wafer with the same structure was prepared; however, no thermal treatment was applied to the Si reference wafer. To eliminate the negative impact of the phosphorus rich surface on the lifetime measurement, the phosphorus diffusion layers were etched isotropically by the HNA solution, as mentioned earlier. It is worth mentioning that all samples were passivated by 50-nm-thick (i)a-Si:H films to measure the effective minority-carrier lifetime. The τeff values of these samples at an injection level of 1015 cm−3 are plotted in Fig. 4. It is evident that the τeff values of the samples are comparable to that of the reference cell. In addition, the τeff of an unprotected Si wafer (bare Si wafer), annealed at 800 °C for 30 min in the MBE chamber, shows a significantly lower value compared to that of the protected wafers. These results clearly show that the n+ layers can effectively maintain the Si bulk lifetime during annealing steps in the MBE chamber. The low τeff is attributed to the diffusion of contaminants from the backside of the Si substrate during the high temperature annealing process in the MBE chamber. Reference Ding, Zhang, Norland, Faleev, Honsberg and Bertoni17,Reference Zhang, Ding, Boccard, Nærland, Faleev, Bowden, Bertoni and Honsberg23 García-Tabarés et al. reported a similar lifetime recovery process in a MOCVD chamber using PH3. Reference García-Tabarés, Carlin, Grassman, Martín, Rey-Stolle and Ringel13 Khedher et al. also showed that a phosphorus-based gettering agent, deposited using a phosphoryl chloride (POCl3) source, can getter impurities from a Si wafer after a high temperature treatment in an infrared furnace. Reference Khedher, Hajji, Hassen, Ben Jaballah, Ouertani, Ezzaouia, Bessais, Selmi and Bennaceur24 Thus, we believe external and/or internal contaminants can be effectively collected in the n+ layers (phosphorus diffusion barriers) and kept away or removed from the Si bulk.
Effective minority-carrier lifetime of the Si wafers annealed in the MBE chamber at different temperatures for 30 min at the injection level of 1015 cm−3. The error bars are determined by considering the standard deviation of the measurements (“ann” is an abbreviation for “annealed”).

C. GaP/Si solar cell with n+ layer as a gettering agent (structure II)
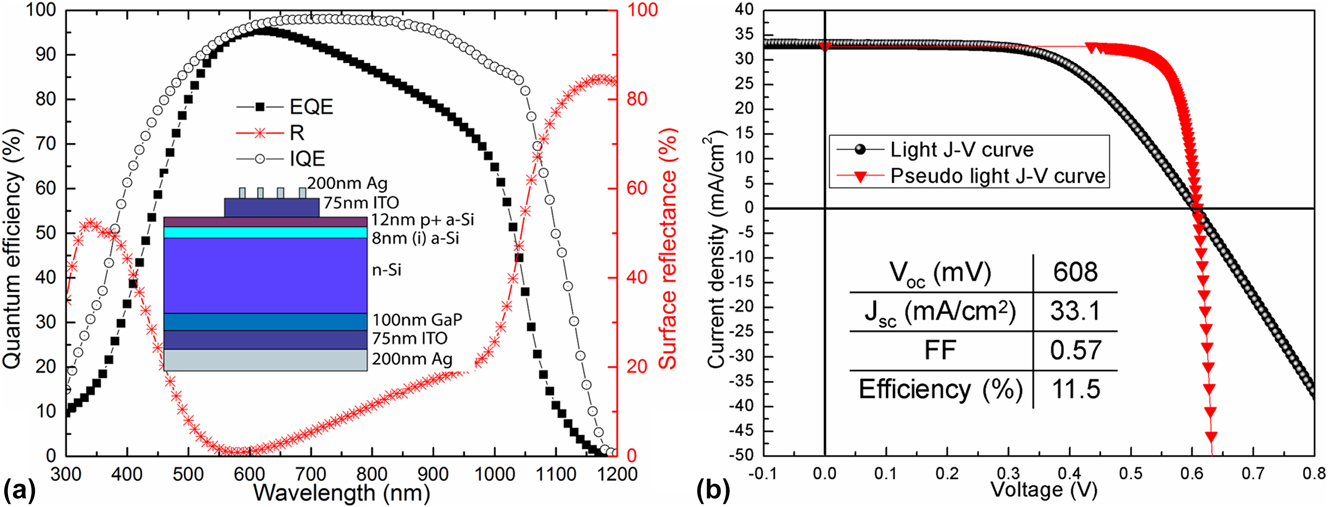
Structure II demonstrated a PV response with a higher electrical performance than structure I, as shown in Fig. 5. The main spectral response of structure II occurs in the range of ∼350 to ∼1100 nm. The EQE and IQE plots show values of ∼93% and ∼97%, respectively. It is shown that the top surface reflectance (R) makes up the majority of the optical losses. The optical loss is more dominant at long (λ > 1000 nm) and short (λ < 350 nm) wavelength regimes. The V OC and J SC show values of ∼608 mV and ∼33.1 mA/cm2, respectively, which are remarkably improved, compared to structure I. In addition, the FF and η depict values of 57% and 11.3%, respectively, which are still lower than the FF0 (80%) and η0 (16%) values. The Si bulk lifetime of structure II was measured to be ∼950 μs, indicating that getterable diffusing impurities did not have a significant impact on the bulk lifetime.
(a) EQE, IQE, and surface reflectance of structure II. (b) Light and pseudo J–V curves of structure II (under AM1.5G condition with an irradiation intensity of 1000 W/m2).

The improved solar cell performance (V OC and FF) of structure II also indicates the improved crystal quality of GaP (verified by XRD analysis, not shown here). This confirms that the GaP layer was epitaxially grown on an oxide-free Si surface, which led to a lower defect density in the volume and a higher surface diffusion mobility. Although the GaP layer partially passivated the Si rear surface and successfully acts as an electron-selective contact, the presence of defects at the GaP/Si interface and in the GaP bulk are still the main limiting factors for achieving higher V OC values. Nevertheless, the cell characteristics clearly indicate that using diffusion barriers for the purpose of maintaining Si bulk lifetime is crucial to achieve high efficiency GaP/Si solar cells.
Both samples (structures I and II) show poor EQE values at short wavelengths (∼300 to ∼500 nm). This suggests that the surface reflectance and/or some carrier transport issues at the front side limit the cell performance. By using an antireflection coating (such as SiO x ) on the ITO top layer Reference Herasimenka, Dauksher, Boccard and Bowden25 or texturing the front surface, the carrier collection efficiency can be further improved.
D. a-Si/n-Si/n+Si/n-GaP solar cell (structure IIIA)
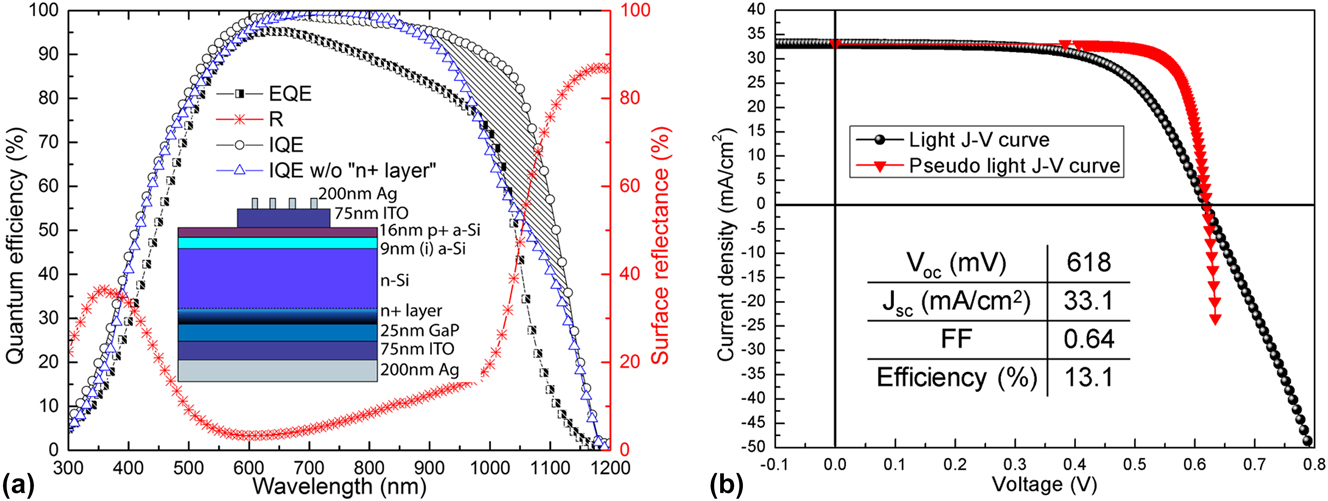
As explained in the introduction section, structure IIIA was prepared by the deposition of a 25-nm-thick GaP layer on the Si wafer at 580 °C. A minority carrier lifetime of ∼113 μs was measured from the GaP/Si sample at an injection level of 1015 cm−3. In comparison, the lifetime of the bulk Si in structure IIIA, measured after etching off the GaP and n+ layers, is ∼2.2 ms, at the same injection level of 1015 cm−3, showing the potential for high carrier collection efficiency from the Si bulk.
The IQE of structure IIIA plotted in Fig. 6(a) was compared to a counterpart sample, prepared without the n+ layer between the n-Si bulk and n-GaP. It clearly shows that the IQE of structure IIIA is significantly higher in the range of ∼900 to ∼1150 nm.
(a) EQE, IQE, and surface reflectance of structure IIIA. (b) Light and pseudo J–V curves of structure IIIA (under AM1.5G condition with an irradiation intensity of 1000 W/m2). The shaded region shows the optical gain in the long wave length regime from 900 to 1150 nm due to implementation of an n+ layer between the n-Si bulk and the n-GaP layer.

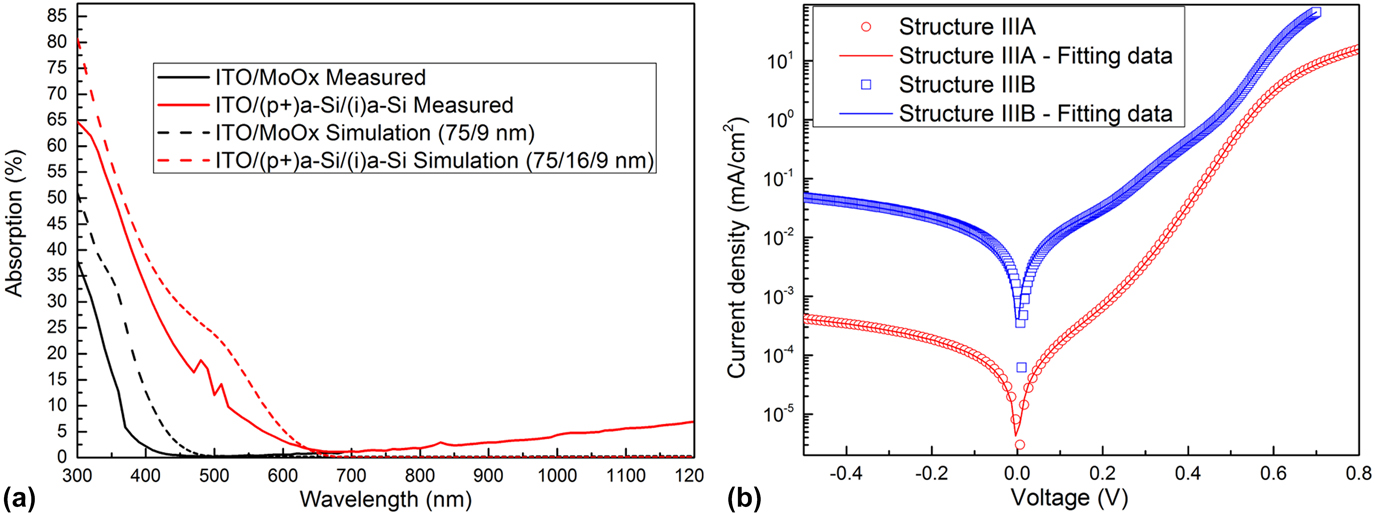
The dark J–V curve of structure IIIA was fit to a two-diode model, Fig. 7(b). The fitting parameters are listed in Table II. The small slope at short circuit was fit to a shunt resistance (R SH) of ∼1.2 × 10³ kΩ cm2, indicative of no shunting problem in the device. Furthermore, the slope of the dark J–V curve around open circuit was fit to a R S of ∼10 Ω cm2. Thus, a series resistance issue, not a shunting issue, is responsible for the FF loss. The carrier transport issue of this device was further confirmed by Suns-V OC measurement, showing that the pseudo light J–V values of FF0 ≈ 80% and η0 ≈ 16.5% are significantly larger than the actual device values of FF ≈ 64% and η ≈ 13.1%. By eliminating the series resistance of the device, an overall ∼16% improvement in the FF can be achieved. This series resistance loss can originate from different factors. First, the ITO sheet resistance (∼50 Ω/sq) and its contact resistance to the Ag are responsible for a small portion of this resistive loss. Second, the extraction loss from the GaP to the ITO layer also contributes to the FF loss. Third and most importantly, the defective GaP/Si interface contributes significantly to this resistive loss. Although the conduction band offset between the GaP and the n+Si is expected to be small, the GaP/Si barrier and the interface recombination velocity are still contributors to the FF loss. By optimizing the GaP thickness, the GaP/Si interface quality, and the doping densities of the device, lower resistance losses and eventually enhancement of the carrier collection efficiency can be achieved. Reference Wurfel, Cuevas and Wurfel2
(a) Simulated and measured absorptance of ITO/MoO x and ITO/(p+)a-Si/(i)a-Si front layers used in the GaP/Si heterojunction solar cells. (b) Experimental and simulated dark J–V curves of 13.1 and 14.1%-efficient GaP/Si heterojunction solar cells. The curve was fitted with a two-diode model with R SH, R S, and two recombination terms (no lifetime-minority correction factor was considered).

Two-diode device parameters of structures IIIA and IIIB.

E. MoO x /n-Si/n+Si/n-GaP solar cell (structure IIIB)
As evident in Fig. 8(a), the IQE of structure IIIA in the short wavelength regime of ∼300 to ∼500 nm is low. This is mainly due to parasitic absorption of the a-Si (∼1.6 eV) and the high defect density of the (p+)a-Si layer. Reference Street, Biegelsen and Knights26 Thus, for a high efficiency n-GaP/n-Si device, the front layers should be less absorptive in the mentioned wavelength range. It is shown that MoO x (x < 3) can be a good alternative material to a-Si as a hole-selective contact due to its wide band gap (∼3 eV) and high work function. Reference Bivour, Temmler, Steinkemper and Hermle27 Recently, a successful integration of MoO x with a HIT (heterojunction with intrinsic thin layer) solar cell resulted in an efficiency of ∼18.8% with high IQE values in the short wavelengths. Reference Battaglia, de Nicolás, De Wolf, Yin, Zheng, Ballif and Javey28 Motivated by that result, a novel structure of MoO x /n-Si/n-GaP can be used to utilize the benefits of MoO x as a hole-selective contact and also GaP as an electron-selective contact, enabling high carrier collection efficiencies, in principle without the need to form doped diffusion layers in the Si absorber. Until now, MoO x has not been successfully demonstrated for GaP/Si heterojunction solar cells. In this section, we present a detailed investigation of the MoO x /n-Si/n-GaP heterojunction solar cell (structure IIIB) for the first time.
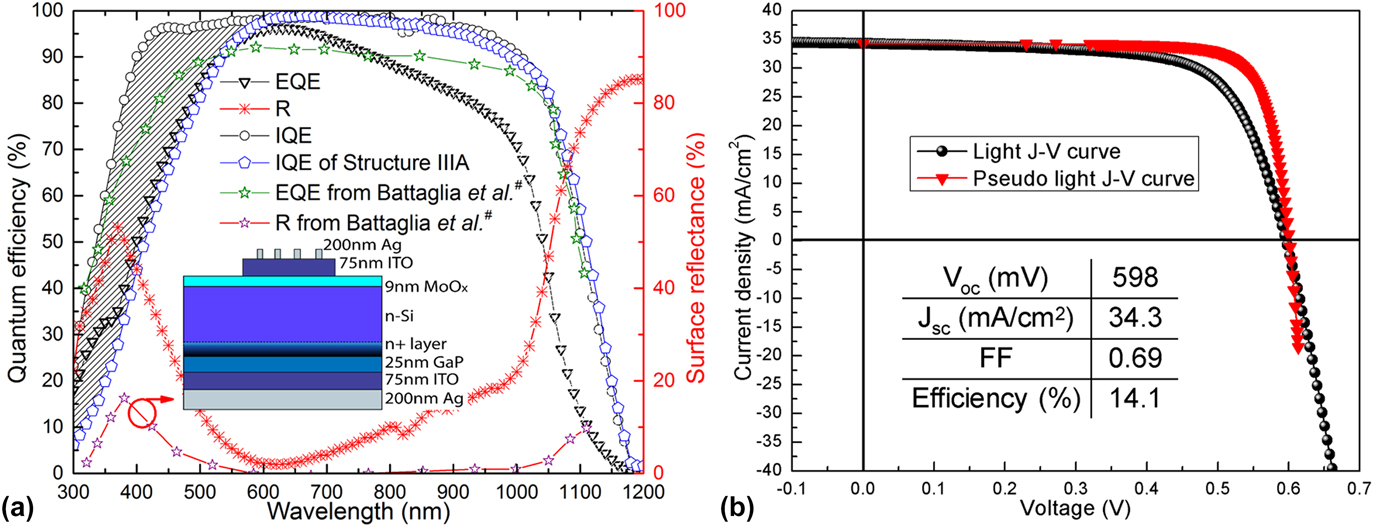
(a) The EQE, IQE, and surface reflectance of structure IIIB (compared to the IQE of structure IIIA and the EQE of a MoO x /Si/a-Si solar cell reported by Battaglia et al. Reference Battaglia, Yin, Zheng, Sharp, Chen, McDonnell, Azcatl, Carraro, Ma, Maboudian, Wallace and Javey31 ). (b) Light and pseudo J–V curves of structure IIIB (under AM1.5G conditions with an intensity of 1000 W/m2). The shaded region shows the difference between the IQE curves of structures IIIA and IIIB.

Figure 8(a) depicts the IQE, EQE, and light J–V characteristics of structure IIIB. The cell has a V OC of ∼598 mV, which is lower than the V OC values reported for conventional high efficiency heterojunction solar cells Reference Herasimenka, Dauksher, Boccard and Bowden25 and structure IIIA. This suggests that the cell performance is affected by the interface passivation of MoO x /Si. However, a J SC of 34.3 mA/cm2 for the MoO x cell (structure IIIB) versus 33.1 mA/cm2 of the a-Si cell (structure IIIA) are consistent with the optical gain observed at short wavelengths (∼300 to ∼550 nm), determined by the IQE data.
To gain an insight into the role of front-side absorption in structures IIIA and IIIB, ITO/(p+)a-Si/(i)a-Si and ITO/MoO x layers, with the same thicknesses used in structures IIIA and IIIB, were deposited on glass substrates. The absorptance values of these two stacks were then compared. Figure 7(a) shows the simulated and measured absorptance of these two stacks. The simulation was performed by OPAL2 software, developed by McIntosh et al. Reference McIntosh and Baker-Finch29 It is evident from Fig. 7(a) that the ITO/MoO x stack has a lower absorptance compared to the ITO/(p+)a-Si/(i)a-Si stack. This led to a higher coupling of short wavelength photons into the device and improved the J SC by 1.3 mA/cm2. Moreover, the results show that the ITO layer is mostly responsible for the absorption of photons at wavelengths above ∼600 nm. In structures IIIA and IIIB, the majority of the parasitic absorption loss below ∼500 nm originates from the a-Si layers, and, to a lesser degree, the ITO and the MoO x layers. Reference Holman, Descoeudres, Barraud, Fernandez, Seif, De Wolf and Ballif30 In structure IIIB, as a result of using a MoO x layer, the short cut-off wavelength from the front side is reduced to ∼410 nm and the absorptance in long wavelengths remains below 3%. Based on these results, it is expected that by reducing the thickness of the (p+)a-Si layer in structure IIIA, the parasitic absorption loss at short wavelengths can be reduced. However, an extremely thin a-Si layer can cause the V OC and FF to drop, which then cancels out the effect of the J SC improvement on the efficiency.
The dark J–V curve of structure IIIB was fit to a two-diode model, as shown in Fig. 7(b). It shows a dark current density (J 01) of ∼6.6 × 10⁻¹³ mA/cm2 and an ideality factor (n1) of ∼1 (listed in Table II). Structures IIIA and IIIB are not directly compared to structures I and II since many of their parameters are different (GaP thickness, carrier lifetime, and front-side a-Si thickness profile).
The high value of the measured R SH (∼10.6 kΩ cm2) of structure IIIB confirms that shunting issues are not primary sources of the loss, similar to structure IIIA. In addition, the small R S (∼1 Ω cm2) and the reduced FF offset (ΔFF = FF − FF0 ≈ 11%) compared to that of structure IIIA suggest that the ITO/MoO x layer indeed improved the carrier transport and the conductivity of the front stack. These results show that the (p+)a-Si/(i)a-Si layer can be successfully replaced by a thin MoO x hole-selective contact to attain higher efficiencies through reduction of the parasitic losses.
The efficiency of structure IIIB (∼14.1%) is not improved significantly since we observed a reduction in the V OC value, which can be attributed to the poor passivation quality of the MoO x /Si interface. It was suggested that good interface passivation can be achieved by inclusion of a thin (i)a-Si layer between the MoO x and n-Si absorber layers at the expense of slight J SC reduction. Reference Battaglia, de Nicolás, De Wolf, Yin, Zheng, Ballif and Javey28
To the best of our knowledge, the performance of structure IIIB is comparable to the best performing textured MoO x /n-Si/(i)a-Si/(n+)a-Si solar cell, reported by Battaglia et al. (V OC = 580 mV, FF = 65%, and η = 14.3%), Fig. 8(a). Reference Battaglia, Yin, Zheng, Sharp, Chen, McDonnell, Azcatl, Carraro, Ma, Maboudian, Wallace and Javey31 The V OC of structure IIIB is higher than that of the reported device, which can be indicative of a better Si passivation achieved by the MoO x and GaP layers. Although the reflectance of the reported textured device is significantly lower than that of structure IIIB, the integrated EQE values are similar. The difference between the EQE graphs is shown in Fig. 8(a). We believe by implementing light trapping techniques, such as surface texturing, the MoO x /n-Si/n-GaP structure has a potential to further increase its conversion efficiency.
IV. CONCLUSION
n-GaP/n-Si heterojunction solar cell with GaP as an electron-selective contact is shown to be a good platform for future high efficiency heterojunction Si-based solar cells. One of the major obstacles in the heterogeneous integration of GaP with Si is a low bulk lifetime of Si after thermal treatment in the MBE chamber. It was shown that even though the lifetime can be maintained by using a low temperature growth method (T < 500 °C), the performance of the device is still limited by a poor GaP crystal quality and the defects in the GaP/Si interface. However, we have shown that an n+ diffused dopant layer allows the Si bulk lifetime to be maintained throughout the III–V growth process, potentially by impurity diffusion suppression, acting as a sink for impurities, and/or as a gettering layer. In addition, this allows growing III–V materials at higher temperatures and subsequently increases their crystal quality. Different GaP/Si solar cells were designed and fabricated based on this lifetime-preserving method. The solar cell with a (p+)a-Si/(i)a-Si/n-Si/n-GaP structure showed a V OC of ∼618 mV and an overall efficiency of 13.1%. Parasitic absorption in the front a-Si layers was shown to be the major limiting factor for J SC and FF. The parameters extracted from dark J–V and Suns-V OC indicate that the significant FF loss originates mainly from series resistance and some carrier transport issues at the heterojunctions. It was also shown that introducing a thin p-emitter layer with higher band gap (E g ≈ 3 eV) and work function than a-Si, as a hole-selective contact, can improve the n-GaP/n-Si cell efficiency. Motivated by that principle, MoO x was successfully used to reduce the parasitic absorption loss at short wavelengths (300–550 nm), caused by the a-Si layers. We observed a significant enhancement in the IQE at short wavelengths which translated into a ∼10% improvement in the J SC and an efficiency of 14.1% (structure IIIB).
ACKNOWLEDGMENTS
The authors would like to thank L. Ding and M. Boccard for their contributions in processing and testing of the solar cells in this study. The authors acknowledge funding from the U.S. Department of Energy under contract DE-EE0006335 and the Engineering Research Center Program of the National Science Foundation and the Office of Energy Efficiency and Renewable Energy of the Department of Energy under NSF Cooperative Agreement No. EEC-1041895.