Coffee and tea are among the most commonly consumed beverages globally(Reference Simon, Fung and Raisi-Estabragh1,Reference Xiang, Xu and Chen2) . The consumption of coffee and tea has been linked to a reduced risk of adverse health outcomes(Reference Ye, Liu and Yang3–Reference Kim, Jeong and Yang10). However, previous studies on the health benefits of coffee and tea only focused on the comparisons between different consumptions(Reference Freedman, Park and Abnet4,Reference Chen, Zhang and Zhang11–Reference Zhang, Yang and Li14) . Given the compositional nature of diet(Reference Stern, Ibsen and MacDonald15), the association estimate lacks a clear interpretation in previous studies, especially when the influences of other beverages are not well-controlled. For example, for some individuals, an increase in coffee or tea consumption may lead to a decrease in plain water consumption, whereas for others, the other components of their diets may not change but increase total fluid consumption. We remain uncertain as to whether the consumption of coffee and tea is inherently beneficial or if the positive influences are primarily due to substituting other beverages with coffee or tea. Specifically, it is often recommended that plain water is healthy(Reference Valtin16). Given the health benefits of coffee and tea, whether these beverages should replace plain water or be consumed additionally is confusing.
Three factors heighten the need to understand the associations of different combinations of the three most popular and healthy beverages, namely, coffee, tea and plain water, with mortality. First, a significant component of both coffee and tea is water. If there is no substitution between coffee, tea and other beverages, the consumption of coffee or tea directly leads to an increase in overall water consumption. It is unclear whether an equivalent amount of plain water would have similar associations because previous studies have found a negative association between water intake and mortality risk(Reference Zhou, Wei and Cui17,Reference Majdi, Hosseini and Naghshi18) . Second, if total fluid consumption is constant, increasing coffee or tea intake implies the likelihood of a compensatory decrease in intake of fluid from elsewhere. We wonder whether coffee, tea and plain water – each regarded as healthy beverages – should be substituted for one another to optimise their benefits on reducing mortality. Third, caffeine, a bioactive compound in coffee and tea, could acutely increase blood pressure by antagonising the adenosine A1 and A2A receptors(Reference Karcz-Kubicha, Antoniou and Terasmaa19) and consequently increasing urine production. For those with low total water intake but consuming coffee or tea, dehydration may become more likely, resulting in low-grade inflammation within the human body(Reference Majdi, Hosseini and Naghshi18) and linked to the progression of some chronic diseases(Reference Sontrop, Dixon and Garg20) and mortality(Reference Wu, Chen and Liaw21). The remaining question is: Should people with low total water intake not replace plain water with coffee or tea? Under conditions of low water intake, does dehydration potentially outweigh other benefits of coffee and tea?
In general, investigating the optimal total intake and combination of the three most popular healthy beverages results in more specific and clear public health recommendations(Reference Zhao, Zhang and Coday22,Reference Ma, Hu and Alperet23) . Emerging evidence suggests that the combination of < 1–2 drinks/d of coffee and 2–4 drinks/d of tea is associated with lower mortality risks than consuming neither of them(Reference Chen, Zhang and Zhang11). A previous study included water intake or consumption of other beverages (such as juice, milk and soda) in the multivariable model to investigate the association of tea consumption with all-cause and cause-specific mortality(Reference Inoue-Choi, Ramirez and Freedman24). However, the study only partially controlled for the influences of other beverages, and most other studies did not even consider this potential confounding when investigating the benefits of coffee and tea. Consequently, they are still unable to directly provide a satisfactory answer to the aforementioned questions. To our knowledge, no prior work has analysed the associations of coffee, tea and plain water with mortality, including total intake and the optimal allocation strategy for their consumption that is associated with low mortality risk.
In the present study, we sought to be more specific about the question of interest by focusing on the ‘relative associations’(Reference Breskin and Murray25) of plain water, coffee and tea. First, we examined the associations of total intake of coffee, tea and plain water with all-cause and cause-specific mortality using the data of a large population-based longitudinal cohort of the UK Biobank. Second, to focus on the optimal drinking strategy for coffee, tea and plain water, we estimated the mortality risk associated with the substitution of any one of the three beverages for another at different levels of total intake within a compositional data analysis framework(Reference McGregor, Palarea-Albaladejo and Dall26). We rigorously accounted for the influence of other fluid intake to the fullest extent possible.
Methods
Study design
The UK Biobank cohort recruited 502 294 participants between 2006 and 2010. Participants provided dietary and health-related information through questionnaires and physical measurements, as detailed in prior publications(Reference Sudlow, Gallacher and Allen27,Reference Palmer28) . The UK Biobank study was approved by the North West Multi-centre Research Ethics Committee (21/NW/0157).
Participants eligible for inclusion were those who had completed the online 24-h dietary recall questionnaire at least once. We excluded participants with implausible energy intake (defined as those in the highest or lowest 1 % of the energy intake(Reference Liu, Li and Shen13)), those who withdrew from the UK Biobank and those lacking data on coffee, tea or plain water intake in their 24-h dietary recalls (online Supplementary Fig. S1).
Assessment of coffee, tea and plain water consumption
Dietary information was collected using a dietary questionnaire based on a 24-h dietary recall of the previous day, which assessed the types and quantities of foods and beverages consumed, including daily nutrient intake(Reference Liu, Young and Crowe29). Participants were invited to complete this questionnaire on five occasions over 1 year, from April 2009 to June 2012. Each 24-h dietary recall required participants to record how many drinks of coffee, tea and plain water they consumed in the prior 24 h. The average number of drinks reported across multiple dietary recalls was used as a measure of habitual intake(Reference Liu, Li and Shen13). More details are described in online Supplementary Text S1. The consistency of coffee, tea and plain water consumption across multiple assessments was demonstrated in online Supplementary Table S1.
Assessment of outcomes
Mortality data for all deaths occurring before 30 November 2022 were sourced from death certificates(30). The causes of death were classified using the International Statistical Classification of Diseases and Related Health Problems, 10th Revision (ICD-10). We analysed all-cause mortality and mortality due to CVD (ICD-10: I00–I99), cancer (C00–D48), respiratory disease (J00–J99) and digestive disease (K00–K93), respectively.
Assessment of covariates
Covariates including sociodemographics, lifestyle and health conditions were assessed at baseline. Sociodemographic factors included sex, age, Townsend deprivation index, ethnicity, education level, waist circumference and BMI. Lifestyle factors included smoking status, physical activity over the past week, use of vitamins and mineral supplements and dietary intake of total energy, fresh fruit, vegetables, red meat, processed meat and alcohol. Health conditions included long-standing illness, hypertension, diabetes, the use of blood pressure medication, kidney disease, CVD and cancer. To account for the potential confounding influence of total fluid volume and other beverages, the total weight of soups and beverages from the overall diet was considered as covariates. The weight of total sugars from the overall diet was adjusted as well. Details of the assessments can be found in online Supplementary Text S2.
Statistical analyses
Participant characteristics are presented as median (interquartile range) for continuous variables and number (percentage) for categorical variables.
We used multiple imputations by chained equations to impute any missing covariate values, creating ten data sets and combining the main results using Rubin’s rule. The Cox proportional hazard regression model was used to assess the associations of mortality with the total intake of coffee, tea and plain water, adjusting for all covariates. The proportional hazards assumption for the Cox model was tested using the Schoenfeld residuals method. Dose–response relationships were examined using restricted cubic splines with knots at the 25th, 50th and 75th percentiles of total intake. The generalised variance inflation factor for each covariate was calculated to check for multicollinearity. The covariate-adjusted hazard ratio (HR) and its 95 % CI were estimated.
Next, we estimated the mortality risk associated with coffee, tea or plain water relative to the other two drinks and explored how reallocating consumption from coffee to tea or plain water is associated with changes in mortality hazard within a compositional data analysis framework(Reference McGregor, Palarea-Albaladejo and Dall26). In brief, we constructed two isometric log-ratio (ILR) coordinates for isometric mapping of the relative consumption of each of the three drinks. One example of the two ILR pivot coordinates was as follows:
 $$ILR\_Coordinat{e_1} = \sqrt {\left( {2/3} \right)} \ln \left( {Coffee/{{\left( {Tea \times Plain\;water} \right)}^{1/2}}} \right)$$
 $$ILR\_Coordinat{e_2} = \sqrt {\left( {1/2} \right)} \ln \left( {Tea/\left( {Plain\;water} \right)} \right)$$
These two ILR pivot coordinates were incorporated into Cox proportional hazards regression as representations of the three raw variables concerning coffee, tea and plain water consumption, fully controlling for the total intakes of the three drinks and other covariates. The coefficient of
 $ILR\_Coordinat{e_1}$
signifies the relative importance of coffee compared with the total amount of tea and plain water. Specifically, an HR value greater than 1 indicates that a higher relative consumption of the beverage compared with tea and plain water is associated with an increased hazard. The ratio corresponding to the smallest HR is considered the optimal ratio. To explore the association of one drink relative to the other two, we conducted three separate models. More details about the compositional data analysis framework can be found in online Supplementary Text S3.
Additionally, we performed subgroup analyses by age, sex, education level, BMI and long-standing illness. We conducted the following sensitivity analyses to assess the robustness of the results: (1) excluding participants who had an outcome event during the first 2 years of follow-up to minimise potential reverse causality; (2) excluding participants with missing covariates; (3) including participants with implausible energy intake; (4) excluding participants with CVD or cancer at baseline; (5) deriving a variable, healthy diet(Reference Zhang, Chen and Pan31), to replace the original fruit, vegetable and meat variables; and (6) including participants with an implausible energy intake or those who withdrew from the UK Biobank.
Analyses were performed using R (version 4.3.0, R Foundation for Statistical Computing). A two-sided P value less than 0·05 was considered to be statistically significant.
Results
Characteristics of the study population
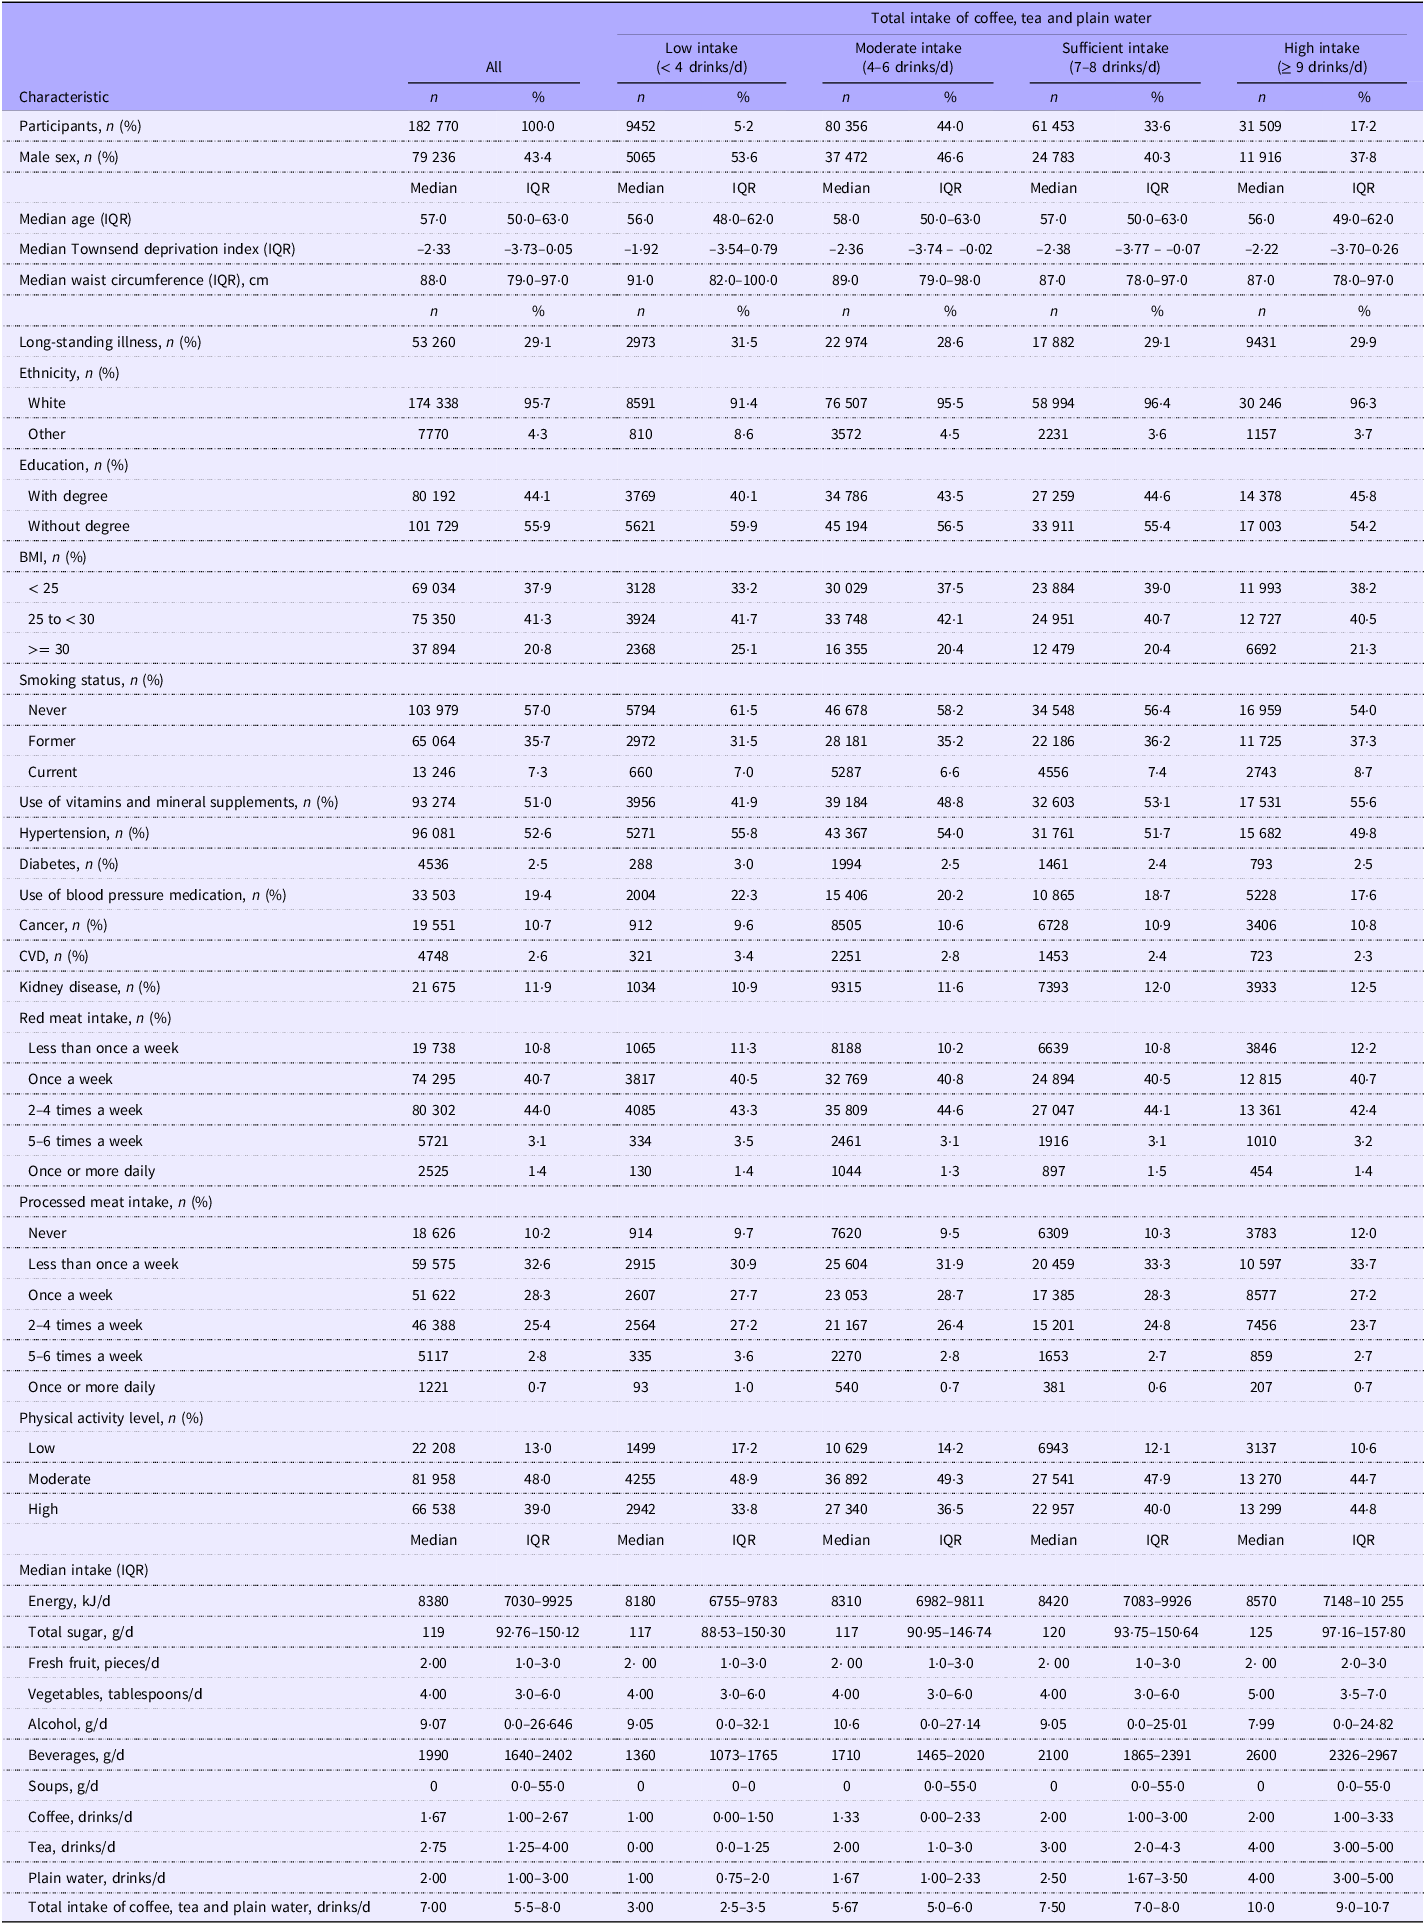
This study included 182 770 participants with a median age of 57 years; 43 % of whom were male. The majority were White people (95·7 %), those without a college or university degree (55·9 %) and non-smokers (57·0 %). The median daily intake of coffee, tea and plain water was 1·67, 2·75 and 2·00 drinks, respectively. The proportion of participants consuming 4–8 drinks of coffee, tea and plain water combined per day was 77·6 %. A larger proportion of participants who consumed fewer than 4 drinks/d were males, those of a lower social class, non-White, non-smokers, obese individuals and those having diabetes, hypertension or CVD, as compared with people having a higher total daily intake. Nevertheless, the percentage of people having a university or college degree or engaging in high levels of physical activity among the participants consuming < 4 drinks/d was lower than that among others (Table 1). The characteristics of participants with implausible energy intake and those who withdrew from the UK Biobank are described in online Supplementary Table S2.
Baseline characteristics of participants

IQR, interquartile range.
Non-linear associations of mortality with total intake of coffee, tea and plain water
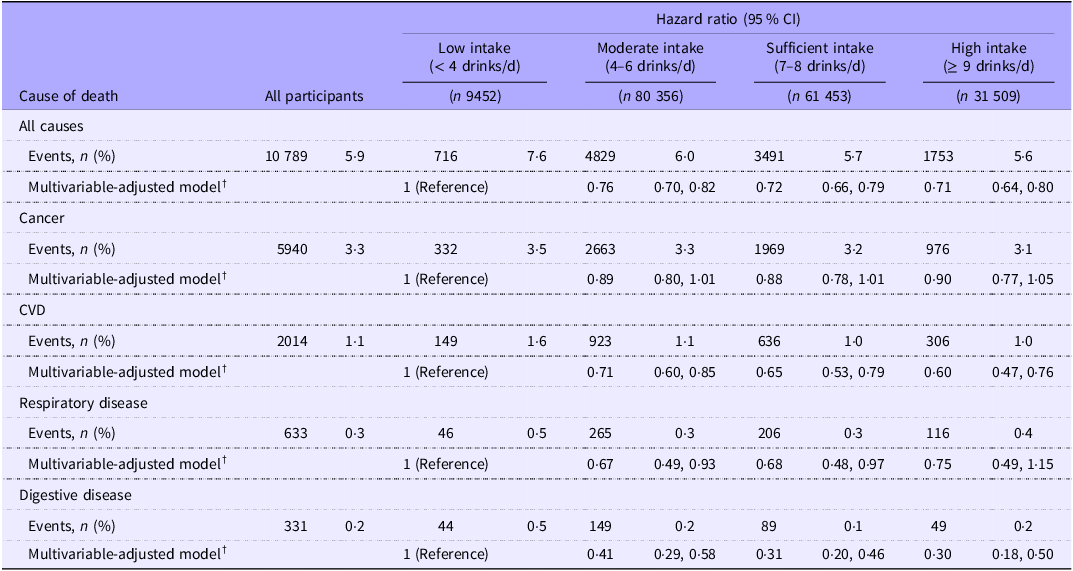
Over a median follow-up of 13·3 years, 10 789 deaths were documented (5·9 %) (Table 2). Among these, 5940 (3·3 %) were due to cancer, 2014 (1·1 %) to CVD, 633 (0·3 %) to respiratory diseases and 331 (0·2 %) to digestive diseases.
Hazard ratios of all-cause and cause-specific mortality associated with different levels of total intake

† Estimates are hazard ratios (95 % CI) from Cox regression models adjusted for age, sex, Townsend deprivation index, waist circumference, long-standing illness, education level, ethnicity, BMI, smoking status, vitamin and mineral supplement use, hypertension, diabetes, blood pressure drug use, kidney disease, CVD, cancer, physical activity level, red meat intake, processed meat intake and intake of total energy, total sugar, fresh fruit, vegetables, alcohol, beverages and soups.
We found non-linear associations between the total intake of coffee, tea and plain water and all-cause mortality, as well as mortality from digestive and respiratory diseases (P for non-linear < 0·05). However, the associations with cancer mortality and CVD mortality did not exhibit non-linearity (Fig. 1). We observed that consuming at least approximately 7–8 drinks/d was associated with lower mortality. We then categorised total consumption into four groups: less than 4 drinks/d (low intake, fewer than half of the optimal intake), 4–6 drinks/d (moderate intake), 7–8 drinks/d (sufficient intake) and more than 9 drinks/d (high intake). Compared with low intake, the moderate, sufficient and high intake categories were associated with a lower risk of all-cause mortality, even after adjustment for all covariates under study, with an HR of 0·76 (95 % CI, 0·70, 0·82), 0·72 (95 % CI, 0·66, 0·79) and 0·71 (95 % CI, 0·64, 0·80), respectively (Table 2). The pattern of the association between total intake and mortality from CVD and respiratory diseases was largely similar to that for all-cause mortality, and the association of total intake was more pronounced for digestive disease mortality, while the association was statistically non-significant for cancer mortality (Table 2).
Hazard ratios of all-cause and cause-specific mortality associated with total intake of coffee, tea and plain water †. † Hazard ratios and 95 % CI are based on Cox proportional hazards models and are comparing the specific level of the exposure (horizontal axis) to the lowest total intake of coffee, tea and plain water. Adjusted for sex, age, Townsend deprivation index, ethnicity, education level, waist circumference, BMI, smoking status, physical activity level, use of vitamins and mineral supplements, long-standing illness, hypertension, diabetes, the use of blood pressure medication, kidney disease, CVD, cancer, dietary intake of total energy, fresh fruit, vegetables, red meat, processed meat, alcohol, the total weight of soups and beverages and total sugars from overall diet. HR, hazard ratio.

Associations of different substitution strategies for coffee, tea and plain water consumption with mortality
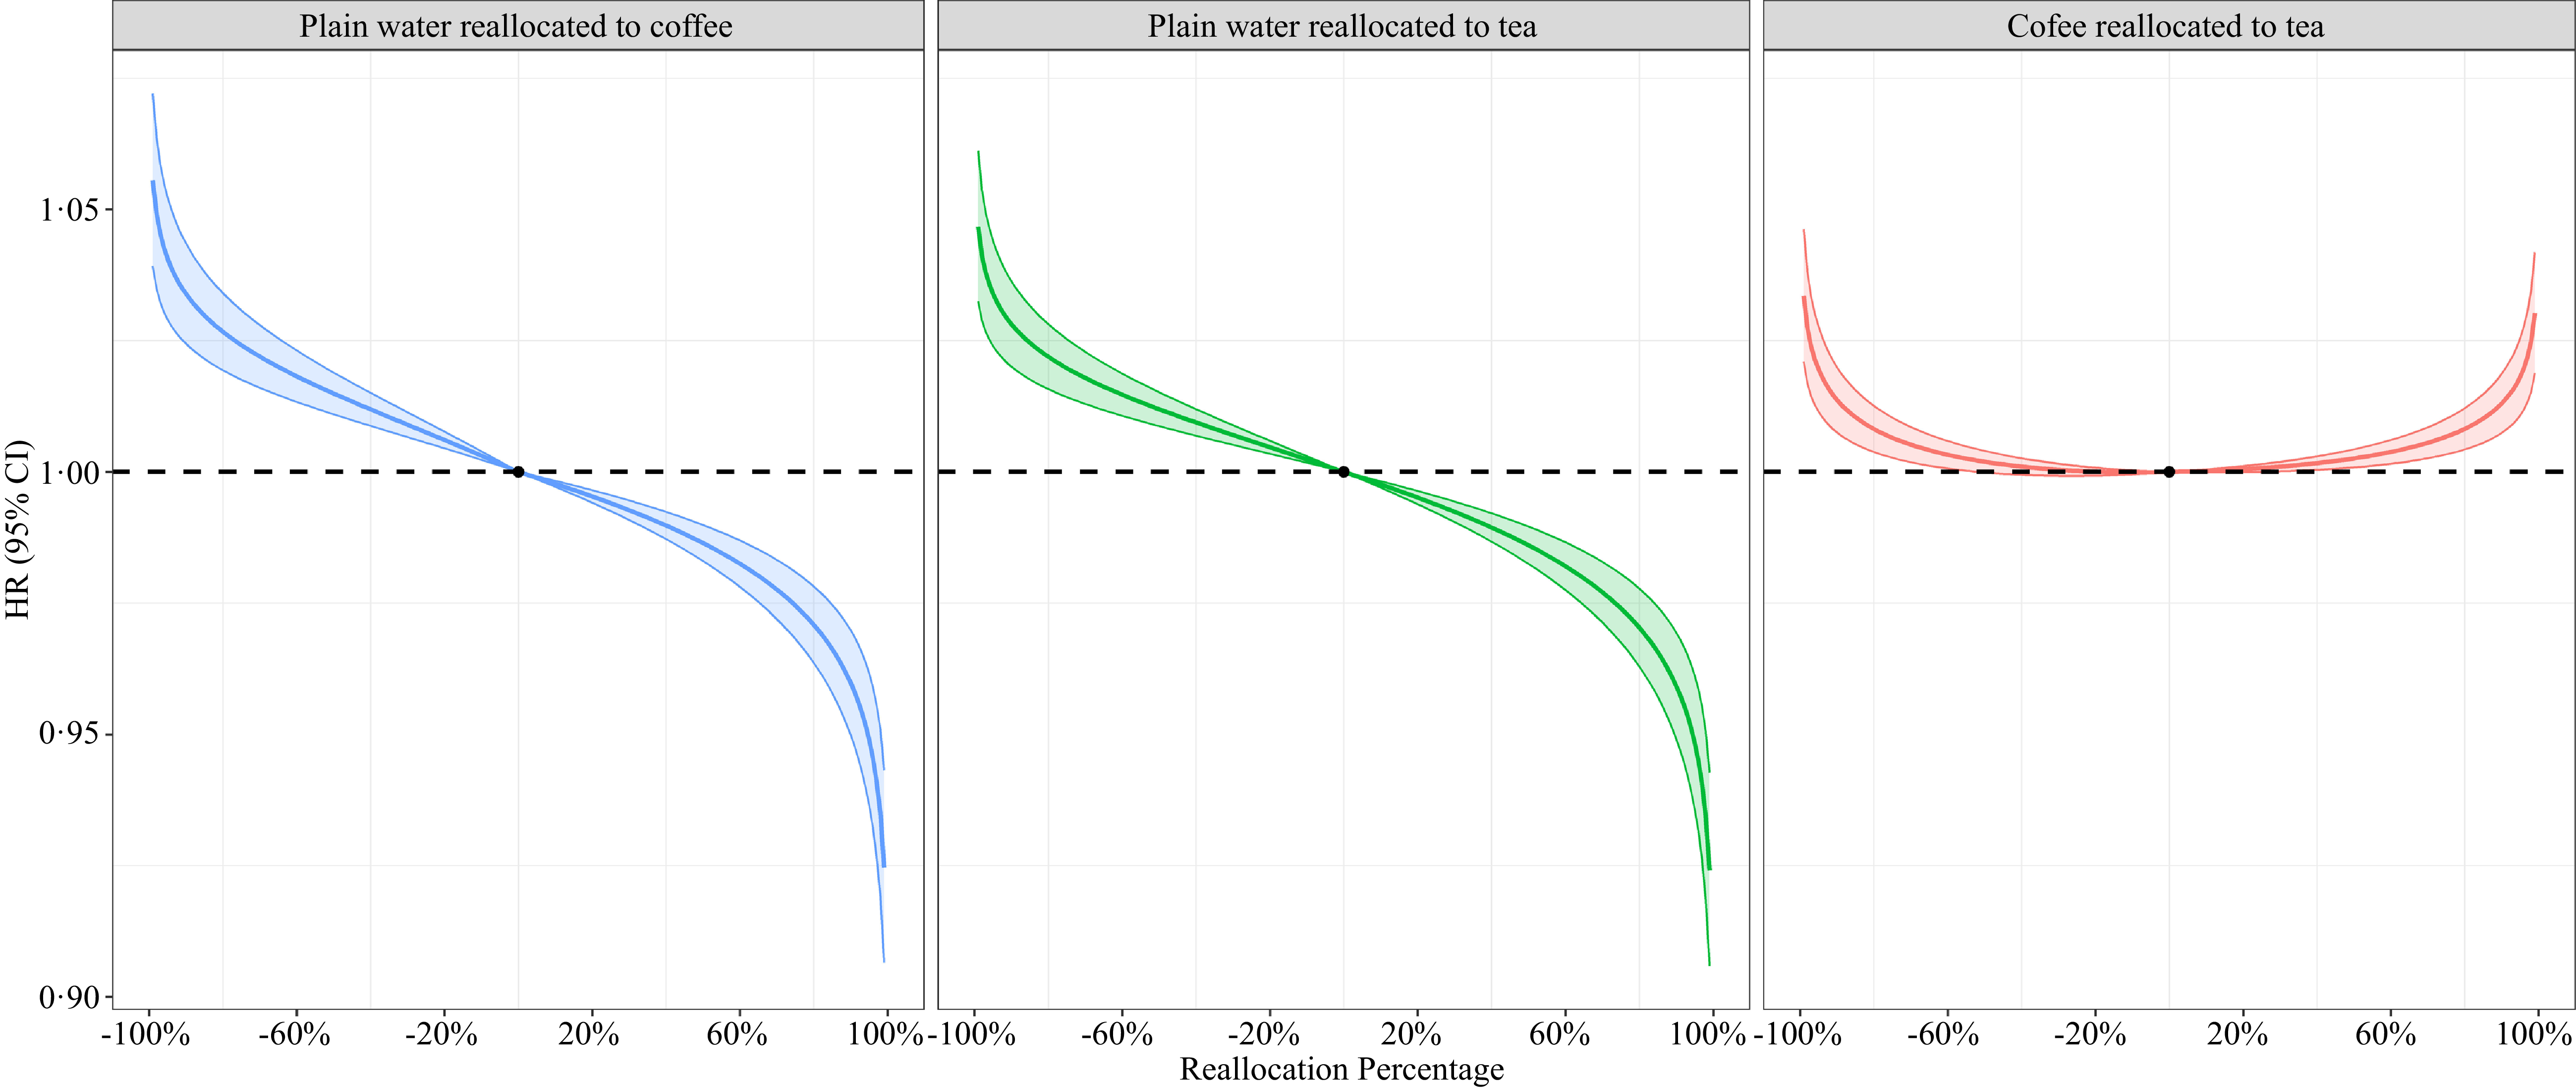
Figure 2 illustrates the associations of reallocating plain water into coffee or tea, and vice versa, with mortality after adjusting for total intake and other covariates. Reallocating plain water into coffee or tea was associated with reduced all-cause mortality, whereas replacing coffee or tea with plain water was linked to increased mortality. Furthermore, shifting excess coffee into tea or vice versa was associated with increased mortality. The associations with cause-specific mortality showed similar trends (online Supplementary Fig. S2). Specifically, only minor reciprocal substitutions near the 2:3 ratio did not significantly increase mortality risk. The comparisons of different ratios also suggest that a more balanced allocation between coffee and tea is associated with lower mortality (online Supplementary Fig. S3). Consequently, a balanced combination (roughly 2:3 ratio) of coffee and tea consumption is associated with the lowest mortality.
Hazard ratios of all-cause mortality associated with equivalent substitutions between two drinking components while holding the third component constant †. † Hazard ratios and 95 % CI are comparing the specific reallocation percentage (horizontal axis) to the combination of coffee, tea and plain water consumption at the ratio of 2:3:2 (the mean composition). Adjusted for sex, age, Townsend deprivation index, ethnicity, education level, waist circumference, BMI, smoking status, physical activity level, use of vitamins and mineral supplements, long-standing illness, hypertension, diabetes, the use of blood pressure medication, kidney disease, CVD, cancer, dietary intake of total energy, fresh fruit, vegetables, red meat, processed meat, alcohol, the total weight of soups and beverages and total sugars from overall diet. HR, hazard ratio.

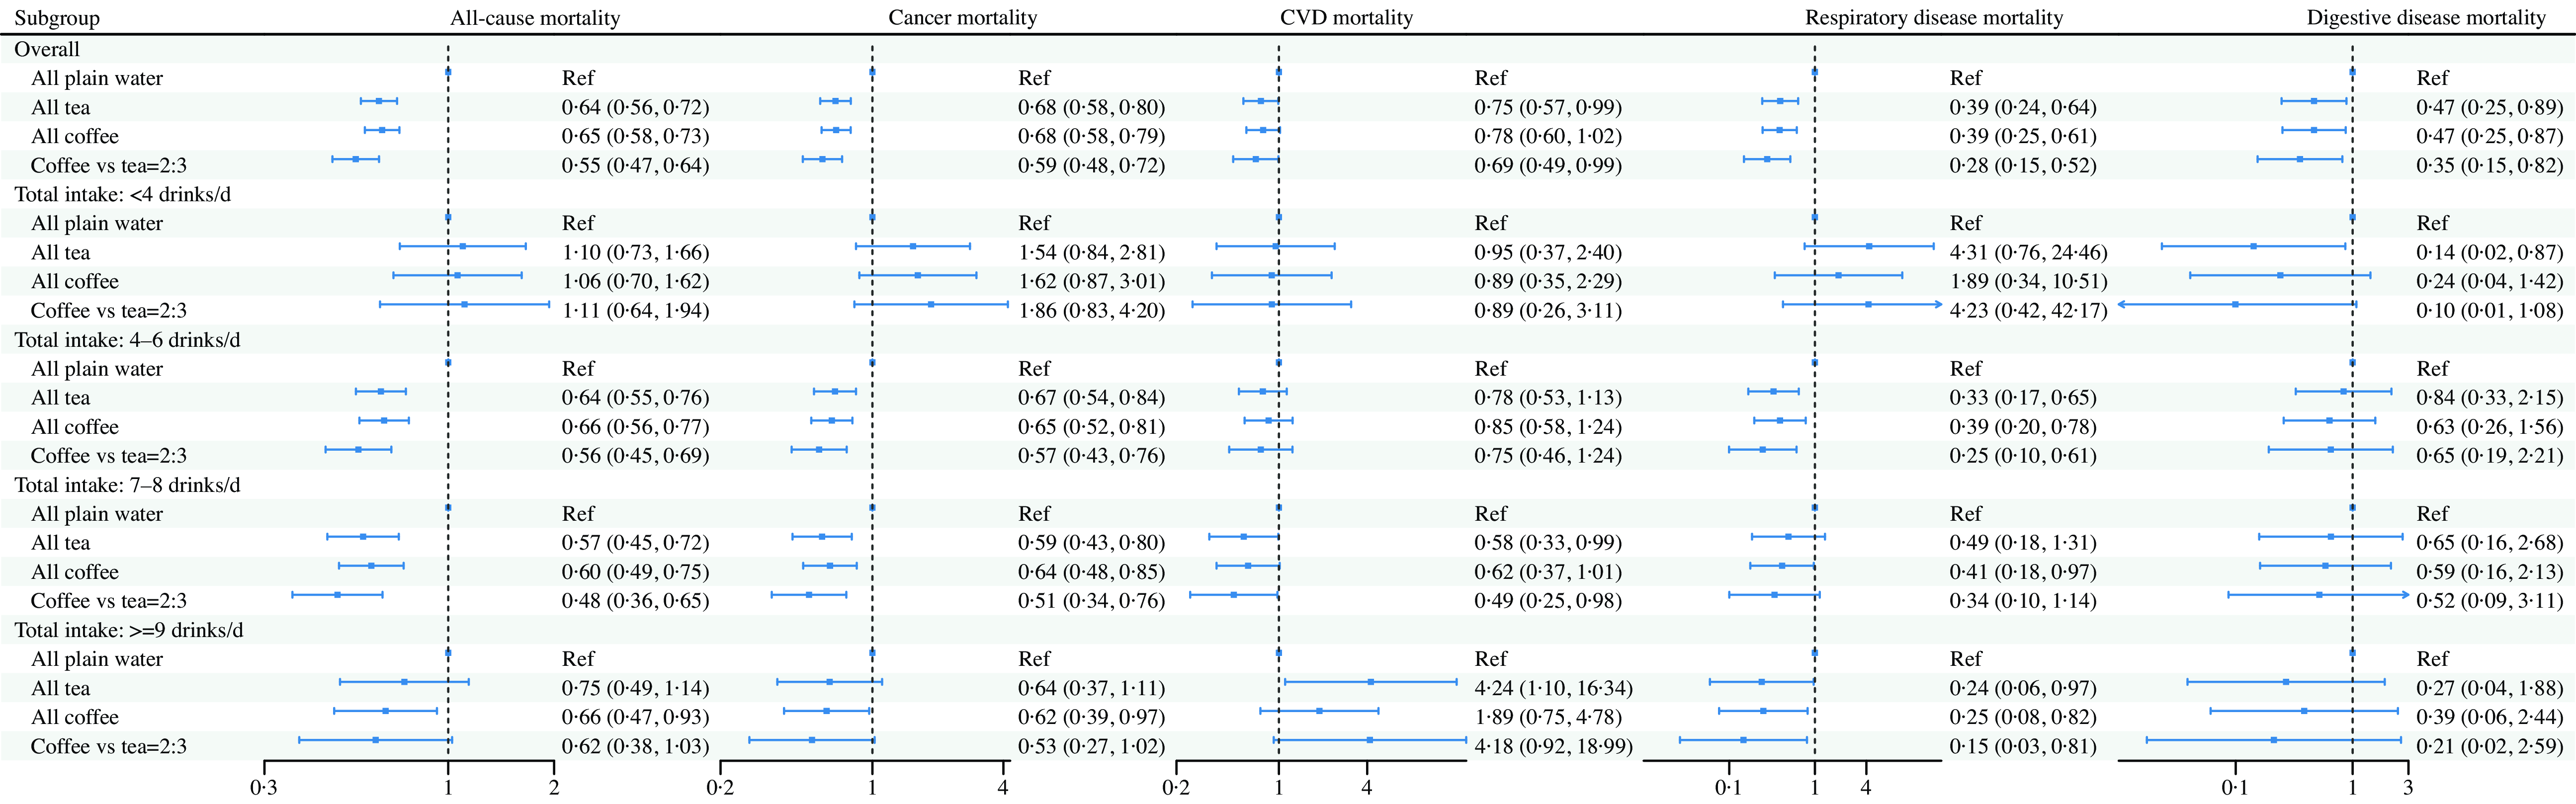
Figure 3 further demonstrates the HR of mortality associated with various drinking strategies as compared with the intake composed entirely of plain water across different levels of total intake. Overall, maintaining a balanced combination of coffee and tea (approximately 2:3) was associated with the lowest mortality risk: 0·55 (95 % CI 0·47, 0·64) for all causes, 0·59 (95 % CI 0·48, 0·72) for cancer, 0·69 (95 % CI 0·49, 0·99) for CVD, 0·28 (95 % CI 0·15, 0·52) for respiratory diseases and 0·35 (95 % CI 0·15, 0·82) for digestive diseases. In instances of total intake exceeding 4 drinks/d, the benefits of coffee and tea relative to all plain water were consistently observed for all-cause, cancer, respiratory and digestive disease mortality (Fig. 3 and online Supplementary Table S3). However, for those with a low intake (less than 4 drinks/d), coffee and tea showed less benefit compared with plain water, although the differences were not statistically significant. Additionally, when total intake was greater than 9 drinks/d, consuming tea and/or coffee was likely associated with a higher risk for CVD mortality than plain water.
Hazard ratios of all-cause and cause-specific mortality with different compositions of the total intake †. † Hazard ratios and 95 % CI are comparing the specific compositions (namely, all tea, all coffee and coffee v. tea = 2:3) to all plain water in the overall population and the population with different levels of total intake. Adjusted for sex, age, Townsend deprivation index, ethnicity, education level, waist circumference, BMI, smoking status, physical activity level, use of vitamins and mineral supplements, long-standing illness, hypertension, diabetes, the use of blood pressure medication, kidney disease, CVD, cancer, dietary intake of total energy, fresh fruit, vegetables, red meat, processed meat, alcohol, the total weight of soups and beverages and total sugars from overall diet. HR, hazard ratio.

Subgroup and sensitivity analyses
In the cases where the total intake exceeded 4 drinks/d, the benefits of replacing plain water with coffee and tea were consistently observed across all subgroups by sex, age, education level, BMI and long-standing illness (online Supplementary Fig. S4). Results of sensitivity analyses suggested that the main results remained robust when including only the participants with complete data; excluding those who died within the first 2 years of follow-up; including participants with implausible energy intake; excluding participants with CVD or cancer at baseline, deriving a composite variable, healthy diet, to replace the original fruit, vegetable and meat variables; and including participants with an implausible energy intake or those who withdrew from the UK Biobank (online Supplementary Tables S4–S9).
Discussion
To our knowledge, this study is the first to focus on the ‘relative associations’ between coffee, tea and plain water. Through this perspective, we attempted to assess the appropriate total intake and the optimal allocation strategy for coffee, tea and plain water consumption that was associated with low mortality risk after fully adjusting for covariates within a compositional data analysis framework. In this large prospective population-based cohort, we found that total intake of coffee, tea and plain water was associated with mortality, with the lower mortality risk observed with at least approximately 7–8 drinks/d. We also discovered that, given the total intake, a balanced combination of coffee and tea offered greater benefits in mortality reduction compared with consuming only coffee or tea. Substituting plain water with coffee or tea was associated with decreased mortality if the total intake exceeded 4 drinks/d, although this benefit was not evident in the individuals with a lower total intake.
Previous studies have found relationships between coffee and tea consumption and mortality; however, the nature of the associations remains contentious. Studies have found various patterns, including U-shaped, J-shaped, linear and null associations between the intake of coffee and tea and mortality(Reference Poole, Kennedy and Roderick5,Reference Chung, Zhao and Wang9,Reference Chen, Zhang and Zhang11,Reference Kim, Je and Giovannucci32) . On the one hand, this heterogeneity may stem from variations in the populations enrolled in the study. On the other hand, seemingly similar evidence may be incorrectly aggregated in nutrition epidemiological studies(Reference Stern, Ibsen and MacDonald15). For example, individuals who are advised to consume two drinks of coffee per day have many ways to achieve it (i.e. by decreasing tea, plain water or some combination of them or just intake coffee additionally), and these different substitutions may have significant implications for the outcome, especially when the influences of other beverages are not well controlled. From the perspective of the compositional data analysis framework, our findings focus on the ‘relative association’ and highlight the importance of the rational combination of coffee, tea and plain water, with particular emphasis on ensuring adequate total intake, offering more comprehensive and explicit guidance for individuals seeking to begin reaping the benefits associated with coffee and tea consumption.
Our study underscored the significance of adequate consumption of coffee, tea and plain water. First, the consumption of coffee, tea and plain water can contribute to an overall increase in daily fluid intake. Adequate hydration is essential for vital physiological and metabolic processes(Reference Majdi, Hosseini and Naghshi18,Reference Manz and Wentz33,Reference Popkin, D’Anci and Rosenberg34) . Our study suggests that an optimal total intake of at least approximately 7–8 drinks/d of coffee, tea and plain water is associated with a lower mortality risk. More importantly, the potential benefits of coffee and tea may be contingent upon sufficient total consumption. We found that if the total intake was below 4 drinks/d, consuming either plain water, coffee or tea did not exhibit a statistically significantly different association with mortality. As anticipated, caffeine could acutely increase urine production by antagonising the adenosine A1 and A2A receptors(Reference Karcz-Kubicha, Antoniou and Terasmaa19) and inhibiting the release of antidiuretic hormone. The potential benefits of coffee and tea may be counterbalanced or even surpassed by the adverse influences associated with dehydration. Consequently, there may be insufficient evidence to substantiate the recommendation for individuals who are under conditions of low total intake to consume coffee or tea.
The associations between beverage consumption and cancer risk and mortality remain controversial and unclear. While stronger inverse relationships have been reported for coffee or tea consumption in relation to deaths from colorectal cancer and liver cancer(Reference Poole, Kennedy and Roderick5), several cohort studies have found no significant association(Reference Freedman, Park and Abnet4,Reference Ding, Satija and Bhupathiraju35–Reference van den Brandt38) or only a weak inverse relationship(Reference Park, Freedman and Haiman39) concerning overall cancer mortality. The reasons behind the statistically non-significant association observed between total intake of coffee, tea and plain water with cancer mortality are not well understood. Potential mechanisms may include thermal injury to the mucosa and inflammation resulting from the consumption of beverages at high temperatures(Reference Shin, Lee and Loftfield40,Reference Yu, Tang and Guo41) , which could counteract any potential health benefits associated with coffee, tea or plain water. Furthermore, our study highlights the need for additional research to determine whether beverage consumption is linked to the incidence or mortality of specific types of cancer.
We compared pairwise substitutions of the three beverages and concluded that both coffee and tea are associated with a reduced risk of mortality when compared with plain water on the basis of moderate or sufficient total intake (approximately 4–8 drinks/d). Furthermore, we found that a balanced combination of coffee and tea (roughly a ratio of 2:3) demonstrated greater benefits compared with the separate consumption of either beverage alone. Several biologically plausible mechanisms may explain the beneficial influences of coffee and tea intake. First, coffee contains various bioactive constituents, such as chlorogenic acids, melanoidins and trigonelline, which may reduce oxidative stress and inflammation(Reference Hang, Kværner and Ma42–Reference Martínez-López, Sarriá and Mateos44). Second, tea is rich in polyphenols, particularly catechins, which offers antioxidant and anti-inflammatory properties(Reference Bag, Mondal and Majumder45). These antioxidant and anti-inflammatory properties may lead to a decreased risk of mortality by slowing the development of some major chronic diseases, such as CVD and cancer(Reference Kim, Je and Giovannucci32). Third, coffee and tea are distinct beverages with both overlapping and divergent constituents(Reference Hayakawa, Ohishi and Miyoshi46). The synergistic protective influences of various antioxidants and other bioactive components may be present in these two beverages(Reference Kokubo, Iso and Saito47). Additionally, coffee and tea possess distinct polyphenolic compositions. These specific polyphenols have shown potential benefits in improving endothelial function, insulin resistance and anti-inflammatory responses through their interactions with different target molecules(Reference Marventano, Salomone and Godos48). In line with our findings, previous studies also supported the additional benefits of combining coffee and tea(Reference Chen, Zhang and Zhang11,Reference Zhang, Yang and Li14) . By contrast, we explicitly prescribed the substitutions and doses; the association estimate has a clear interpretation.
Notably, we found that the risk of CVD mortality tended to increase if plain water was replaced with coffee or tea when the total intake exceeded 9 drinks/d. Previous studies have indicated that caffeine could increase heart rate and blood pressure(Reference van Dam, Hu and Willett49). Tannins in coffee and tea decrease Ca and Fe absorption, and diterpenes increase cholesterol levels(Reference Ruggiero, Di Castelnuovo and Costanzo50). A meta-analysis of randomised controlled studies showed a positive dose–response relationship between coffee intake and increased levels of TAG, total cholesterol and LDL-cholesterol(Reference Cai, Ma and Zhang51). These findings suggest that excessive consumption of coffee or tea may counteract potential benefits.
Our study may shed light on future clinical practice and public health. While plain water is widely advocated by the general public due to its accessibility and beneficial associations with health, our study revealed that coffee and tea were more favourable alternatives under specific circumstances. By categorising the total intake of coffee, tea and plain water, we provided a more detailed reference for clinical practice. For individuals with or without fluid restrictions, our findings elucidated the relative associations of coffee and tea compared with plain water, emphasising the importance of considering optimal combinations among these three popular beverages.
It is crucial to acknowledge several potential limitations. First, given the observational nature of our study design, residual confounding arising from measurement errors in covariates (including dietary and lifestyle factors) and unmeasured confounding (such as genetic susceptibility) may still be present, even though we have included a variety of potential covariates that are available. Second, participants may have misconceptions regarding the precise volume of their typical beverage in millilitres. Additionally, diet is a time-varying exposure as individual habits and food compositions may change over time. We used repeated dietary intake measurements to calculate averages to reduce random errors and provide a more accurate representation of long-term dietary patterns. Nevertheless, eliminating measurement errors from dietary assessment is still unlikely(Reference Satija, Yu and Willett52). Third, reverse causality may be present. For instance, participants may change their drinking habits due to health conditions. However, sensitivity analyses excluding participants who died during the first 2-year follow-up produced similar results to the main analyses. Fourth, due to the complexity of the diet, we did not perform subgroup analyses stratified by the type of coffee and tea consumed, for example, the addition of sugar. Nonetheless, we have attempted to adjust for dietary intake of total energy and the weight of total sugars to control for the potential confounding. Distinguishing between various types of coffee and tea often leads to excessively detailed combinations of different beverages, resulting in insufficient sample sizes for statistically modelling each specific combination. Conversely, when all varieties are aggregated for analysis, this approach can be used to evaluate and interpret the magnitude of the average association. Further research investigating more complex dietary exposures should be encouraged to improve the certainty of the evidence.
Conclusions
Our study clearly defines the research question by focusing on the ‘relative association’ between coffee, tea and plain water and indicates that an appropriate drinking strategy is associated with a decreased risk of all-cause and cause-specific mortality. It is recommended to consume at least approximately 7–8 drinks/d of coffee, tea and plain water in total and maintain a balanced combination of coffee and tea. With sufficient total intake, reducing the proportion of plain water could provide additional benefits. These novel findings have significant implications for clinical practice and public health.
Supplementary material
For supplementary material/s referred to in this article, please visit https://doi.org/10.1017/S0007114525104248.
Acknowledgements
This research was conducted using the UK Biobank resource (application number: 91019). The authors would like to thank the participants of the UK Biobank study.
This work was supported by the National Natural Science Foundation of China (82373679) to CO and Guangdong Basic and Applied Basic Research Foundation (2021A1515220065 to CO, 2024A1515011957 to LL). The funding source had no role in study design, preparation of this manuscript or decision to submit the paper for publication.
C-Q. O. and L. L. designed the research; C. S. conducted research and analysed data; L. L. and C. S. wrote the paper; and C-Q. O., Y-K. W., M-Q. Y., Z. P., J-L. Z., Y-M. T. and L. Y. interpreted the results and commented on previous versions of the manuscript. All authors have seen and approved the manuscript for submission.
The authors have nothing to disclose.
The data that support the findings of this study are available from the UK Biobank, but restrictions apply to the availability of these data, which were used under licence for the present study and so are not publicly available. The UK Biobank resources are, however, available and can be accessed through applications on their website (https://www.ukbiobank.ac.uk/).