NOMENCLATURE
 $ {a}_{j}$
decomposed Fourier coefficients related to planform
- $ {A}_{j}$
Fourier coefficients in the lifting-line solution
- $ b$
span of the wing
- $ {{b}}_{{j}}$
decomposed Fourier coefficients related to symmetric twist
- $ c$
local section chord length
- $ {{c}}_{{j}}$
decomposed Fourier coefficients related to aileron design
- $ {{C}}_{{D}{i}}$
induced drag coefficient
- $ {{C}}_{{D}{0}}$
simplified induced drag coefficient
- $ {{C}}_{L,\alpha }$
section-lift slope
- $ {{C}}_{\ell}$
rolling-moment coefficient
- $ {{C}}_{{n}}$
yawing-moment coefficient
- $ {{\skew3\tilde{L}}}$
local section lift
- $ N$
number of terms retained in a truncated infinite series
- $ {{R}}_{{A}}$
wing aspect ratio
- $ {{R}}_{{T}}$
wing taper ratio
- $ {{V}}_{{\infty }}$
freestream velocity magnitude
- $ z$
spanwise coordinate from mid-span, positive left
- $ {z}_{{\delta }_{r}}$
semispan position of the aileron closest to the wing root
- $ {z}_{{\delta }_{t}}$
semispan position of the aileron closest to the wing tip


Greek Symbols
- $ \alpha $
local geometric angle-of-attack relative to the freestream
- $ {{\alpha }}_{{L}{0}}$
local zero-lift angle-of-attack
- $ {\Gamma }$
local section circulation
- $ {\Delta }{{C}}_{{D}{i}}$
incremental change in induced-drag coefficient
- $ {{\delta }}_{{a}}$
aileron deflection angle in radians
- $ {{\varepsilon }}_{{f}}$
local aerofoil-section flap effectiveness
- $ {{\varepsilon }}_{{\Omega }}$
twist effectiveness
- $ \theta $
change of variables for the spanwise coordinate
- $ {{\kappa }}_{{D}}$
planform penalty factor in induced drag calculations
- $ {{\kappa }}_{{D}{L}}$
lift factor in induced drag calculations
- $ {{\kappa }}_{{D}{\ell}}$
rolling-moment factor in induced drag calculations
- $ {{\kappa }}_{{D}{\Omega }}$
twist factor in induced drag calculations
- $ {{\kappa}}_{n}$
yawing-moment factor in yawing-moment calculations
- $ \rho $
air density
- $ \chi $
spanwise antisymmetric twist distribution function
- $ \omega $
spanwise symmetric twist distribution function
- $ \Omega $
negative of the twist value at the location of max magnitude twist


Subscript
- $ {\left(\right)}_{\ell}$
due to rolling moment

1.0 INTRODUCTION
Discrete control surfaces are often used on a main wing for roll control and are commonly referred to as ailerons. The size and placement of ailerons is usually driven by aircraft performance, structure, and other system considerations, and vary with each airframe design(Reference Hoogervorst and Elham1–Reference Masefield4). With modern manufacturing and controls technology, morphing aircraft that can produce continuous trailing-edge deflections along the span of a wing have been studied in detail. For example, NASA has studied concepts such as the Variable-Camber Continuous Trailing Edge (VCCTE)(Reference Kaul and Nguyen5). Flexsys is developing a continuous trailing-edge flap(Reference Hetrick, Osborn, Kota, Flick and Paul6) on a Gulfstream aircraft. Additionally, Air Force Research Laboratory (AFRL) has developed and flight tested a Variable-Camber Continuous Wing (VCCW)(Reference Joo, Marks, Zientarski and Culler7–Reference Marks, Zientarski and Joo11). Performance benefits for minimising drag at various flight conditions are often reported as a main benefit of morphing-wing technology over conventional wing designs utilising discrete control surfaces(Reference Kaul and Nguyen5,Reference Phillips12–Reference Hunsaker, Phillips and Joo14) . Other benefits of continuous trailing-edge technology include reduced observability and increased control over roll-yaw coupling(Reference Montgomery, Hunsaker and Joo15,Reference Hunsaker, Montgomery and Joo16) .
In order to adequately assess the performance of the continuous trailing-edge technology, optimal solutions for discrete control surfaces must also be obtained. In the absence of such solutions, the optimal solutions of continuous trailing-edge technology can be erroneously compared to sub-optimal solutions of discrete trailing-edge solutions, and hence, produce incorrect comparisons and conclusions. The purpose of the present work is to obtain theoretical solutions for the optimal spanwise placement of discrete ailerons to minimise induced drag, and to compare the resulting induced drag to that which could theoretically be obtained from morphing aircraft. This is studied through the case of rolling-moment production while minimising induced drag. Here potential-flow theory is employed to obtain theoretical solutions, and the resulting induced drag, rolling moment, and adverse yaw of various designs is considered. The present study does not take into account transient conditions, but rather considers the rolling moment produced by a deflected aileron in steady-state flow with zero rolling rate. This would be similar to a wind tunnel experiment to measure the forces on a fixed wing with deflected ailerons in an attempt to measure roll authority.
A similar approach for aileron-placement optimisation was taken by Feifel(Reference Feifel17), who used a vortex-lattice algorithm to evaluate optimal aileron placement on an elliptic planform to minimise induced drag for a desired rolling moment at zero rolling rate. The present study employs a numerical lifting-line algorithm and evaluates wing planforms over a wide range of aspect ratios and taper ratios to encompass a larger design space. A theoretical basis for relations between aileron placement, induced drag, rolling moment, and yawing moment is also included based on Prandtl’s classical lifting-line theory(Reference Prandtl18). These theoretical relations provide invaluable insight into the correct correlation and assessment of the numerical results. The optimum results of the discrete aileron study are compared to theoretical optimum solutions that could be obtained from morphing-wing aircraft to shed insight on the drag benefits that might be obtained from morphing-wing technology.
1.1 Lifting-Line theory
The section-lift distribution and induced drag on a finite wing is expressed in a Fourier sine series in Prandtl’s classical lifting-line (LL) theory(Reference Prandtl18,Reference Prandtl19) . The classical LL solution for the circulation distribution can be expressed as
 \begin{align}
\Gamma (\theta)=2bV_{\infty }\sum^N_{j=1}{A_j{\sin (\,j\theta)\ }}\\[-17pt] \nonumber
\end{align}
where  $ b$ represents the span of the wing,
 $ {V}_{\infty }$ represents the freestream velocity, and
 $ \theta $ represents a change of variables in the spanwise direction,
 \begin{equation}\theta \equiv {{\cos }^{-1} \left(-2z/b\right)\ }\end{equation}
Combining Equation (1) with the Kutta-Joukowski law(Reference Kutta20,Reference Joukowski21) gives
 \begin{equation}\tilde{L}(\theta)=2\rho V^2_{\infty }b\sum^N_{j=1}{A_j{\sin (\,j\theta)\ }}\end{equation}
The Fourier coefficients in Equations (1) and (3) are related to the distributions of the chord-length and aerodynamic angle-of-attack. To obtain the Fourier coefficients  $ {A}_{j}$ in Equations (1) and (3), the LL equation must be satisfied at
 $ N$ locations along the wing. This results in a linear system that can be solved to yield the Fourier coefficients
 \begin{equation}\sum^N_{j=1}{A_j\left[\frac{4b}{{\tilde{C}}_{L,\alpha }c(\theta)}+\frac{j}{{\sin (\theta)\ }}\right]{\sin (\,j\theta)\ }}=\alpha (\theta)-{\alpha }_{L0}(\theta)\end{equation}
where  $ \alpha (\theta)$ is the geometric angle-of-attack as a function of spanwise location and
 $ {\alpha }_{L0}(\theta)$ is the aerodynamic angle-of-attack as a function of spanwise location. Once the Fourier coefficients have been obtained these can be used to evaluate the integrated forces and moments on the wing. In the absence of rolling rate, the resultant lift, induced drag, rolling moment, and yawing moment coefficients are
 \begin{equation}C_L=\pi R_A\,A_1\end{equation}
 \begin{equation}C_{Di}=\pi R_A\sum^N_{j=1}{jA^2_j}\end{equation}
 \begin{equation}C_{\ell }=-\frac{\pi R_A}{4}A_2\end{equation}
 \begin{equation}C_n=\frac{\pi R_A}{4}\sum^N_{j=2}{\left(2j-1\right)A_{j-1}A_j}\end{equation}
Equations (4)–(8) have the disadvantage of requiring recalculation for each change in operating condition, including angle-of-attack and control-surface deflection. A more useful form of the LL solution has been presented by Phillips(Reference Phillips22) and allows for operating conditions to be solved for independently. A similar approach is applied here with the definition
 \begin{equation}A_j=a_j{\left(\alpha -{\alpha }_{L0}\right)}_{\textrm{root}}-b_j\Omega +c_j{\delta }_a{\varepsilon }_f\end{equation}
where  $ {a}_{j}$,
 $ {b}_{j}$,
 $ {c}_{j}$ are decomposed Fourier coefficients related to planform, twist, and aileron design, respectively. Here twist is defined to be spanwise symmetric with scaling
 $-\Omega $. The roll control mechanism is defined to be spanwise symmetric in magnitude and opposite in sign, termed antisymmetric, with a magnitude of
 $ {\delta }_{a}$. The symbol
 $ {\varepsilon }_{f}$ is the aileron section flap effectiveness, which in this work is assumed to be constant across the span of the flap. The decomposed Fourier coefficients can be found by using the relations
 \begin{equation}\sum_{j=1}{a_j\left[\frac{4b}{{\tilde{C}}_{L,\alpha }c(\theta)}+\frac{j}{{\sin (\theta)\ }}\right]{\sin (\,j\theta)\ }=1}\end{equation}
 \begin{equation}\sum^N_{j=1}{b_j\left[\frac{4b}{{\tilde{C}}_{L,\alpha }c(\theta)}+\frac{j}{{\sin (\theta)\ }}\right]{\sin (\,j\theta)\ }}=\omega (\theta)\end{equation}
 \begin{equation}\sum^N_{j=1}{c_j\left[\frac{4b}{{\tilde{C}}_{L,\alpha }c(\theta)}+\frac{j}{{\sin (\theta)\ }}\right]}{\sin (\,j\theta)\ }=\chi (\theta)\end{equation}
where  $ \omega (\theta)$ is a symmetric twist distribution function, and
 $ \chi (\theta)$ is a spanwise antisymmetric twist distribution function, which can be represented as an indicator function
 \begin{equation}\chi (z)=\left\{ \begin{array}{c@{\quad}c}0, & z<-z_{{\delta }_t} \\[3pt]1, & -z_{{\delta }_t}\le z\le -z_{{\delta }_r} \\[3pt]0, & -z_{{\delta }_r}<z<z_{{\delta }_r} \\[3pt]-1, & z_{{\delta }_r}\le z\le z_{{\delta }_t} \\[3pt]0, & z>z_{{\delta }_t} \end{array}\right.\end{equation}
where  $ {z}_{{\delta }_{r}}$ is the spanwise position of the aileron closest to the wing root and
 $ {z}_{{\delta }_{t}}$ is the spanwise position of the aileron closest to the wing tip. The aileron root and tip are here defined as the spanwise edge position of the aileron closest to the wing root and tip, respectively.
The normalised twist distribution functions  $ \omega (\theta)$ and
 $ \chi (\theta)$ are multiplied by the corresponding magnitudes
 $ -\Omega $ and
 $ {\delta }_{a}{\varepsilon }_{f}$ to give the resultant total twist distribution along the wing. The total symmetric twist is
 $ -\Omega \omega (\theta)$, and the total antisymmetric twist is
 $ {\delta }_{a}{\varepsilon }_{f}\chi (\theta)$. For a given wing planform, symmetric twist distribution function, and antisymmetric control deflection distribution function, Equations (10)–(12) can be solved for the decomposed Fourier coefficients. These coefficients along with angle-of-attack, symmetric twist scaling, control deflection scaling, and section flap effectiveness can then be used in Equation (9) to compute the Fourier coefficients in Equations (5)–(8).
For a wing with symmetric planform and twist, the even terms of the  $ {a}_{j}$ and
 $ {b}_{j}$ coefficients are zero. For any wing with an antisymmetric control surface distribution, the odd terms of the
 $ {c}_{j}$ coefficients are zero. Equation (9) can then be expressed as
 \begin{equation}A_j=\left\{ \begin{array}{c@{\quad}c}a_j{\left(\alpha -{\alpha }_{L0}\right)}_{\textrm{root}}-b_j\Omega & \textrm{j}\ \textrm{odd} \\[3pt] c_j{\delta }_a{\varepsilon }_f & \textrm{j}\ \textrm{even} \end{array}\ \right.\ \end{equation}
Using Equation (14) in Equations (5)–(8) gives
 \begin{equation}C_L=\pi R_Aa_1{\left(\alpha -{\alpha }_{L0}\right)}_{\textrm{root}}-\pi R_Ab_1\Omega\end{equation}
 \begin{equation}C_{Di}=\pi R_A{\left(\sum^N_{j=1}{j{\left[a_j\left(\alpha -{\alpha }_{L0}\right)-b_j\Omega \right]}^2}\right)}_{\textrm{j\ odd}}+{\pi R_A{\left({\delta }_a{\varepsilon }_f\right)}^2\left(\sum^N_{j=2}{j{c_j}^2}\right)}_{\textrm{j\ even}}\end{equation}
 \begin{equation}C_{\ell }=-\frac{\pi R_A}{4}\left(c_2{\delta }_a{\varepsilon }_f\right)\end{equation}
 \begin{align}C_n&=\frac{\pi R_A{\delta }_a{\varepsilon }_f}{4}\left({\left(\sum^N_{j=2}{\left(2j-1\right)\left(a_{j-1}{\left(\alpha -{\alpha }_{L0}\right)}_{\textrm{root}}-b_{j-1}\Omega \right)\left(c_j\right)}\right)}_{\textrm{j\ even}}\right.\nonumber\\
&\quad\quad\qquad\qquad\,\left. +{\left(\sum^N_{j=3}{\left(2j-1\right)\left(c_{j-1}\right)\left(a_j{\left(\alpha -{\alpha }_{L0}\right)}_{\textrm{root}}-b_j\Omega \right)}\right)}_{\textrm{j\ odd}}\right)\end{align}
In the absence of aileron deflection, the induced drag simplifies to
 \begin{equation}C_{D0}=\pi R_A{\left(\sum^N_{j=1}{j{\left[a_j\left(\alpha -{\alpha }_{L0}\right)-b_j\Omega \right]}^2}\right)}_{\textrm{j\ odd}}\end{equation}
and can be rearranged in the form(Reference Phillips23)
 \begin{equation}C_{D0}=\frac{C^2_L\left(1+{\kappa }_D\right)-{\kappa }_{DL}C_LC_{L,\alpha }\Omega +{\kappa }_{D\Omega }{\left(C_{L,\alpha }\Omega \right)}^2}{\pi R_A}\end{equation}
where
 \begin{equation}C_L=C_{L,\alpha }\left[{\left(\alpha -{\alpha }_{L0}\right)}_{\textrm{root}}-{\varepsilon }_{\Omega }\Omega \right]\end{equation}
 \begin{equation}C_{L,\alpha }=\pi R_Aa_1=\frac{{\tilde{C}}_{L,\alpha }}{\left[1+{\tilde{C}}_{L,\alpha }/(\pi R_A)\right]\left(1+{\kappa }_L\right)}\end{equation}
 \begin{equation}{\kappa }_L\equiv \frac{1-\left(1+\pi R_A/{\tilde{C}}_{L,\alpha }\right)a_1}{\left(1+\pi R_A/{\tilde{C}}_{L,\alpha }\right)a_1}\end{equation}
 \begin{equation}{\varepsilon }_{\Omega }\equiv \frac{b_1}{a_1}\end{equation}
 \begin{equation}{\kappa }_D\equiv \sum^N_{j=2}{j\frac{a^2_j}{a^2_1}}\end{equation}
 \begin{equation}{\kappa }_{DL}\equiv 2\frac{b_1}{a_1}\sum^N_{j=2}{j\frac{a_j}{a_1}\left(\frac{b_j}{b_1}-\frac{a_j}{a_1}\right)}\end{equation}
 \begin{equation}{\kappa }_{D\Omega }\equiv {\left(\frac{b_1}{a_1}\right)}^2\sum^N_{j=2}{j{\left(\frac{b_j}{b_1}-\frac{a_j}{a_1}\right)}^2}\end{equation}
Because  $ {a}_{n}$ depends on planform as shown in Equation (10) and
 $ {b}_{n}$ depends on wing twist as shown in Equation (11),
 $ {\kappa }_{L}$,
 $ {\varepsilon }_{\Omega }$,
 $ {\kappa }_{D}$,
 $ {\kappa }_{DL}$, and
 $ {\kappa }_{D\Omega }$ depend on planform and twist. Example solutions have been shown by Phillips(Reference Phillips23). From these relationships, valuable conclusions can be drawn about optimum taper ratio and symmetric twist design. For example, in the absence of twist, Equation (20) simplifies to
 \begin{equation}C_{D0}=\frac{C^2_L}{\pi R_A}\left(1+{\kappa }_D\right)\end{equation}
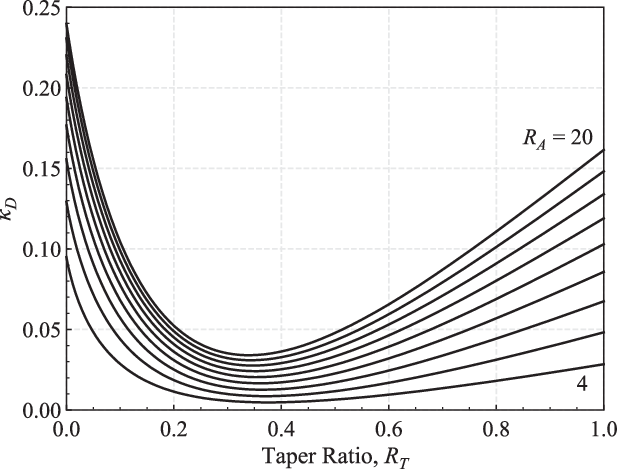
The term  $ {\kappa }_{D}$ represents the wing planform penalty factor in induced drag relative to an untwisted elliptic wing. The wing planform penalty factor can be computed for any planform from Equations (25) and (28). Glauert(Reference Glauert24) was the first to visualise
 $ {\kappa }_{D}$, and more recently, Phillips(Reference Phillips23) produced a similar figure as a function of taper ratio and aspect ratio. Results from the LL development are shown in Fig. 1. The common rule-of-thumb that induced drag is minimised with a taper ratio near 0.4 comes from these types of computations(Reference Glauert24).
Induced drag planform penalty factor for untwisted linearly tapered wings.

These types of design-space explorations are useful for providing intuition in the early stages of aircraft design. Here, a similar approach is used to examine the effect of aileron placement on induced drag. In order to evaluate the effect of discrete ailerons on induced drag and how results might compare to the theoretical induced drag of a morphing aircraft, it is helpful to understand two optimal twist distributions.
1.2 Optimum twist distributions
Phillips et al.(Reference Phillips, Alley and Goodrich25,Reference Phillips and Hunsaker26) showed a normalised spanwise twist distribution function that minimises induced drag for any symmetric wing planform in steady level flight. This can be written as
 \begin{equation}\omega (\theta)=1-\frac{{\textrm{sin} \textrm{(}\theta \textrm{)}\ }}{c(\theta)\textrm{/}c_{\textrm{root}}}\end{equation}
with the required symmetric twist scaling based on the lift coefficient
 \begin{equation}\Omega =\frac{\textrm{4}bC_L}{\pi R_A{\tilde{C}}_{L,\alpha }c_{\textrm{root}}}\end{equation}
and the required angle-of-attack is
 \begin{equation}{\left(\alpha -\alpha_{L0}\right)}_{\textrm{root}}=\frac{C_L}{\pi R_A}\left(\frac{\textrm{4}b}{{\tilde{C}}_{L,\alpha }c_{\textrm{root}}}+1\right)\end{equation}
Any wing employing this twist distribution at the angle-of-attack given in Equation (31) will produce an elliptic lift distribution and result in an induced drag of
 \begin{equation}C_{Di}=\frac{C^2_L}{\pi R_A}\end{equation}
By comparing Equation (32) to Equation (28) and in light of the induced-drag factor  $ {\kappa }_{D}$ shown in Fig. 1, we see that a morphing wing that has the ability to actively employ symmetric twist according to Equations (29) and (30) will produce the same induced drag as an elliptic wing, and therefore result in
 $ {\kappa }_{D}=0$. Therefore, Fig. 1 can be seen as the induced-drag penalty for not using a morphing wing in steady flight.
Similarly, a Lifting-line (LL) analysis by Hunsaker et al.(Reference Hunsaker, Montgomery and Joo27) produced an antisymmetric twist distribution function that minimises induced drag for any symmetric wing planform and prescribed rolling moment with zero rolling rate. This can be written as
 \begin{equation}\chi (\theta)=\left[1+\frac{2b{\textrm{sin} (\theta)\ }}{{\tilde{C}}_{L,\alpha }c(\theta)}\right]{\textrm{cos} (\theta)\ }\end{equation}
This twist distribution provides the optimum continuous twist in the wing to produce a given rolling moment and minimise induced drag in the absence of rolling rate. In this study, it is assumed that a morphing wing would be capable of employing the optimum twist distributions given in Equations (29) and (33) at any phase of flight. For any wing geometry employing the optimal antisymmetric twist distribution in Equation (33), the increase in induced drag due to rolling moment is
 \begin{equation}{\left(\Delta C_{Di}\right)}_{\ell }=32\frac{C^{\textrm{2}}_{\ell }}{\pi R_A}\end{equation}
Equation (34) gives the minimum increase in drag for any rolling moment, and that which is theoretically obtainable by a morphing aircraft. As will be shown, even optimum design of discrete ailerons can produce significantly more induced drag than that shown in Equation (34) for a prescribed rolling moment. Using the antisymmetric twist distribution function given by Equation (33) in Equation (18) and substituting Equation (17) gives the resulting yawing moment that would result from the twist distribution given in Equation (33)
 \begin{equation}C_n=-\frac{\textrm{3}C_LC_{\ell }}{\pi R_A}-5C_{\ell }\left(a_{\textrm{3}}{\left(\alpha -{\alpha }_{L0}\right)}_{\textrm{root}}-b_{\textrm{3}}\Omega \right)\end{equation}
With this LL formulation, the effect of discrete ailerons on induced drag can now be considered.
2.0 LIFTING-LINE ANALYSIS OF ROLLING-MOMENT PRODUCTION AT ZERO ROLLING RATE
Classical LL theory uses a Fourier sine series to represent the lift distribution along a wing as shown in Equation (3). Including more Fourier coefficients increases the number of frequencies considered in the analysis as well as the rank of the linear system of equations that must be solved. An aileron deflection represents a step change in twist distribution along the wing, and therefore introduces high-frequency content into the lift distribution. Because solutions to this system of equations were obtained by hand in the early days of aeronautics, they were limited in the number of Fourier coefficients that could be included. Hence, it was difficult to use this method to accurately evaluate the effect of ailerons on induced drag before the advent of the computer. Today, however, it is quite simple to solve large systems of equations with very little effort, so many more Fourier coefficients can be included. Hence, this method can be used to rapidly evaluate the effect of ailerons on induced drag and find the associated yawing moment.
The change in induced drag due to aileron deflection can be obtained by subtracting Equation (19) from Equation (16). This gives
 \begin{equation}C_{Di}-C_{D0}={\pi R_A{\left({\delta }_a{\varepsilon }_f\right)}^2\left(\sum^N_{j=2}{j{c_j}^2}\right)}_{\textrm{j\ even}}\end{equation}
Using Equation (17) in Equation (36) to eliminate the aileron deflection magnitude  $ {\delta }_{a}$ gives the change in induced drag due to rolling moment
 \begin{equation}{\left(\Delta C_{Di}\right)}_{\ell }\equiv C_{Di}-C_{D0}=\frac{32C^2_{\ell }\left(1+{\kappa }_{D\ell }\right)}{\pi R_A}\end{equation}
where
 \begin{equation}{\kappa }_{D\ell }\equiv \frac{1}{2}{\left(\sum^N_{j=4}{j{\left(\frac{c_j}{c_2}\right)}^2}\right)}_{\textrm{j\ even}}\end{equation}
From Equation (37), it is shown that the increase in induced drag due to rolling moment is a function of the aspect ratio, rolling moment, and  $ {\kappa }_{D{\ell}}$. The decomposed Fourier coefficients
 $ {c}_{j}$ depend on planform as shown in Equation (12), as well as the spanwise aileron edge positions as shown in Equation (13). Hence, the value for
 $ {\kappa }_{D{\ell}}$ is a function of planform, aileron position, and aileron spanwise length. Note however that this analysis predicts that the increase in induced drag given in Equation (37) is independent of section flap effectiveness
 $ {\varepsilon }_{f}$, lift, and symmetric twist. It is also interesting to note that for this case, the increase in induced drag is directly proportional to the square of the rolling moment, much in the same way that the induced drag in the absence of twist and aileron deflection is proportional to the square of the lift coefficient, as shown in Equation (28). The induced drag of an untwisted wing of any planform with aileron deflection can be given as
 \begin{equation}C_{Di}=\frac{C^{\textrm{2}}_L(1+{\kappa }_D)+32C^{\textrm{2}}_{\ell }(1+{\kappa }_{D\ell })}{\pi R_A}\end{equation}
If the symmetric twist distribution function given in Equations (29) and (30) is used,  $ {\kappa }_{D}$ is zero. If the optimal antisymmetric twist distribution function given in Equation (33) is used,
 $ {\kappa }_{D{\ell}}$ is zero. If both of these optimum twist distribution functions are used simultaneously, the minimum induced drag for a given lift and rolling moment is
 \begin{equation}C_{Di}=\frac{C^{\textrm{2}}_L+32C^{\textrm{2}}_{\ell }}{\pi R_A}\end{equation}
As a first step to understand optimal aileron design, only wings without twist will be considered, making  $ \Omega $ zero. This is similar to the approach Glauert(Reference Glauert24) and Phillips(Reference Phillips23) employed, since they neglected twist in their initial studies of the effects of wing planform on induced drag. In the absence of twist, Equations (15) and (18) reduce to
 \begin{equation}C_L=\pi R_A\left[a_1{\left(\alpha -{\alpha }_{L0}\right)}_{\textrm{root}}\right]\end{equation}
 \begin{align}C_n&=\frac{\pi R_A{\delta }_a{\varepsilon }_f}{4}\left({\left(\sum^N_{j=2}{\left(2j-1\right)\left(a_{j-1}{\left(\alpha -{\alpha }_{L0}\right)}_{\textrm{root}}\right)\left(c_j\right)}\ \right)}_{\textrm{j\ even}}\right.\nonumber\\
&\quad \left.+{\left(\sum^N_{j=3}{\left(2j-1\right)\left(c_{j-1}\right)\left(a_j{\left(\alpha -{\alpha }_{L0}\right)}_{\textrm{root}}\right)}\right)}_{\textrm{j\ odd}}\right)\end{align}
Substituting Equation (41) in Equation (42) gives:
 \begin{equation}C_n=\frac{C_L{\delta }_a{\varepsilon }_f}{4}\left({\left(\sum^N_{j=2}{\left(2j-1\right)\left(\frac{a_{j-1}}{a_1}\right)\left(c_j\right)}\right)}_{\textrm{j\ even}}+{\left(\sum^N_{j=3}{\left(2j-1\right)\left(c_{j-1}\right)\left(\frac{a_j}{a_1}\right)}\right)}_{\textrm{j\ odd}}\right)\end{equation}
Equation (17) can be rearranged and used in Equation (43) to eliminate the aileron deflection magnitude  $ {\delta }_{a}:$
 \begin{equation}C_n=-\frac{C_LC_{\ell }}{\pi R_A}\left({\left(\sum^N_{j=2}{\left(2j-1\right)\left(\frac{a_{j-1}}{a_1}\right)\left(\frac{c_j}{c_2}\right)}\right)}_{\textrm{j\ even}}+{\left(\sum^N_{j=3}{\left(2j-1\right)\left(\frac{c_{j-1}}{c_2}\right)\left(\frac{a_j}{a_1}\right)}\right)}_{\textrm{j\ odd}}\right)\end{equation}
This can be rearranged to give
 \begin{equation}C_n=-\frac{C_LC_{\ell }{\kappa }_n}{\pi R_A}\end{equation}
where
 \begin{equation}{\kappa }_n=3+{\left(\sum^N_{j=3}{\left(2j-1\right)\left(\frac{c_{j-1}}{c_2}\right)\left(\frac{a_j}{a_1}\right)}\right)}_{\textrm{j\ odd}}+{\left(\sum^N_{j=4}{\left(2j-1\right)\left(\frac{a_{j-1}}{a_1}\right)\left(\frac{c_j}{c_2}\right)}\right)}_{\textrm{j\ even}}\end{equation}
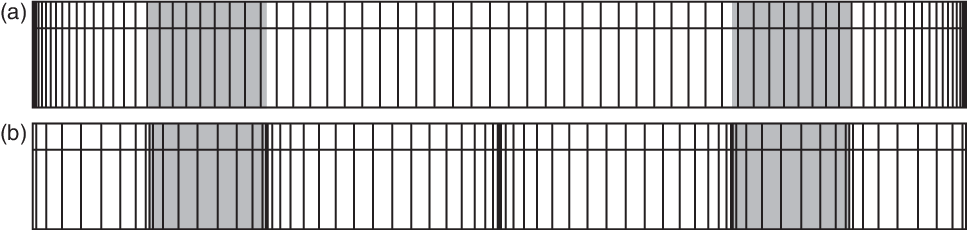
In the classical LL theory, traditionally nodes are clustered along the wing using Equation (2) with cosine-clustering near the wing tips by evenly spacing the nodes in  $ \theta $. However, this method of clustering does not consider how the node clustering will fall relative to the placement of the aileron. Figure 2(a) provides a visualisation of the traditional cosine-clustering using the classical LL theory with 80 nodes and symmetrically placed ailerons. Note that the edge of the aileron may be in a position between two nodes or directly on a node. As the number of nodes used in the calculation increases, the accuracy of the induced drag and yawing moment solutions will vary as the cosine-clustered nodes change position relative to the location of the edge of the aileron. As a comparison, the clustering used in Fig. 2(b), termed aileron-sensitive clustering, allows greater control over the placement of nodes relative to the aileron position, so that the edge of an aileron falls directly on a node regardless of its span or spanwise location. However, there are numerical difficulties that arise when this type of clustering is used with the classical LL theory. To understand the numerical inconsistencies in the classical LL theory when applying clustering near the ailerons, an alternative numerical LL method is highlighted for this work.
Rectangular planforms with varying methods of spanwise node placement with a lifting-line along the quarter-chord.

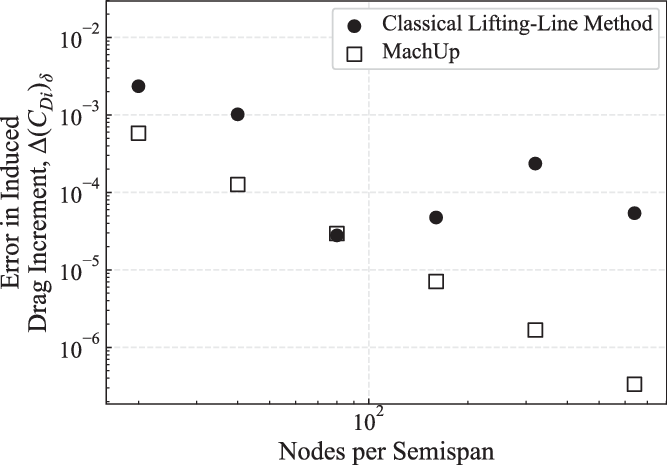
The numerical LL algorithm published by Phillips and Snyder(Reference Phillips and Snyder28), which is a close numerical analog to the classical LL theory, can effectively use aileron-sensitive clustering. This algorithm is used in MachUp(Reference Hunsaker, Phillips and Joo14,Reference Hodson, Hunsaker and Spall29) , an open-source code available on GitHubFootnote 1. As an example, Fig. 3 shows the error in induced-drag increment calculations from MachUp and the classical LL method with traditional cosine-clustering as a function of nodes per semispan. Error is calculated as the difference in induced-drag increment between a given number of nodes per semispan and a significantly greater number of nodes per semispan, in this case 1,280 nodes, using the same method. Note that the classical LL method does not consistently decrease in error as the number of nodes is increased.
Induced-drag increment error between two lifting-line methods as a function of nodes per semispan.

From studies performed by the authors, it appears that the numerical LL algorithm of Phillips and Snyder will grid-converge independent of the clustering algorithm used, as long as the nodes are spaced such that vortex nodes lie at the edges of the aileron. This is because the numerical LL algorithm treats each horseshoe vortex somewhat independently, regardless of the location or size of the vortex. In that sense, a wing is simply a collection of vortices. Conversely, the classical LL algorithm computes a lift distribution based on a Fourier sine series that is directly related to the vortex spacing. Therefore, only certain types of spacing can be used with the classical LL algorithm. Cosine-clustering is used traditionally, which works well considering the change of variables in  $ \theta $. This spacing does not, however, work well for accurately capturing the edges of an aileron. Therefore, the authors’ best assumption as to why the classical lifting-line algorithm does not converge well with a deflected aileron is that there is an unfavorable spacing of nodes relative to the aileron edges with that algorithm, and the relative position of the nearest nodes to the aileron edges change as the number of nodes is increased. Again, this cannot be controlled with the classical LL algorithm, and the grid convergence is poor and inconsistent. Combined with Fig. 3, this motivates the use of the numerical LL algorithm for exploring the design space of aileron sizing and placement.
The use of the numerical LL algorithm has one drawback. This is that results for the decomposed Fourier coefficients are not readily obtained from this algorithm. Rather, this algorithm provides solutions for distributed forces and moments as well as integrated forces and moments on the complete wing. Therefore, rather than computing the resulting  $ {\kappa }_{D{\ell}}$ and
 $ {\kappa }_{n}$ directly from the decomposed Fourier coefficients for a given planform and aileron geometry, these were estimated from the integrated forces and moments resulting from the numerical LL algorithm. Rearranging Equations (28), (37), and (45) gives
 \begin{equation}{\kappa }_D=\frac{C_{D0}\pi R_A}{C^2_L}-1\end{equation}
 \begin{equation}{\kappa }_{D\ell }=\frac{{\left(\Delta C_{Di}\right)}_{\ell }\left(\pi R_A\right)}{32C^2_{\ell }}-1\end{equation}
 \begin{equation}{\kappa }_n=-\frac{\pi C_nR_A}{C_LC_{\ell }}\end{equation}
Results for the integrated induced-drag increment and yawing moment were used in Equations (47)–(49) to estimate the resulting  $ {\kappa }_{D}$,
 $ {\kappa }_{D{\ell}}$, and
 $ {\kappa }_{n}$ for a given planform and aileron geometry.
3.0 APPLICATION OF THE NUMERICAL LIFTING-LINE METHOD AND OPTIMISATION
The numerical LL method given by Phillips and Snyder(Reference Phillips and Snyder28) differs from the vortex lattice method that Feifel(Reference Feifel17) provided. Whereas the vortex lattice method employs a surface flow boundary condition at the three-quarter-chord(Reference Katz and Plotkin30) to solve for the vortex strengths, the numerical LL algorithm finds the local circulation at each wing section with a relationship between the three-dimensional vortex lifting law(Reference Saffman31) and the section aerofoil lift. The numerical LL algorithm depends on a system of lifting surfaces connected by discrete horseshoe vortices, creating a vorticity field. This method can be applied to multiple lifting surfaces with sweep and dihedral and gives accurate solutions for wings with aspect ratios greater than about 4(Reference Phillips and Snyder28).
3.1 Case setup
Each wing semispan is specified in three wing sections, with the center section containing the aileron, and each wing section is cosine-clustered with a number of nodes proportional to section span, as shown in Fig. 2(b). The control surfaces are modeled using a flap-chord fraction of 1.0 along the entire length of the control surface. As Feifel(Reference Feifel17) notes, the induced-drag increment predicted by these potential-flow algorithms is independent of the aileron flap-chord fraction and depends only on the prescribed rolling moment. This is shown analytically in Equation (37) and further explained by Phillips(Reference Phillips23) and Abbott and Doenhoff(Reference Abbott and Doenhoff32).
The angle-of-attack and aileron deflection were iteratively changed to provide the prescribed lift coefficient and rolling-moment coefficient for a given wing planform and aileron design. Convergence criteria of 1.0  $ \times $ 10−12 and 1.0
 $ \times $ 10−16 were used for the lift coefficient and rolling-moment coefficient, respectively. For each case, Newton’s method was used as outlined by Phillips(Reference Phillips23) for solving the nonlinear system of equations of the numerical LL algorithm with a convergence criterion of 1.0
 $ \times $ 10−12. An aerofoil section lift slope of
 $ 2{\pi }$ and a zero-lift angle-of-attack of 0 were used for the computations shown here.
3.2 Grid convergence and optimisation
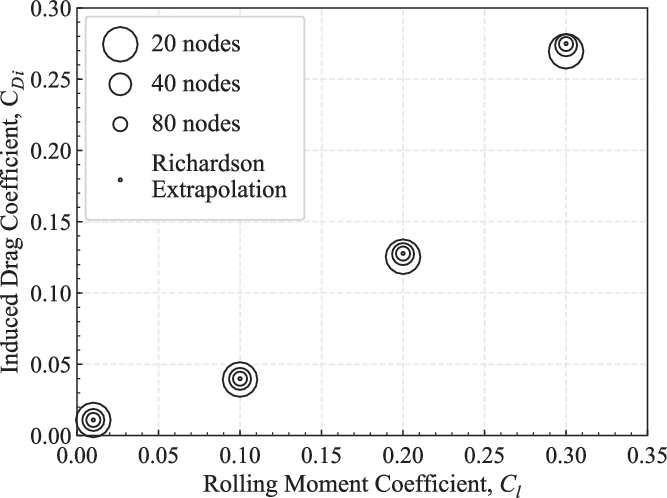
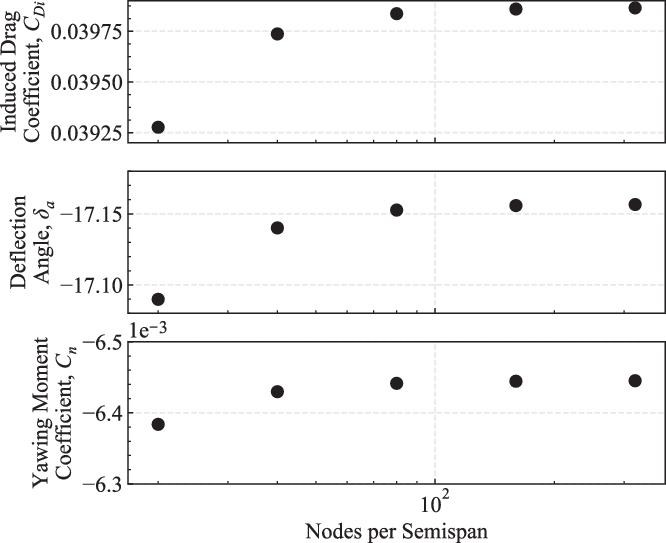
Multiple grid densities were studied to ensure fully grid-converged values from the numerical LL algorithm. Figure 4 shows results for induced drag as a function of grid density for a few example values of rolling-moment coefficient. Figure 5 shows the induced drag coefficient, deflection angle, and yawing-moment coefficient predicted by the numerical LL algorithm as a function of grid density for a given rolling-moment coefficient of 0.1. These results suggest that grid-resolved values are obtained with about 80 nodes per semispan. A grid density of 100 nodes per semispan is used in the following analysis to ensure grid-converged solutions.
Grid-convergence analysis of induced-drag coefficient at various prescribed rolling-moment coefficients.

Results for induced drag, deflection magnitude, and yawing moment as a function of grid density.

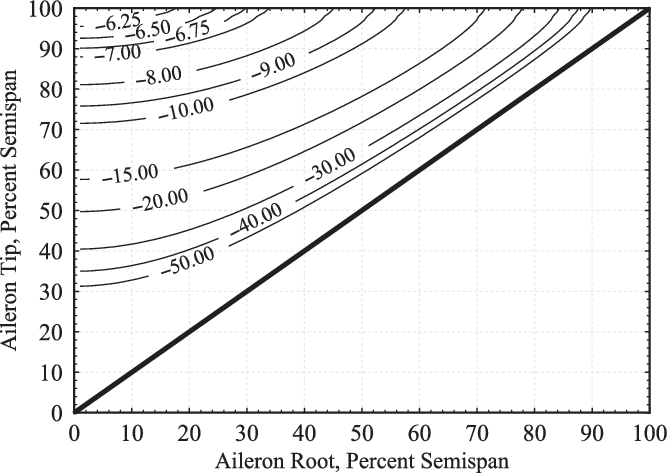
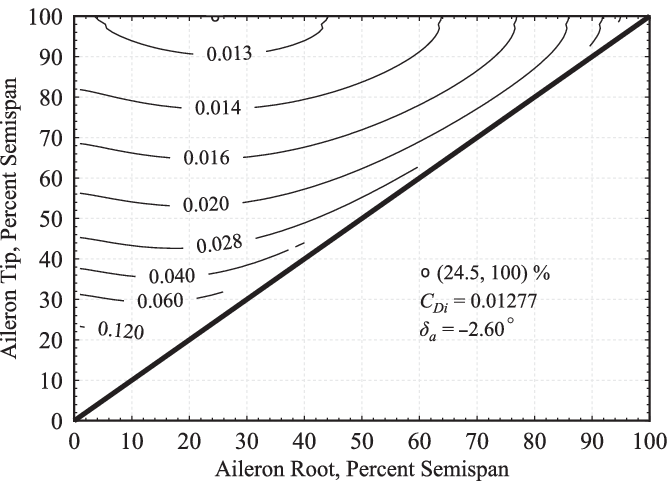
For a prescribed rolling moment, the required aileron deflection magnitude depends on the size and position of the aileron. The larger the spanwise length of the aileron, the less deflection is required. Additionally, the further the aileron is from the centerline, the larger the moment arm and the less deflection is required. Figure 6 shows an example of the required aileron deflection magnitude as a function of aileron size and location on a rectangular wing with an aspect ratio of 8, lift coefficient of 0.5, and a prescribed rolling-moment coefficient of 0.1. The coordinates on this plot (x, y) represent the beginning spanwise location (x) and the ending spanwise location (y) of the aileron. The diagonal line defines the limiting case of an infinitely small aileron at any location along the semispan. Because the computations are inviscid and do not include the effects of stall, results for very large aileron deflections up to 60o are included in the domain. Even though results for these large deflections are not accurate due to stall, the inviscid results provide insight into the aileron design space. Note that the aileron deflection is minimised at the point (0, 100) within the plot. This defines an aileron that extends from the root of the wing to the tip.
Example contour plot of deflection angle (deg) as a function of aileron size and location for a rectangular wing with  $ {\textit{R}}_{\textit{A}}=\text{8},\mathit{}{\textit{C}}_{\textit{L}}=\text{0.5}$, and
 $ \mathit{}{\textit{C}}_{\ell}=\text{0.1}.$

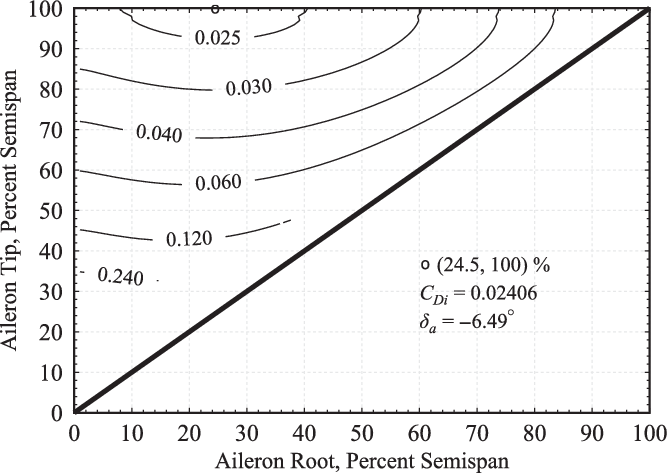
Contour plot of induced drag coefficient for a rectangular wing with  $ {\textit{R}}_{\textit{A}}=\text{8},\mathit{}{\textit{C}}_{\textit{L}}=\text{0.5}$, and
 $ \mathit{}{\textit{C}}_{\ell}=\text{0.1}.$

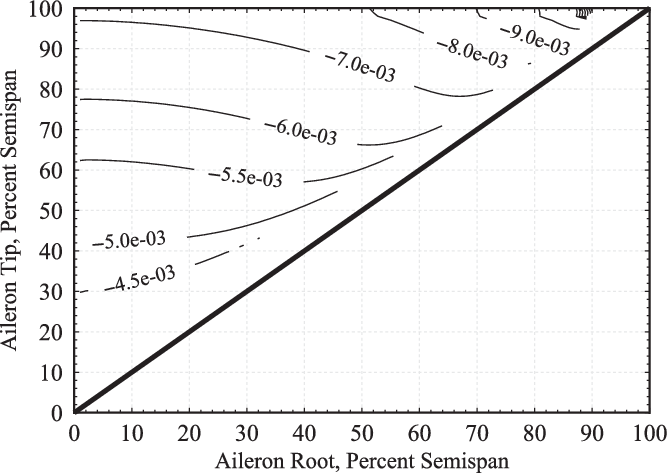
The corresponding induced-drag and yawing-moment coefficients are shown in Figs. 7 and 8 for the same wing planform at the same operating conditions. Notice that whereas the required deflection is minimised at the point (0, 100), the induced drag is minimised near the point (24.5, 100). This represents an aileron that begins at the spanwise location of 24.5% and extends to the wing tip. From Fig. 6 we see that the aileron with the smallest deflection is that which extends along the entire length of the wing. In this example case, that deflection is less than 6.25°. However, that design does not minimise induced drag for the prescribed rolling moment. Because the rolling moment is related to the moment arm of the lift distribution, an increase in lift on the wing outer section will produce more rolling moment than an increase in lift on the wing inner section. Figure 7 shows that minimum induced drag is created for the prescribed rolling moment by only deflecting the wing outboard of the 24.5% span location. This requires slightly more deflection than the minimum-deflection solution, but it produces less induced drag. Any other aileron design will produce more induced drag for the prescribed rolling moment.
Contour plot of yawing-moment coefficient for a rectangular wing with  $ {\textit{R}}_{\textit{A}}=\text{8},\mathit{}{\textit{C}}_{\textit{L}}=\text{0.5}$, and
 $ \mathit{}{\textit{C}}_{\ell}=\text{0.1.}$

From Fig. 8 we see that the yawing-moment coefficient decreases in the limit as the aileron definition approaches (0, 0). Because stall is not considered, the yawing moment is minimised by employing an infinitely small aileron near the root of the wing and applying a large deflection. This result for the minimum yawing moment is of course not practical. However, the contours of the design space for aileron deflection, induced drag, and yawing moment shed insight on the design problem and relative locations for optimum solutions.
Given Fig. 7, it is evident that the induced drag near the minimum induced-drag solution is relatively insensitive to small changes in aileron design. For example, the optimum solution produces an induced drag coefficient of 0.02406 with an aileron extending from a root location of 24.5% semispan to the tip, defined by (24.5, 100). The root location of the aileron can be varied from about 10% to 40% with an increase in induced drag of less than 4%. This shallow gradient in the induced drag is even more pronounced at lower prescribed rolling moments. For example, Fig. 9 shows the induced drag for a wing of the same geometry and lift coefficient, but with a prescribed rolling moment of 0.04. Notice from this figure that the minimum solution occurs at the same point, but that the gradient is significantly decreased. In this case, the root location can be varied from 10% to 40% with an increase in induced drag of less than 2% over the optimum.
Contour plot of induced drag coefficient for a rectangular wing with  $ {\textit{R}}_{\textit{A}}=\text{8},\textit{}{\textit{C}}_{\textit{L}}=\text{0.5}$, and
 $ \textit{}{\textit{C}}_{\ell}=\text{0.04}.$

The spanwise size and location of ailerons that produce minimum induced drag were found for a large set of wing planforms. The optimum location for each planform was obtained using a gradient-based optimisation algorithm by Hodson et al.(Reference Hodson, Hunsaker and Spall29), available on GitHubFootnote 2. The algorithm uses the Broyden(Reference Broyden33), Fletcher(Reference Fletcher34), Goldfarb(Reference Goldfarb35), and Shanno(Reference Shanno36) (BFGS) method to iteratively find a minimum. For the aileron root and tip definition, the optimisation algorithm used decimal numbers out to machine precision at double-precision computing. With a grid density of 100 nodes and small changes to the span of the aileron section, the number of nodes assigned to the aileron would change, which produced small step changes in the solution. To counter this issue, the optimisation algorithm used two loops. The inner loop could change the size and location of the aileron but could not change the number of nodes used in each wing section (i.e., the number of nodes used to define the aileron geometry). Once the inner loop converged, the outer loop would redistribute the nodes such that the number of nodes assigned to each section of the wing would be proportional to the span of the section. Once the outer-loop distribution of nodes stopped changing, the solution was accepted as fully converged.
Notice from Figs. 7 and 9 that the minimum-induced drag solutions have the aileron tip at the wing tip, as shown by the marker at the top of the plots. Similar solutions were found independent of prescribed rolling moment and lift. Because of node spacing in this study, gradient-based optimisation techniques have difficulty finding the minimum when it is near a boundary. As the tip of the aileron approaches the wing tip, the number of nodes allocated for the outer wing region goes to zero. Since the number of nodes must always be an integer, step changes in the design space appear as the outer wing region becomes small. In our grid-convergence studies the minimum consistently neared the wing tip as more nodes were added to the full wing. Therefore, (1) because the accuracy of lifting-line theory is limited, and (2) because grid-convergence results showed that, for all cases studied, the optimum solution approached the wing tip, and (3) to mitigate the numerical challenges associated with grid spacing of very small outer wings; the tip of the aileron was constrained to coincide with the wing tip, and zero area was allotted for the outer wing region. In other words, only the aileron root location was allowed to vary to minimise induced drag.
4.0 RESULTS
From Equation (37), it is evident that the increase in induced drag due to rolling moment is a function of  $ {\kappa }_{D{\ell}}$. From Equation (45), it is evident that in the absence of symmetric twist, the resulting yawing moment depends on
 $ {\kappa }_{n}$. Both
 $ {\kappa }_{D{\ell}}$ and
 $ {\kappa }_{n}$ depend on the wing planform as well as the spanwise location and spanwise length of the aileron through their dependence on the decomposed Fourier coefficients,
 $ {c}_{j}$, as can be seen from Equations (12), (38), and (46). Due to the grid-clustering limitations inherent in the classical LL theory as explained previously, the numerical LL algorithm along with a gradient-based optimisation algorithm discussed above were used to obtain the aileron geometry that minimised induced drag for a prescribed rolling moment and lift over a range of wing planform geometries.
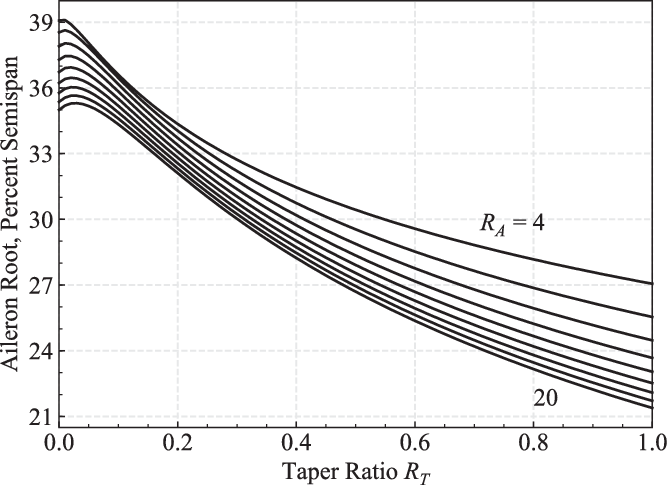
Cases were run with aspect ratio varied from 4 to 20 in increments of 2, and taper ratio varied from 0.0 to 1.0 in increments of 0.01. Values for the aileron root that minimise induced drag for various planforms are shown in Fig. 10 as a function of aspect ratio and taper ratio. As aspect ratio and taper ratio increase, the aileron root must move closer to the root of the wing to achieve the minimum induced drag for the wing. Feifel(Reference Feifel17) reported that the “optimum size of conventional single-segment ailerons is in the order of 70% wing semispan” to minimise induced drag for elliptical wings. Figure 1 shows that the tapered wing planform with a taper ratio of about 0.4 behaves most closely to the elliptic planform. The aileron root values at  $ {R}_{T}=0.4$ agree closely with what Feifel(Reference Feifel17) reported.
Aileron root positions that result in minimum induced drag.

For each of the optimum aileron solutions shown in Fig. 10, the numerical LL algorithm was used to find the resulting forces and moments. The planform penalty factor  $ {\kappa }_{D}$ can be calculated directly from Equation (25) or indirectly from Equation (47) using results from the numerical LL algorithm. These methods produced results that differed by less than 0.33% over the range of wing geometries considered. Once
 $ {\kappa }_{D}$ had been obtained,
 $ {\kappa }_{D{\ell}}$ was found using Equation (39), and
 $ {\kappa }_{n}$ was found using Equation (49). A representative data set was tested for this range of wing planforms with varying lift and rolling moment. Results from the optimisation algorithm showed that each
 $ \kappa $ coefficient for a given aspect ratio and taper ratio could be averaged with less than a 1% difference. This is not too surprising given that LL theory predicts
 $ {\kappa }_{D}$,
 $ {\kappa }_{D{\ell}}$, and
 $ {\kappa }_{n}$ for a wing without twist to be independent of prescribed lift and rolling moment as shown in Equations (25), (38), and (46), respectively.
Results for  $ {\kappa }_{D}$ are shown in Fig. 1 and can be interpreted as a percent increase in drag due to planform relative to an elliptic wing (or a morphing wing that can actively change twist) with the same aspect ratio. Results for
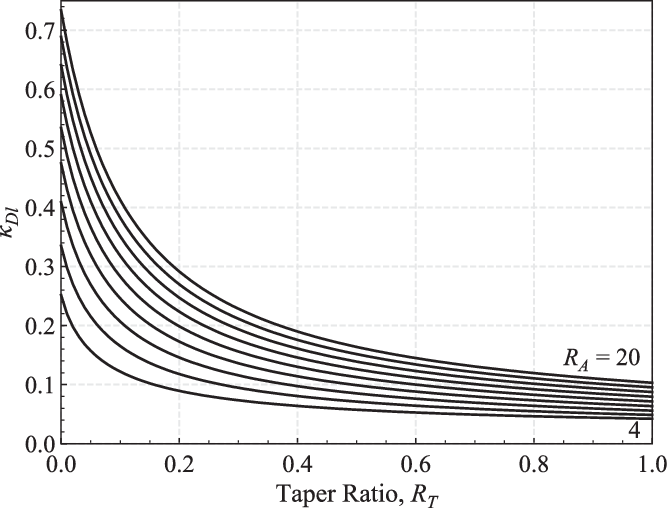
 $ {\kappa }_{D{\ell}}$ are shown in Fig. 11 and can be used in Equation (37) to find the increase in induced drag due to rolling moment relative to that which would result from the optimum twist distribution function given in Equation (33). These results can be used in Equation (37). Since a variable-continuous trailing-edge wing could be designed to produce the twist distribution function given in Equation (33), and because a wing using the twist distribution given in Equation (33) would result in
 $ {\kappa }_{D{\ell}}=0$, solutions shown in Fig. 11 can be viewed as a percent increase in induced drag due to rolling moment of a discrete aileron design over a morphing-wing design, and shed some light on the benefits of morphing technology, including VCCTE and VCCW applications. For example, a discrete aileron designed to minimise induced drag on a wing with an aspect ratio of 8 and a taper ratio of 0.4 would produce a change in induced drag due to rolling moment
 $ {\left({\Delta }{C}_{Di}\right)}_{\ell}$ of about 10% over that which would be produced by a morphing wing capable of producing the twist distribution given in Equation (33). For taper ratios of 0.4 to 1.0 for the aspect ratios studied, an increase in induced drag due to rolling moment of 5% to 20% can be expected. In some cases, higher percentages can be expected for taper ratios less than 0.4.
Values of  $ {\mathit{\kappa }}_{\mathit{D}{\ell}}$ using optimal aileron design as a function of taper ratio for aspect ratios ranging from 4 to 20 in increments of 2.

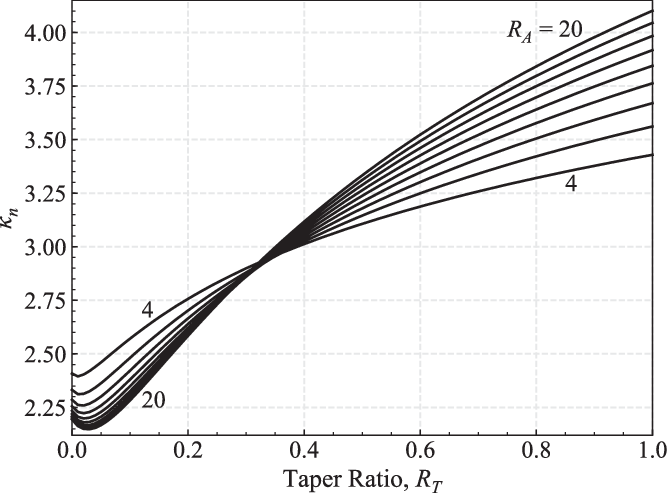
Results for  $ {\kappa }_{n}$ are shown in Fig. 12 and can be interpreted as a proportionality constant for adverse yaw. Note that at a taper ratio near 0.32, the value for
 $ {\kappa }_{n}$ is very nearly independent of aspect ratio, and all solutions have a value very near 3.0. From Equation (46) we see that if all
 $ {a}_{j}$ terms for
 $ n > 2$ are zero,
 $ {\kappa }_{n}=3.0$. This would be the case for an elliptic wing planform, but could also be produced by a morphing wing employing the symmetric twist distribution given in Equations (29) and (30)(Reference Phillips12). Therefore, we can conclude that wings with a taper ratio near 0.32 produce nearly elliptic lift distributions in the absence of aileron deflection. A similar trend can be seen in Fig. 1, in which
 $ {\kappa }_{D}$ is minimised near an aspect ratio of 0.4 nearly independent of taper ratio. At lower taper ratios,
 $ {\kappa }_{n}$ is generally less, which decreases the adverse yawing moment. Equation (45) shows that if
 $ {\kappa }_{n}$ is negative, proverse yaw will result. From the results in Fig. 12, it is clear that proverse yaw is not attainable if the aileron placement is chosen to minimise induced drag on this class of wing planforms with zero twist. It is important to emphasise that symmetric twist (washout) has not been considered in this analysis. This would change the values for
 $ {\kappa }_{n}$. With symmetric twist, the values of
 $ {\kappa }_{n}$ could drop below 0 in certain conditions and the wing could then create proverse yaw during roll. This is a topic of future work.
Values of  $ {\boldsymbol{\kappa }}_{\textit{n}}$ using optimal aileron design as a function of taper ratio for aspect ratios ranging from 4 to 20 in increments of 2.

An example application of the results presented above is in order. A designer with a previously chosen aspect and taper ratio, in this example 14 and 0.6 respectively, could look at Fig. 10 and see that setting the aileron root at 26% of the wing semispan minimises the induced drag from the aileron. Figure 11 gives a corresponding  $ {\kappa }_{D{\ell}}$ of about 0.11, while Fig. 1 gives a
 $ {\kappa }_{D}$ of about 0.045. These values can be used along with a desired lift and rolling moment in Equation (39) to give the total induced drag for the wing. With a prescribed lift coefficient of 0.5 and rolling moment coefficient of 0.05, the induced drag coefficient is 7.99
 $ \times $ 10−3. Figure 12 gives a
 $ {\kappa }_{n}$ value of about 3.42, which can be used along with a desired lift and rolling moment in Equation (45) to give the yawing moment coefficient for the wing, which in this case is −1.94
 $ \times $ 10−3. This methodology provides useful estimates for initial wing design.
5.0 CONCLUSION
The induced drag produced by an aileron deflection for a prescribed rolling moment depends on the size and location of the aileron. Aileron size and locations that minimise induced drag at zero rolling rate have been found using a numerical steady-state potential-flow method. The theoretical foundation for this approach has been presented based on classical LL theory and shows that the optimum size and location of the ailerons for minimising induced drag is independent of prescribed lift and rolling moment. Results from this theory show how the induced drag and yawing moment are related to planform, aileron design, lift, and rolling moment through Equations (39) and (45). For the purposes of this study, the dependence on symmetric wing twist (washout) was neglected in the computation of the resulting yawing moment.
Due to grid-clustering limitations of the classical LL theory, a numerical equivalent to this theory was employed for the optimisation work. Grid-convergence studies were performed to ensure grid-resolved solutions from the numerical algorithm, and a unique optimisation approach was used to deal with step-changes in the domain due to grid adjustments during optimisation. An example design space is given in Fig. 7 for the induced drag as a function of aileron size and location, as well as the resulting yawing moment in Fig. 8. It was found that, within the accuracy of the algorithms used and for the wing planforms studied, the aileron design that minimises induced drag always extends to the wing tip. However, the optimum aileron root location varies with taper ratio and aspect ratio.
Results for the optimum aileron root location are shown in Fig. 10 over the range of planforms included in the study. Corresponding results for the induced-drag factor and yawing moment-factor are shown in Figs. 11 and 12. The induced-drag factor  $ {\kappa }_{D{\ell}}$ shown in Fig. 11 is the percent increase in induced drag due to rolling moment relative to the optimum continuous twist that could be used to produce that same rolling moment and minimise induced drag. This optimum continuous twist is given in Equation (33). Because a continuous variable trailing-edge wing could be designed to give
 $ {\kappa }_{D{\ell}}=0$, the rolling-moment factor results in Fig. 11 show some measure of the benefits that could be expected from morphing-wing technology, including VCCTE and VCCW applications. These results show that optimal discrete aileron designs can produce between 5% and 20% more induced drag due to rolling moment than could a morphing wing for taper ratios greater than 0.4, and greater than 20% for taper ratios less than 0.4 in some cases. This percent difference between the optimal morphing wing design and optimal discrete wing design depends on wing aspect ratio and taper ratio; the difference is much larger at lower taper ratios.
Optimal aileron root results shown in Fig. 10 can also be used to select optimal sizing of ailerons during initial design studies to minimise induced drag. Corresponding results for the planform penalty factor, rolling-moment factor and yawing-moment factor shown in Figs. 1, 11, and 12 can be used in conjunction with Equations (39) and (45) to predict the resulting induced drag and yawing moment for a given design.
The present study has considered only wings without twist, and showed that in all cases, no special placement of the aileron would produce proverse yaw. However, twist can be used along with aileron placement to produce proverse yaw with a prescribed rolling moment. A study detailing this combination of twist and aileron placement is presently underway and focuses on a special class of optimal lift distributions. Results from that study are expected to shed further insight on the benefits of employing morphing actuation to actively twist a wing in comparison to discrete control surfaces. Future studies should also include transient-flow conditions including the dynamic response of the wing to aileron deflection.
ACKNOWLEDGEMENTS
This work was funded by the U.S. Office of Naval Research Sea-Based Aviation program (Grant No. N00014-18-1-2502) with Brian Holm-Hansen as the program officer.