1. Introduction
Recent years have witnessed growing inequality of income within many countries. Concern about inequality has also increased, as reflected in political movements such as “Occupy Wall Street” in the USA and the “gilets jaunes” (“yellow vests”) in France and in the popularity of Thomas Piketty’s (Reference Piketty2014) study of the rise of inequality in Europe and the USA over 250 years.Footnote 1
Benefit–cost analysis (BCA), as usually practiced, sums monetary values of policy effects across individuals. It does not account for how benefits and costs are distributed in a population and may not incorporate social concerns about inequality. The underlying notion is to distinguish between efficiency (producing the greatest possible benefit from available resources) and equity (fair or appropriate distribution of benefits and costs). BCA is often described as evaluating only efficiency, what Posner (Reference Posner1979) describes as “wealth maximization.” Textbooks and guidance documents recognize that both efficiency and equity are important to policy choice and often recommend that BCA be supplemented by analysis of the distribution of effects, leaving it to decision-makers to determine how to integrate concerns about efficiency and equity (e.g., OMB, 2003; Zerbe et al., Reference Zerbe, Davis, Garland, Farrow and Zerbe2013; European Commission, 2015; Robinson et al., Reference Robinson, Hammitt and Zeckhauser2016; HM Treasury, 2018). An alternative perspective is that policies should be chosen on the basis of maximizing net benefits using tax and transfer programs to offset any undesired distributional effects (Mishan, Reference Mishan1969; Harberger, Reference Harberger1978, Reference Harberger1980; Kaplow, Reference Kaplow1996, Reference Kaplow2004). I will use the term “equal-weight BCA” to describe the type of BCA in which monetary values of benefits and harms are added across individuals, with the implication that distributional effects can be considered separately.
The analytic distinction between efficiency and equity is imperfect because the measure of efficiency depends on the numéraire, the good in which benefits and costs are measured. When individuals’ rates of substitution between potential numéraires differ, the relative efficiency of different policies can be affected by the choice among them. It is often stated that although BCA uses monetary values of wealth or income as the numéraire, the analysis could be conducted using other goods instead. This is true, but it is less widely recognized that changing the numéraire can affect the ranking of alternative policies.
Other interpretations of BCA are sensitive to distributional effects (Florio, Reference Florio2014). Drèze and Stern (Reference Drèze, Stern, Auerbach and Feldstein1987) define BCA as summing individually weighted net benefits as a method to evaluate the change in a specified social welfare function (SWF); Weisbrod (Reference Weisbrod and Chase1968) advocates a similar approach. Johansson (Reference Johansson1998) describes summing unweighted net benefits as “a very unusual interpretation of the meaning of a social cost–benefit analysis” (p. 490).
Distributional effects can be incorporated using weighted BCA (Drèze & Stern, Reference Drèze, Stern, Auerbach and Feldstein1987; Adler, Reference Adler2016; Fleurbaey & Abi-Rafeh, Reference Fleurbaey and Abi-Rafeh2016) or an SWF (Adler, Reference Adler2019). An SWF ranks distributions of well-being in a society and can incorporate preferences for both efficiency and distribution. In contrast to BCA, it requires a method for evaluating individuals’ well-being that allows for interpersonal comparisons, that is, the ability to determine whether the effects of a policy on one person provide a larger, smaller, or equal change in well-being as the (possibly different) effects of that policy on another person. Weighted BCA multiplies individuals’ net benefits by a distributional or welfare weight before summing; the calculated net social benefits are more sensitive to effects on individuals with larger weights. Weighted BCA can approximate the effects of using an SWF or an alternative numéraire, at least for policies having small effects on individuals.
Concerns about distributional equity may pertain to distribution across multiple dimensions. Often, the concern is about differences in income or wealth, but the interests of many diverse groups are raised in policy making.Footnote 2 The USA has regulatory guidance requiring special attention to health effects on children, minority, and low-income populations (Robinson et al., Reference Robinson, Hammitt and Zeckhauser2016). Distribution of effects across geographic regions or political jurisdictions is also a frequent concern.
The remainder of this paper elaborates on these issues. Section 2 describes the conceptual basis for equal-weight BCA and illustrates how the evaluation of efficiency can depend on the choice of numéraire. It also illustrates the equivalence between the choice of numéraire and the choice of weights used in weighted BCA. Section 3 introduces SWFs. It describes an important complexity that arises when the effects of a policy are uncertain: the results can depend on whether policy effects are evaluated ex ante (when each individual faces a probability distribution over consequences) or ex post (when the possible population distributions of consequences are evaluated and weighted by their respective probabilities). The same issue arises with BCA but receives little attention. Section 4 considers issues associated with describing the distributions of benefits, costs, and net benefits across individuals. The equity of a policy presumably depends on the distribution of net benefits; it seems implausible that one can determine whether a particular distribution of benefits is equitable without knowing how the costs are allocated. This raises methodological challenges: equal-weight BCA can proceed by estimating aggregate benefits and aggregate costs in the population without inquiring into their distribution. Determining the distribution of net benefits requires estimating not only the marginal distributions of benefits and costs in the population but also their joint distribution (alternatively, the marginal distribution of net benefits). For many policy consequences, estimating even the marginal distributions of benefits or costs, much less the joint distribution, may be exceedingly difficult. Section 5 presents conclusions.
2. Equal-weight benefit–cost analysis
An individual’s well-being depends (in part) on the levels of goods and services she consumes. The individual determines some of these levels by her market behavior, for example, as a buyer of goods and a seller of labor. The levels of other consumption, such as ambient air quality, are determined by her environment and public policies.Footnote 3 Conventional economics assumes that each individual has a complete and transitive preference ordering over possible consumption bundles. It is commonly assumed that this preference ordering aligns with her self-assessed well-being, that is, that she prefers bundles that yield greater well-being. Clearly this is not always true, for example, when the individual is misinformed about the effects of consuming certain products.
A central problem of social choice arises from the fact that public policies cannot precisely differentiate their effects across individuals. While some targeting is possible with respect to income, residential location, and many other factors, public policies generally impose similar effects on broad classes of individuals (e.g., ambient air quality is the same for everyone in a location). In the event that everyone prefers their situation with a policy to their situation without it, the policy is Pareto superior to the status quo and is widely regarded as desirable.Footnote 4 But when some people prefer their situations with the policy and others prefer their situations with the status quo or an alternative policy, any policy choice requires reducing the well-being of some people (compared with some alternative choice) to enhance the well-being of others. This raises a central problem of social choice: when it is justified to harm some people to help others?
Conventional economics operates under the assumption that there is no objective method for comparing levels or changes in well-being between individuals. To compare gains and losses among people requires choosing a standard for comparison. This contrasts with the classic utilitarian calculus in which it is assumed one can compare changes in well-being between people and determine whether the total gains exceed the total harms.
Equal-weight BCA uses monetary values as the standard for comparing benefits and harms across individuals. Assuming the effects of a policy on each individual can be measured as a person-specific monetary value,Footnote 5 the sum of these values determines whether the policy plus a set of monetary compensation payments is Pareto superior to the status quo. If the sum is positive, the policy is said to satisfy the Kaldor-Hicks compensation test and to provide a potential Pareto improvement: in principle, money could be transferred from some of those who are helped by the policy and paid to those who are harmed in such a way that every individual would prefer the policy plus transfer (paid or received) to the status quo. The policy provides a potential Pareto improvement because the outcome with the policy could be transformed by a set of transfer payments into a Pareto improvement on the status quo. The transfer payments are of course hypothetical, and it is assumed they could be made as lump-sum transfers, that is, with no administrative costs and no effects on individuals’ behavior (such as labor supply).
Equal-weight BCA may be justified on the grounds that (a) it provides an adequate and practical approximation to a desired utilitarian calculus, (b) if used over many policy choices, the individuals who gain or lose will differ and in total everyone will gain (relative to some alternative decision rule that is usually left unspecified), or (c) it maximizes the total goods and services available to the economy, and unwanted distributional effects can be ameliorated at lower cost by transfer programs than by altering policy choices. The first justification is arguable and depends on the definition of adequate approximation. The second depends on the alternative decision rule with which BCA is compared; BCA has the advantage of incorporating the preferences of everyone affected by the policy but by measuring values in monetary units tends to give greater weight to the preferences of wealthier individuals (in principle; in practice BCA often uses common values for everyone in a population). The third justification is misleading because the total of goods and services depends on how they are measured, that is, the choice of numéraire.
The case for choosing policies by the sum of unweighted net benefits and using income-sensitive taxes and transfers (“taxes” for short) to offset any unwanted distributional effects merits further discussion. Harberger (Reference Harberger1978, Reference Harberger1980) argues that the relative weights on individuals’ benefits or costs that might be associated with distributional fairness would in general differ by much more than the costs of redistributing income through changes in taxes. Since the calculated benefit of any policy effect should not exceed the least-cost method of achieving it, distributional effects should be valued not by using distributional weights but by using the cost of redistribution through a modified tax schedule.
Hylland and Zeckhauser (Reference Hylland and Zeckhauser1979) and Kaplow (Reference Kaplow1996, Reference Kaplow2004) also advocate separating efficiency from distributional goals. When distributional concerns are limited to how policy effects are distributed by income, these authors employ the concept of a distribution-neutral tax change, that is, a (positive or negative) change in taxes by income class that would make everyone indifferent between the policy with tax changes and forgoing the policy. If the policy does not affect the labor-leisure trade-off (as, e.g., a policy that improves recreational opportunities might, by inducing people to work less), labor supply and incomes are unaffected. The net change in government revenue is equal to the sum of unweighted net benefits by construction. Hence taxes can be decreased at all income levels making the policy plus taxes a Pareto improvement if and only if the sum of individuals’ net benefits is positive. The general point is any policy can be divided into distributional and nondistributional components, and it is valuable to evaluate the components independently; the construct of a distribution-neutral tax change permits direct comparison of the nondistributional effects of different policies. A limitation of the Harberger, Hylland and Zeckhauser, and Kaplow results is that changes in taxes cannot account for differences in policy consequences among people having the same income and other characteristics by which taxes can be differentiated.
It is often stated that monetary values are used for convenience and that other commodities could be used as the numéraire or standard for interpersonal comparison of changes in well-being. This is true, but the fact that the choice of numéraire can alter the ranking of policies is less well recognized. When individuals have different rates of substitution between commodities that are used as alternative numéraires, the measure of economic efficiency is affected. Hence the separation of efficiency and equity is not fixed but depends on the choice of numéraire. Footnote 6 In an Arrow-Debreu economy with complete markets, marginal rates of substitution between all goods would be equal to their price ratios and the choice of numéraire would have no effect on the evaluation. Differences in rates of substitution arise from missing markets and limited ability to trade some goods, such as health. In principle, any of a wide range of goods could be used as numéraire; perhaps the only restriction is the numéraire should be a good for which an increased quantity is always preferred (i.e., the assumption of nonsatiation is satisfied).
Consider the following example: There is a society composed of two groups, type 1 and type 2. Each group is composed of an equal number of identical members; choose units so that this number is one. There are two goods of concern, aggregate consumption goods and health. Consumption is measured in monetary units and health in nonmonetary units; for example, dollars and life years (LY), respectively. Individuals in group j are willing to trade consumption for health at a constant rate of vj ($/LY) with v2 > v1 (the difference in rates of substitution might arise because type 2 individuals are wealthier than type 1). There are two policies. Each imposes a cost of c dollars of consumption on every person. Policy A provides h1 LY to type 1 individuals and no benefits to type 2; Policy B provides h2 LY to type 2 individuals and no benefits to type 1. Policy A provides more health than policy B: h1 > h2.
The monetary value of the benefit of policy A to type 1 individuals is v1 h1, and the monetary value of the benefit of policy B to type 2 individuals is v2 h2 (calculations are summarized in Table 1). Hence the social net monetary value of policy A is v1 h1−2c and that of policy B is v2 h2−2c. Although policy A provides more health, policy B will provide greater net social benefit if v2 h2 > v1 h1  $ \leftrightarrow \frac{v_2}{v_1}>\frac{h_1}{h_2} $, that is, if the proportional difference in the rate at which health is valued by the two groups exceeds the proportional difference in the quantity of health provided by the two policies. Assume this condition is satisfied.
Equal-weight BCA using monetary values (dollars).

Note: Numerals 1 and 2 denote groups that receive benefits or pay costs; benefit and cost are measured in monetary units.
Abbreviations: BCA; benefit–cost analysis; NMB, net monetary benefits.
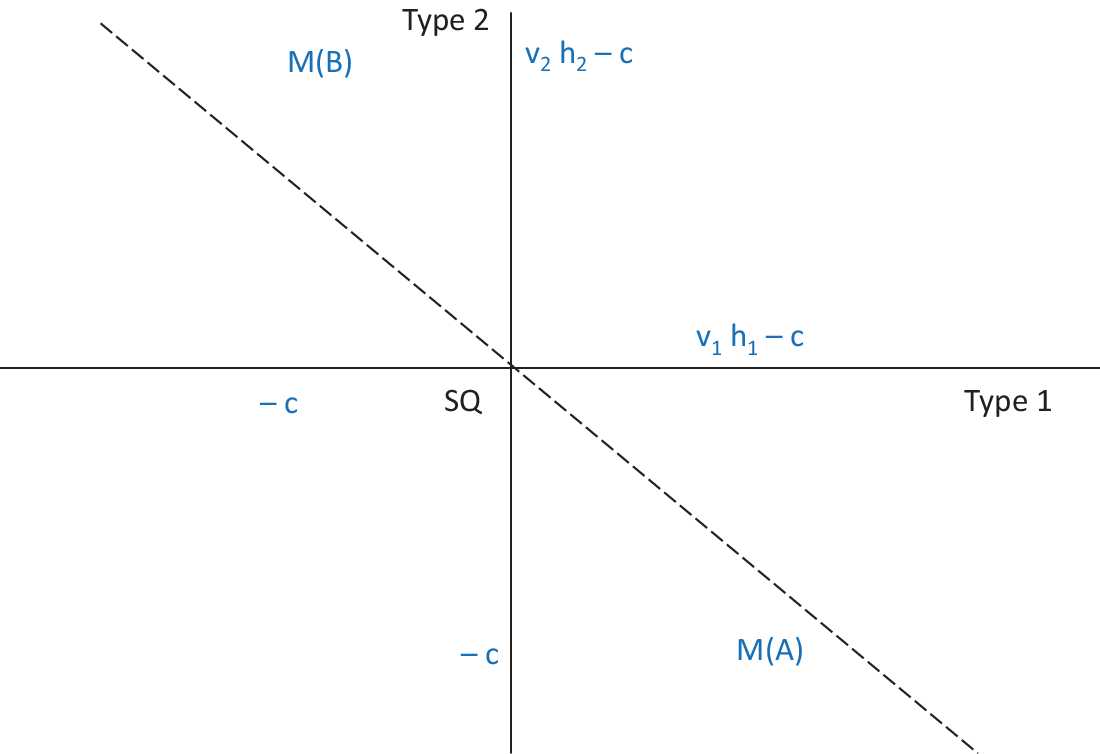
The evaluation of these policies is illustrated in Figure 1. The horizontal axis measures effects on type 1 individuals, and the vertical axis measures effects on type 2 individuals. The origin is at the status quo (SQ). Every point in the quadrant above and to the right of the origin (including the two axes) corresponds to a Pareto improvement on the status quo: at least one type is better off and neither type is worse off. The set of potential Pareto improvements includes all the points above and to the right of the dashed line with slope –1; this line describes the allocation of benefits and harms to the two groups that can be achieved from the status quo by lump-sum transfers of money from one group to the other.
Distribution and total net monetary benefits of policies A and B to groups 1 and 2.

M(A) depicts the result of policy A: compared with the status quo, type 1 individuals’ net gain is valued as v1 h1−c dollars and type 2 individuals’ net loss as c dollars. Similarly, M(B) corresponds to policy B: Type 1 individuals’ net loss is c dollars, and type 2 individuals’ net gain is valued as v2 h2−c dollars. In the figure, M(B) is above and to the right of the dashed line; it is a potential Pareto improvement on the status quo, and the social net monetary benefits are positive. In contrast, M(A) is below and to the left of the dashed line; its social net monetary benefits are negative. This situation will arise when costs are between the monetary values of the two policies, v2 h2 > 2c > v1 h1.
Alternatively, BCA can be conducted using health units (LY) as the numéraire. As shown in Table 2, the benefits of policy A are h1 LY to type 1 and 0 LY to type 2; the benefits of policy B are h2 LY to type 2 and 0 LY to type 1. The value of the costs in health units is c/vj for type j. The net benefit of policy A to type 1 individuals is valued as h1 −c/v1 LY and that to type 2 individuals as − c/v2 LY. The net benefit of a policy to a group measured in health units (shown in Table 2) is simply the net benefit measured in monetary units (shown in Table 1) divided by the rate at which group members are willing to trade consumption for health (vj). The social net health benefit of a policy is the sum of the net health benefits across the two groups.
Alternative BCA using health units (LY) as numéraire.

Note: Numerals 1 and 2 denote groups that receive benefits or pay costs.
Abbreviations: BCA, benefit–cost analysis; HB, benefit in health units; HC, cost in health units; LY, life years; NHB, net health benefits.
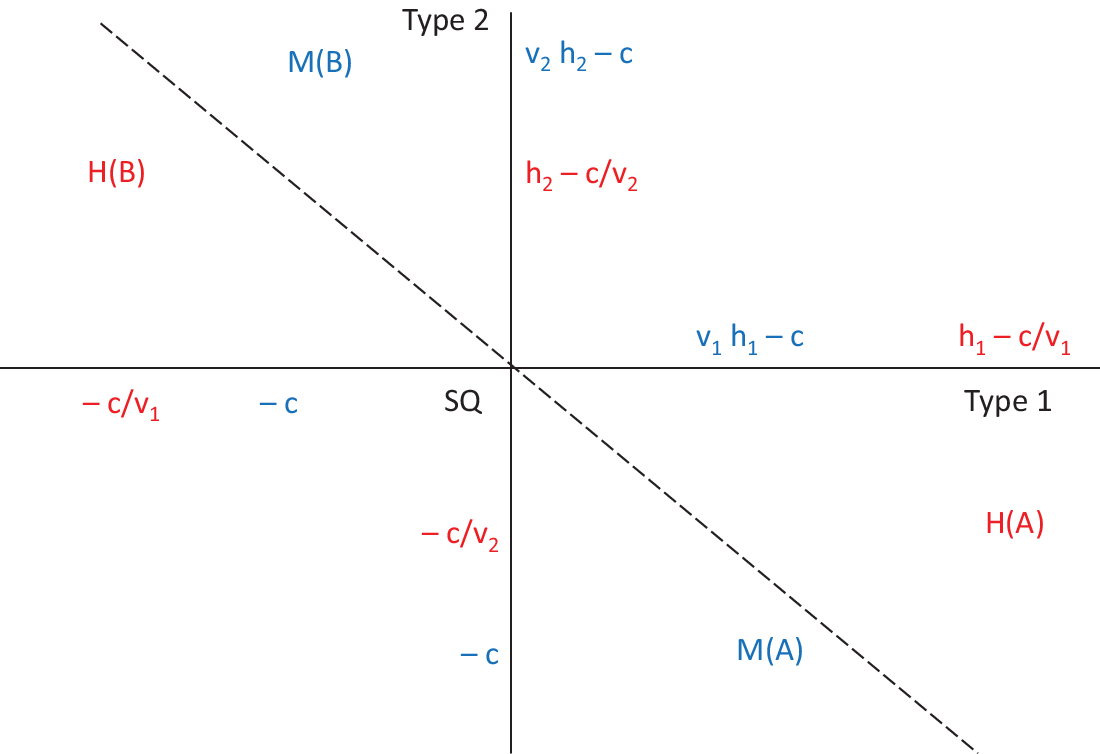
The social net health benefit of policy A is larger than that of policy B. Changing the numéraire used for the analysis (from monetary to health units) has changed the policy that has greater social net benefit (from B to A). To clarify, consider Figure 2, which adds the evaluation using health units to Figure 1. It is convenient for the exposition to choose units for consumption and health so that v2 > 1 > v1. Then the benefits and costs to type 1 individuals (plotted along the horizontal axis) are larger in absolute value when measured in LY than in dollars, and the benefits and costs to type 2 individuals (plotted along the vertical axis) are smaller in absolute value when measured in LY than in dollars. Policy A provides net benefits to type 1 and net costs to type 2 individuals. Using health as the numéraire increases the magnitude of the benefits to type 1 and decreases the magnitude of the costs to type 2 individuals, shifting the outcome upward and to the right from M(A) to H(A). Conversely, policy B provides net costs to type 1 and net benefits to type 2 individuals. Changing from monetary to health units increases the cost to type 1 individuals and decreases the benefits to type 2 individuals, shifting the outcome downward and to the left from M(B) to H(B). The change of numéraire has a large enough effect to reverse the policy ranking by social net benefit: Using health units as the numéraire, policy A has positive net benefit (H(A) is above and to the right of the dashed line), and policy B has negative net benefit (H(B) is below and to the left of the dashed line), opposite the case using monetary units.
Distribution and total net monetary benefits and net health benefits of policies A and B.

The example illustrates how the evaluation of efficiency depends on the units in which benefits and costs are measured. In general, the shape of a well-being possibility frontier can change when one numéraire is substituted for another. Assuming there are no feasible points that are Pareto superior to the status quo or to either policy, then the efficient frontier using monetary values includes M(A), SQ, and M(B), but the efficient frontier using health values is flatter and includes H(A), SQ, and H(B). The notion that efficiency and distribution can be cleanly separated is an oversimplification; the efficiency of a policy as evaluated using BCA can depend on the choice of numéraire.
Introducing weights to BCA can reproduce the effect of changing the numéraire (at least for small changes in individuals’ outcomes). Because the net health benefit of a policy to a group equals the net monetary benefit divided by the monetary value per health unit, summing net health benefits across groups is equivalent to summing net monetary benefits weighted by the reciprocal of the monetary value per health unit for each group. In symbols,  $ \sum {NHB}_j=\sum {w}_j{NMB}_j $, where wj = 1/vj, NMBj and NHBj are the net monetary benefit and net health benefit to group j, respectively, and the summations are over the groups indexed by j. Footnote 7
Note that cost-effectiveness analysis (CEA) as widely used in evaluating health and medical interventions combines two numéraires: health effects are evaluated in health units such as quality-adjusted life years (QALYs) while resource costs are evaluated using monetary units (Neumann et al., Reference Neumann, Sander, Russell, Siegel and Ganiats2016). The effect is to aggregate health and other consequences using different standards for interpersonal comparison. When the units are dollars and QALYs, health consequences are aggregated so that a QALY counts the same, regardless of which individual receives it, and costs are aggregated so that a dollar counts the same, regardless of which individual pays it. Policies are summarized by the incremental cost-effectiveness ratio (ICER), defined as the incremental cost divided by the incremental health effect, where the increments are the differences between the consequences of the policy and of some comparator (such as the status quo or a specified alternative policy). Its units are dollars per QALY. If both incremental costs and incremental health effects are positive, then policies with a smaller ICER are more efficient (they cost less per unit health gain). Determining whether a policy is socially preferred to its comparator requires comparing the ICER with a threshold cost-effectiveness ratio that characterizes social preferences for health relative to other goods and is determined outside the CEA.Footnote 8 Stinnett and Mullahy (Reference Stinnett and Mullahy1998) propose a form of BCA using QALYs as numéraire and a threshold cost-effectiveness ratio to convert monetary amounts to QALYs (constant across individuals). Canning (Reference Canning2013) derives a form of BCA using healthy life years lived at the individual’s current income as numéraire that is consistent with CEA and with a utilitarian SWF.
What is the most appropriate numéraire? To the extent one relies on the Kaldor-Hicks potential compensation test as a justification for BCA, monetary values seem preferable to health values or other alternatives. Although money transfers are not cost free, it is feasible to transfer money between groups; in contrast, it is more difficult or impossible to transfer health. Moreover, the equivalence between weighted BCA and BCA using an alternative numéraire implies that the results of using an alternative numéraire can be easily replicated by introducing an appropriate set of weights. If BCA is defined as maximizing a specified SWF (Drèze & Stern Reference Drèze, Stern, Auerbach and Feldstein1987), then the SWF determines the weights. In this case, the weights depend on the numéraire, and the choice of numéraire does not affect the policy ranking.
Weighted BCA is not often used in practice, presumably because of the difficulty in choosing a set of weights to substitute for the possibly implicit choice of equal weights. As discussed at the end of the following section, the choice of distributional weights requires a normative judgment; the weights cannot be measured even in principle.Footnote 9 When weights are used, they tend to be based on current income as opposed to health status, race or ethnicity, social disadvantages, past conditions, or other factors. One example is the British government’s recommendation to conduct weighted BCA as a supplement to equal-weight BCA using weights that are inversely proportional to income raised to the 1.3 power (HM Treasury, 2018). This formula is based on an estimate of how marginal utility varies with income, using self-reported well-being as a measure of utility.
3. Social welfare functions
An alternative to BCA is to evaluate policies using an SWF. An SWF is a function of individuals’ utilities (that measure well-being) that can incorporate concerns for both efficiency and equity. A simple example is the utilitarian SWF,  $ {W}^U=\sum {u}_i $, where ui is the utility of individual i and the summation is over all individuals in the society. An individual’s utility is often modeled as depending only on wealth (or consumption) but can depend on health and many other factors. It is often interpreted as measuring total lifetime well-being.Footnote 10
The use of an SWF requires that measures of changes and, in some cases, levels of utilities be interpersonally comparable. For the utilitarian SWF, if a policy increases utility of individual 1 by δ1 and decreases utility of individual 2 by δ2 < δ1, calculated social welfare WU will increase. Interpreting this change as an improvement requires that δ2 < δ1 implies that the reduction in individual 2’s well-being is smaller than the increase in individual 1’s well-being. If there is no objective method for comparing changes in well-being between individuals, SWFs require a subjective (judgmental) method. This judgment is parallel to the one required to interpret a positive value of social net benefit (a potential Pareto improvement) as a social improvement when using BCA.
Under the usual assumption that utility is a concave function of income (diminishing marginal utility), the utilitarian SWF is sensitive to distribution of income; an increase in income contributes more to social utility if it goes to someone with lower income. It is not sensitive to how well-being is distributed; increasing one person’s utility by δ and decreasing another person’s utility by δ produce no change in WU.
The continuous-prioritarian (“prioritarian” for short) SWF sums transformed individual utilities,  $ {W}^P=\sum g\left({u}_i\right) $, where g(u) is a continuous, increasing, concave function of u (i.e., the slope is positive and decreases as u increases). Like the utilitarian SWF, the prioritarian SWF is an increasing function of each individual’s utility; any Pareto improvement increases social welfare. Unlike the utilitarian SWF, social welfare is sensitive to the levels of utility of the persons affected.Footnote 11 The prioritarian SWF exhibits inequality aversion: any transfer of utility from someone with higher utility to someone with lower utility increases WP; holding total utility in a society constant, the prioritarian SWF is maximized when utility is distributed equally.
The degree of inequality aversion of a prioritarian SWF is characterized by the curvature of the transformation function g. If g is linear, the prioritarian SWF is the utilitarian SWF and exhibits no inequality aversion. At the opposite extreme, the prioritarian SWF corresponds to the leximin SWF, which evaluates social welfare by the utility of the individual with the smallest utility, if these are equal by the utility of the individual with the second smallest utility and so on.
Applying a prioritarian SWF when policy outcomes are uncertain raises an interesting complexity: the evaluation can depend on whether the policy is evaluated ex ante or ex post. To illustrate, let the utility of individual i depend on the state of nature s. The state of nature is unknown, but the probabilities of all states are known; the probability of state sk equals pk. The ex ante prioritarian SWF is the sum over individuals of each person’s expected utility,  $ {W}^{EAP}=\sum_ig[\sum_k{p}_k{u}_i\left({s}_k\right)] $. The ex post prioritarian SWF is the expected value of the social welfare in each state of nature,
 $ {W}^{EPP}=\sum_k{p}_k\{\sum_ig\left[{u}_i\left({s}_k\right)\right]\} $. The two evaluations can differ because the ex ante prioritarian SWF gives priority to individuals with lower expected utility (bad lotteries), while the ex post prioritarian SWF gives priority to individuals with lower utility in more probable states (likely bad outcomes). This difference is analogous to the difference between concern for equality of opportunity (equal lotteries) and for equality of outcome.
The ex ante and ex post prioritarian SWFs each violate a property that seems desirable for social evaluation, but they violate different properties: the Pareto principle or state-wise dominance. The Pareto principle requires that if every individual weakly prefers the lottery over outcomes associated with one policy to the lottery associated with another policy, social welfare should be at least as great for the first policy. State-wise dominance requires that if the social evaluation of the outcome of one policy is at least as good as the evaluation of the outcome of another policy in every state of nature, social welfare should be at least as great for the first policy.Footnote 12
The ex post prioritarian SWF satisfies state-wise dominance but violates the Pareto principle: even if everyone prefers the lottery associated with one policy to the lottery associated with another, the second lottery may be evaluated as superior by the ex post prioritarian SWF. This can happen because the ex post prioritarian SWF effectively adds an extra degree of risk aversion to each individual’s evaluation. Individual i evaluates her lottery by its expected utility,  $ {\sum}_k{p}_k{u}_i\left({s}_k\right) $, but the ex post prioritarian SWF evaluates her lottery by the expected value of transformed utility,
 $ {\sum}_k{p}_kg\left[{u}_i\left({s}_k\right)\right] $. Individual i’s risk aversion with respect to outcomes is incorporated in the function ui. The SWF adds an extra degree of risk aversion by transforming utility through the concave function g(u), that is, it is risk averse with respect to the individual’s utility. Modifying the outcomes of individual i’s lottery in a way that increases the expected utility but also increases the spread of the utilities across states might be preferred by the individual but at the same time decrease the evaluated social welfare.
In contrast, the ex ante prioritarian SWF satisfies the Pareto principle but violates state-wise dominance. To illustrate, consider a problem inspired by Broome (Reference Broome1978). The N residents of a town wish to build a bridge across the river that divides them. Construction is dangerous and they know that one among them will be killed in an accident. Each person faces an identical risk of dying, 1/N, and each is willing to accept that risk in order to build the bridge. However, each person prefers the outcome with no bridge and no deaths to the outcome of having the bridge at the cost of the death of one of their fellow residents.Footnote 13 Ex ante, building the bridge is a Pareto improvement. But for every possible state of nature (i.e., for each individual who would die), the outcome under the status quo is better than the outcome of building the bridge.
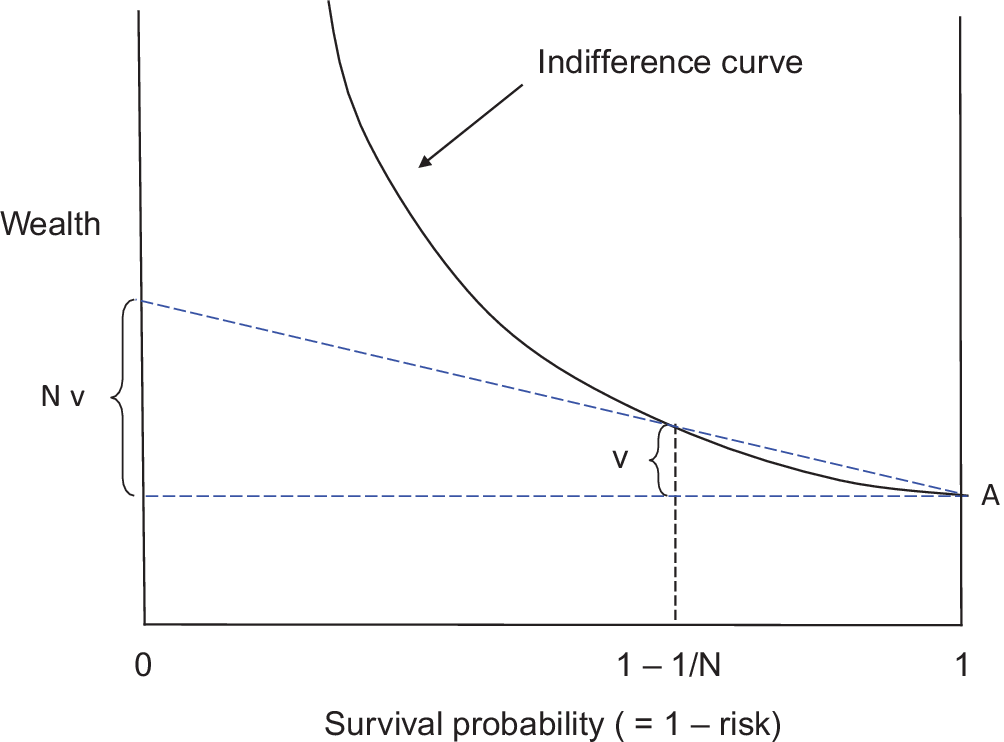
Note that BCA, like the ex ante prioritarian SWF, satisfies the Pareto principle but can violate state-wise dominance. In the bridge-building example, assume the individuals are identical. Their preferences concerning wealth and the risk of dying during bridge construction are summarized by the indifference curve illustrated in Figure 3.Footnote 14 Under the status quo, each individual is at point A, with mortality risk 0. To accept a mortality risk of 1/N, each would require compensation of v dollars. Let b denote the monetary value to each individual of having the bridge (conditional on survival). Under BCA, the cost of the project is N v and the benefit is (N−1) b. Footnote 15 Since each individual ex ante prefers building the bridge, [(N−1)/N] b exceeds v and social benefits exceed social costs. But once it is known which individual would die, the compensation that person would require to compensate for his risk is larger than N v; it may exceed (N−1) b and may be infinite (i.e., the indifference curve may not intersect the left axis, where mortality risk is 1). Ex ante, policy winners can compensate losers (since everyone is identical, there are no policy losers). But ex post, for each possible state of nature, policy winners (survivors) may not be able to compensate the sole policy loser (the individual who will die during construction).Footnote 16
Total ex ante valuation N v of mortality risk 1/N to a population of N identical individuals.

The evaluation of a policy using an SWF can be mimicked (for small changes) using weighted BCA. For simplicity, assume that individuals’ utility depends only on their wealth. Then for the utilitarian SWF, distributional weights are proportional to each individual’s marginal utility of wealth. To illustrate, let vi be the monetary value to individual i of the consequences of some policy. Under the status quo, her utility is ui(wi) where wi is her wealth and with the policy her utility is ui(wi + vi). Her change in utility due to the policy Δui = ui(wi + vi) − ui(wi) ≈ vi ui′(wi), where the prime denotes first derivative. The utilitarian SWF compares the total utility in the population with the policy to the total utility without, which is equivalent to the sum of individuals’ changes in utility. Let WU(A) and WU(S) denote utilitarian social welfare under the policy and the status quo, respectively. Then the change in social welfare  $ {W}^U(A)-{W}^U(S)=\sum_i{u}_i\left({w}_i+{v}_i\right)-\sum_i{u}_i\left({w}_i\right)=\sum_i\left[{u}_i\left({w}_i+{v}_i\right)-{u}_i\left({w}_i\right)\right]=\sum_i\Delta {u}_i\approx \sum_i{u}_i^{\prime }{v}_i $.
Hence the change in utilitarian social welfare can be approximated by the weighted sum of monetary values, with weights equal to the marginal utilities of wealth. For the prioritarian SWF, the appropriate weights are the product of the utilitarian weight ui′ and a term that depends on individuals’ utilities and the transformation function, g′(ui). Although the values may be approximately equal, the units are different: Weighted BCA measures effects in monetary units and SWFs measure them in units of social well-being.
This derivation emphasizes that the choice of distributional weights for weighted BCA is parallel to the choice of how to compare changes in individuals’ utility. Measuring individuals’ willingness to pay for changes in health, environmental quality, or other goods provides information about the slopes of their indifference curves over wealth and these goods but provides no information about the change in utility that corresponds to a change in wealth (equivalently, no information about the difference in utility between two indifference curves). Individual utility functions are unique up to a positive monotone transformation; if ui(w) represents individual i’s utility as a function of wealth, then so does hi[ui(w)], where hi is a strictly increasing function. Choosing a different function hi for an individual changes her total utility, her marginal utility of wealth, and her incremental utility for a policy change. Nozick (Reference Nozick1974) illustrates the problem of comparing changes in utility interpersonally by the inability to rule out the existence of a “utility monster,” an individual who gains so much utility from even a tiny increment of resources that maximizing utility in a society requires transferring nearly all the resources to the monster (the prioritarian SWF can yield the same result).
4. Quantifying distributions
If policy evaluation is to be sensitive to the distribution of effects in the population, the distribution must be quantified. This raises practical and even theoretical challenges that are often elided in practice.
The distribution of concern is evidently the distribution of net benefits. Knowing only the population distributions of benefits and of costs is insufficient; if the benefits and costs are each concentrated on a small subpopulation, the equity of the situation may depend on whether it is the same subpopulation. If it is, then knowing that total benefits exceed total costs suggests net benefits are positive for most members of the subpopulation and small for people outside the subpopulation; in this case, the policy is likely to be socially desirable. If the benefits are concentrated on one subpopulation and the costs on another, then judgments about equity depend on knowing the relevant characteristics of the subpopulations. Factors that may affect the merits of the distributions include wealth or income, previous circumstances (e.g., disadvantages in childhood), health, racial or ethnic status, personal responsibility for circumstances, and others.
In many cases, it may be difficult or even impossible to determine the distribution of benefits or costs, and hence of net benefits, in a population. For market goods and services, the total benefits or costs are often estimated by changes in consumer and producer surplus, which depend on shifts in demand or supply functions. But these concepts provide no information about distribution; for example, market demand may be composed of many consumers each buying a small quantity or fewer consumers each buying a large quantity. The social costs of policies that alter production costs (e.g., product safety standards, environmental regulations) may be calculated from product-market data, but the incidence of these costs on consumers, on different firms in a supply chain, and on the firms’ workers and owners may be difficult to determine.
In some cases, the distribution of effects may be unknowable. Mortality and nonfatal health effects of exposure to a wide range of environmental hazards, consumer products, foods, medicines, and other agents can be estimated using data from epidemiological studies or randomized controlled trials. These sources can be used to estimate the frequency distribution of age at death (or age at incidence of a disease) conditional on different levels of exposure to the hazard. But they cannot be used to determine which individuals died earlier than they otherwise would have because of their exposure. Data on age at death cannot even determine how many people died earlier than they otherwise would have because of their exposure. The problem is that, while the marginal distributions of age at death are statistically identified, the joint distribution of an individual’s two potential ages of death (conditional on exposure and nonexposure) is not. It is possible that exposure advances the time of death for all exposed individuals or that it advances the time of death for only a fraction of exposed individuals (by a larger amount). Life expectancy if exposed or unexposed is determined by the marginal distributions of age at death, and so the difference in life expectancy (or the expected gain in life years by eliminating the hazard) is statistically identified and can be estimated.Footnote 17
5. Conclusion
BCA that sums the monetary values of benefits and harms in a population does not account for concerns about the distribution of policy effects. The common description of BCA as measuring efficiency (the size of the social pie) as a concept that is distinct from distribution (the allocation of the pie) is misleading. In general, the size of the social pie cannot be measured without choosing some method for comparing the contributions of different goods and services to it. When individuals have different rates of substitution between them, the choice of which commodity to use as numéraire can affect the ranking of policies by their calculated efficiency.
Equal-weight BCA uses monetary values as the standard for comparison, which implies that if it measures gains in social well-being, then a gain of a dollar produces the same increase in social well-being regardless of who receives it. This implication violates two common judgments about individual preferences and a good society: first, that the marginal utility of wealth decreases as wealth increases, and second, that too much wealth inequality leads to a less-good society. Alternative evaluation methods that can better accommodate these concerns include use of an alternative numéraire (such as health units), weighted BCA, and SWFs. Each of these alternatives is used in practice, albeit to a limited extent. CEA in health policy uses health units as the numéraire for evaluating health effects (and monetary units to evaluate resource costs); in some cases, results are presented as net health benefits (Stinnett & Mullahy, Reference Stinnett and Mullahy1998). Weighted BCA is recommended (as a supplement to equal-weight BCA) in the British government’s guidance for policy evaluation (HM Treasury, 2018) and described as a method that “can be possibly used” in the European Union guidance (European Commission, 2015, Annex V). The World Bank adopted the use of welfare weights in its internal guidance in 1980, but apparently used such weights only rarely and on an experimental basis (Drèze, Reference Drèze1998; Florio, Reference Florio2014). SWFs are used in evaluating tax policies and in choosing discount rates for policies with long time horizons, such as for climate change, using Ramsey discounting (Arrow et al., Reference Arrow, Cropper, Gollier, Groom, Heal and Newell2014).
BCA has the advantage that it is practical: monetary values of many goods and services can be estimated from market data and methods for estimating values of nonmarket goods are well-developed. BCA using an alternative numéraire may be almost as practical, since the value of goods and services to an individual in an alternative numéraire is equal to the monetary value in monetary units divided by her rate of substitution of wealth for the alternative numéraire. It seems feasible to estimate at least typical rates of substitution for subpopulations defined by income and other relevant characteristics. In contrast, SWFs require explicit judgments about how to measure utility differences and perhaps levels in a way that is interpersonally comparable; since there is no objective way to do so, this requires subjective judgment and/or social agreement. In addition, SWFs require normative judgment about which SWF to employ (e.g., utilitarian or prioritarian) and perhaps additional details (such as the curvature of the utility-transformation function g). Weighted BCA can be used to mimic either the use of an alternative numéraire or a specific SWF; alternatively, if distributional weights are chosen on some other basis, it can be used directly. At least for small changes in outcomes, all four approaches (equal-weight BCA, equal-weight BCA using an alternative numéraire, weighted BCA, SWF) can produce the same policy ranking. Moreover, all four approaches depend on normative choices that are fundamentally equivalent judgments about how to evaluate improvements to some people and harms to others. It may be useful to present results showing the distribution of net benefits across subpopulations so that readers who wish to can apply their own distributional weights (Nyborg, Reference Nyborg2012).
Concerns about distributional equity influence BCA as practiced. It is common to use the same monetary value of a good for all individuals, ignoring differences associated with income or other characteristics. An important example is the use of a single value per statistical life (VSL) to value mortality risks within a population. Attempts to use different values based on income or age have met with sharp public and political opposition (e.g., when the U.S. Environmental Protection Agency applied a 37% smaller VSL to individuals older than 65 years as a sensitivity analysis in its evaluation of an air-pollution regulation; Robinson, Reference Robinson2007; Viscusi, Reference Viscusi2009). Policy evaluation is sensitive to distributional effects; for example, the executive order that requires BCA of regulations in the U.S. prescribes “agencies should select those approaches that maximize net benefits (including potential economic, environmental, public health and safety, and other advantages; distributive impacts; and equity)” (Clinton, Reference Clinton1993). Policies are often designed to set minimum standards for specific dimensions of well-being rather than to improve overall well-being. As examples, occupational and environmental health standards limit the maximum risks to which individuals can be exposed and programs to provide food, housing, education, and health care are more common than direct income support (Harberger, Reference Harberger1978).
In sum, BCA as conventionally described and practiced does not account for how benefits and costs are distributed in a population and may not incorporate social preferences over the distribution of policy effects. The beauty of BCA is that it does not require information about how a change in circumstances affects individuals’ well-being that is interpersonally comparable. But it avoids demand for this information by the implicit choice of using monetary values as the numéraire, perhaps without adequate recognition that the choice of numéraire is normative and affects the calculated efficiency of alternative policies. These limitations can be overcome but only at the cost of more explicit choices about normative assumptions of evaluation methods. BCA as practiced departs from its theoretical basis in an attempt to be more consistent with social judgments about distributional equity; BCA might find greater acceptance and application if it were modified to incorporate these concerns more directly.
Acknowledgments
This paper is based on a keynote address at the Society for Benefit–Cost Analysis: European Conference 2019. I thank the three anonymous reviewers, associate editor Massimo Florio, Matthew Adler, Kerry Krutilla, Emile Quinet, Lisa Robinson, François Salanié, Nicolas Treich, and participants at the conference for helpful comments and discussions. I acknowledge funding from the French National Research Agency (ANR) under the Investments for the Future program (Investissements d’Avenir, grant ANR-17-EURE-0010).