1.0 INTRODUCTION
A high level of mental workload is associated with an increased risk of pilot operational errors. According to recent research, aviation accidents, especially those fatal ones, could be attributed to pilot fatigue due to high levels of mental workload(Reference Caldwell, Mallis, Caldwell, Paul, Miller and Neri1–Reference Gawron3). This makes assessment and prediction of pilot mental workload an important issue in aviation safety, which has attracted increasing attention from human factors researchers in past several decades(Reference Lassiter, Morrow, Hinson, Miller and Hambrick4–Reference Wanyan, Zhuang, Lin, Xiao and Song8).
There are three major types of mental workload assessment tools: subjective rating tools, physiological measurement tools, and performance measures. Subjective rating tools usually use a set of predefined, closed, and/or open questions to elicit operators’ subjective responses to their workload levels. Examples of subjective rating tools include the NASA task load index (NASA-TLX)(Reference Hart and Staveland9), the Subjective Workload Assessment Technique (SWAT)(Reference Reid and Nygren10), the Bedford Workload Scale(11,12), the Modified Cooper-Harper Rating Scale(13,14), and the Rating Scale Mental Effort (RSME)(Reference Widyanti, Johnson and de Waard15). While subjective rating tools can be easily implemented to measure perceived workload induced by flight tasks, they have several significant limitations, such as interference with pilots’ normal operations during data collection and failure to capture transient fluctuations in workload levels during task performance(Reference Ahlstrom and Friedman16). These limitations may violate the reliability of the collected data.
Unlike subjective rating tools, physiological measurement tools provide an objective way for mental workload assessment. The use of these tools requires less interference to pilots’ normal operations. In addition, physiological signals are more sensitive to transient fluctuations in mental workload(Reference Ahlstrom and Friedman16–Reference Wanyan, Zhuang and Zhang19). One set of the most commonly used, also reliable, physiological measures for mental workload is the measures of eye movement, due to their noninvasive nature(Reference Nocera, Camilli and Terenzi20–Reference Marinescu, Ritchie and Morvan23). These measures include blink measures, pupil size, and eye fixation. For instance, it has been found that blink rate (BR) increases as a function of time on task (TOT)(Reference Fukuda, Stern, Brown and Russo24,Reference Stern, Boyer and Schroeder25) , and blink duration (BD) decreases as workload increases(Reference Ahlstrom and Friedman16,Reference Veltman and Gaillard26) . Pupil dilation can be used to distinguish cognitive tasks at different difficulty levels(Reference Beatty, Lucero-Wagoner, Cacioppo, Tassinary and Berntson27). Higher fixation frequency was found to be associated with more efforts in visual search, indicating a higher workload demand(Reference Van Orden, Limbert, Makeig and Jung28).
Mental workload can also be measured by task performance such as by primary and/or secondary task techniques. The primary task technique measures mental workload based on direct registration of an operator’s capability to perform the primary task at an acceptable level (i.e., an acceptably low error rate and a high level of efficiency). The secondary task technique requires an operator to perform dual tasks (i.e., a primary task and a secondary task), with one task taking priority over the other. The secondary task that is designed to occupy the same resources as the primary task can therefore be considered as a metric of mental workload. However, the task performance techniques are task dependent and less reliable compared with physiological measures of mental workload(Reference Colle and Reid29). Thus, they are usually applied in combination with physiological measures to make the evaluation reliable(Reference Ryu and Myung30–Reference Liao, Li, Li, Cheng and Green32).
While the above tools have been proven to be valid to some degree, most of the assessments did not consider the possible personal and environmental factors. Pilots’ experience is one of important personal factors. It has been widely reported that physiological responses to tasks with varied difficulty levels differ between expert and non-expert pilots(Reference Ebbatson, Harris, Huddlestone and Sears33,Reference Kennedy, Taylor, Reade and Yesavage34) . Environment factors can also play an essential role in mental workload. McCann(Reference Mccann, Parke, Andre, Hooey, Foyle and Kanki35) reported that low-visibility and night conditions contributed to mental workload. Hooey and Folye(Reference Hooey and Foyle36) found that a variety of environmental conditions (e.g., airport complexity, visibility) could affect mental workload. However, pilots’ experience and environmental factors have not been accounted for by current mental workload assessment tools, possibly compromising the accuracy of the tools.
The present study aimed to address the above-mentioned limitation through the use of information theory. Specifically, information theory is able to help estimate the amount of information processed during a specified time period. Mental workload was reported to be positively associated with the amount of information needed for completing a cognitive task(Reference Li, Fang and Zhou37). Therefore, we proposed a novel mental workload assessment model based on information theory, and we named our model the Mental Workload Assessment- Information Theory (MWA-IT). The MWA-IT used eye-tracking data as input and considered several influencing factors, including pilot flight experience, environmental visibility, and task complexity. To test this model, a taxiing experiment was used. A detailed description of how the development and validation of this novel model is provided in the following section.
2.0 THEORY
Higher mental workload is associated with a greater amount of processed information per unit time(Reference Klemmer and Muller38). Therefore, the rate of information processed (C V) during the task of interest could be used to assess the mental workload of pilots. The MWA-IT model was based on information theory, and was expected to provide the rate of information processed by pilots to complete specific flight tasks. The basic paradigm of information theory is outlined by Shannon’s law:
 $$\matrix{ {C = Wlo{g_2}{{S + N} \over N},} & {\left( 1 \right)} \cr } $$
where C is the information capacity (i.e., the maximum rate of information transmitted under noise), W is the bandwidth (i.e., the amount of information transmitted per second), N is the power of noise (i.e., level of noise interference), and S is the power of the signal. This law basically describes the capability of information transmitted with the noise interference.
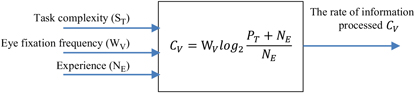
In the MWA-IT model (shown in Fig. 1), we used task complexity (ST) to correspond to the power of the signal (S) in Equation (1). In information theory, S represents information itself, which is independent of the environment in which it is transmitted. S can be quantitatively described by task complexity (S T), as S T indicates the intrinsic characteristic of S and would not be affected by the person who performs the tasks. It is also able to reflect the task’s information demand. Tasks that are more difficult require more information to be extracted and encoded(Reference Haga, Shinoda and Kokubun39). Ultimately, pilot experience level can affect performance of the task. Experts tend to complete tasks more easily when compared to novices. Therefore, the proposed model used pilot experience (N E) to represent the interference of noise (N) in Equation (1).
Configuration of the MWA-IT model.

It has been estimated that 80% of the information that people acquire is garnered through the visual channels(Reference Pulat40). This means that analysis of operator eye fixation may indicate the amount of information required to perform a task. Fixation frequency (W υ), defined as the number of fixations in a given unit of time, is shown in Equation (2):
 $$\matrix{ {{W_V} = n/t} & {\left( 2 \right)} \cr } $$
where n is the number of fixation counts and t is the fixation time during the assessed task.
Fixation frequency (W υ) is able to reflect the amount of information encoded by operators in the given time period(Reference Jacob and Karn41). Therefore, we used fixation frequency (W υ) to correspond to bandwidth (W) seen in Equation (1). Therefore, the MWA-IT model can be built as follows:
 $$\matrix{ {{C_V} = {W_V}lo{g_2}{{{S_T} + {N_E}} \over {{N_E}}}} & {\left( 3 \right)} \cr } $$
As discussed above, the inputs of the proposed model include task complexity, eye fixation frequency, and experience (Fig. 1).
3.0 METHOD
3.1 Participants
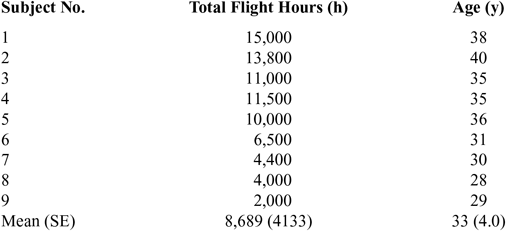
Nine male pilots participated in the study. All participants were recruited from Shanghai Eastern Flight Training Co., Ltd and had experience in flying the Airbus 320 as a captain. The age and flight hours of each participant are shown in Table 1. This research was approved by the local ethics committee at Northwestern Polytechnical University (NWPU). Informed consent was obtained from each participant.
3.2 Apparatus
The experiment was conducted in an Airbus 320 simulator at Shanghai Eastern Flight Training Co., Ltd. Eye movement data were recorded by an eye tracker (iView X HED, SMI) with a sampling rate set at 200 Hz. Raw eye movement data were collected and processed by SMI BeGaze 3.4 software (SensoMotoric Instruments GmbH, Teltow, Germany).
Demographic variables of participants

3.3 Procedures
Before the experiment, a senior training instructor from Shanghai Eastern Flight Training Co., Ltd set up the simulation scenarios and discussed the flight plan with the participants. In the simulation tasks, participants took full manual control to perform a landing from the last approach point, as well as taxiing to the arrival gate at Beijing International Airport. This was done according to the flight plan and while following instructions from a pseudo air traffic controller.
Flight in general can be divided into phases of en route, approach, and taxiing. A number of human factor studies have been conducted to investigate pilots’ behaviours in such phases as en route and approach(Reference Ebbatson, Harris, Huddlestone and Sears33,Reference Sarter, Mumaw and Wickens42,Reference Yang, Lin and Sun43,Reference Haslbeck and Zhang45) . On the contrary, taxiing, as a complex and dynamic process, has been less studied(Reference Schonefeld and Moller46–Reference Johnson, Zhao, Faulkner and Young48). During taxiing, pilots typically have to concurrently perform multiple tasks. For example, they need to simultaneously monitor visual scenes both inside and outside of the cockpit, maintain taxiing speed and direction, and communicate with air-crews, air traffic controllers, and passengers. This imposes a very high mental workload and increases the likelihood of operational errors and accidents. Therefore, the phase of taxiing is chosen to understand pilots’ mental workload.
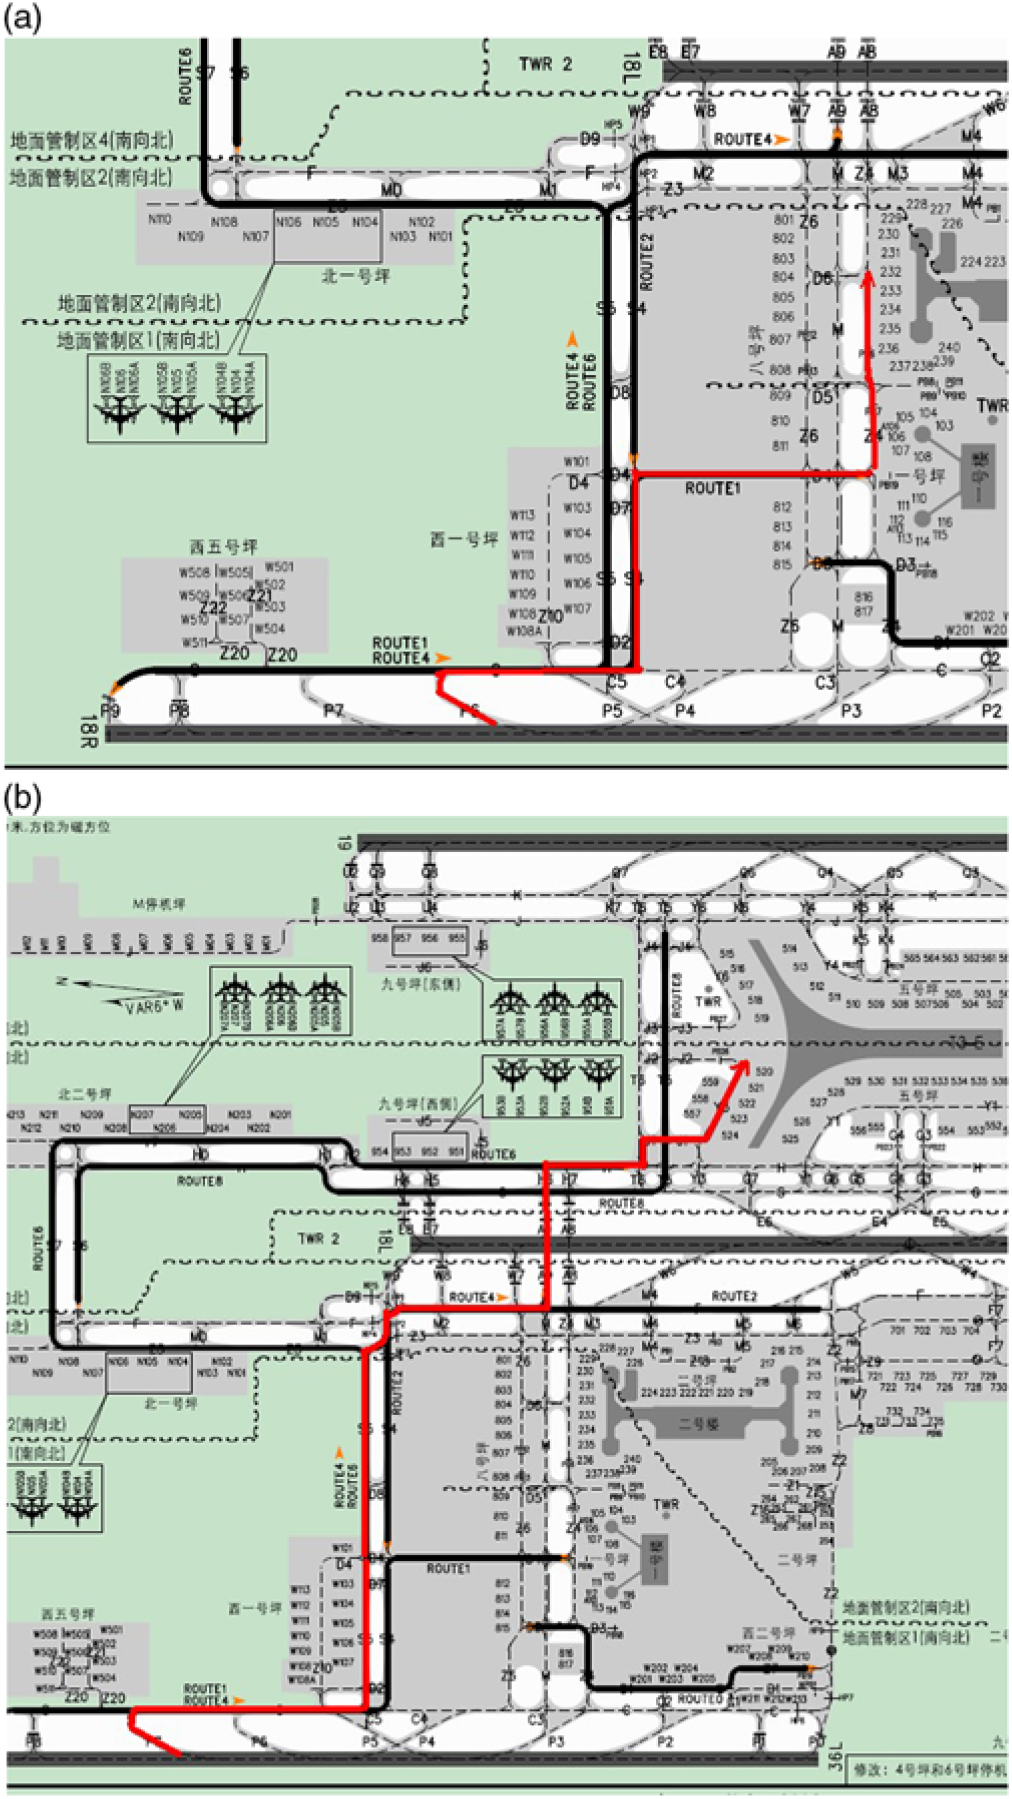
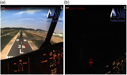
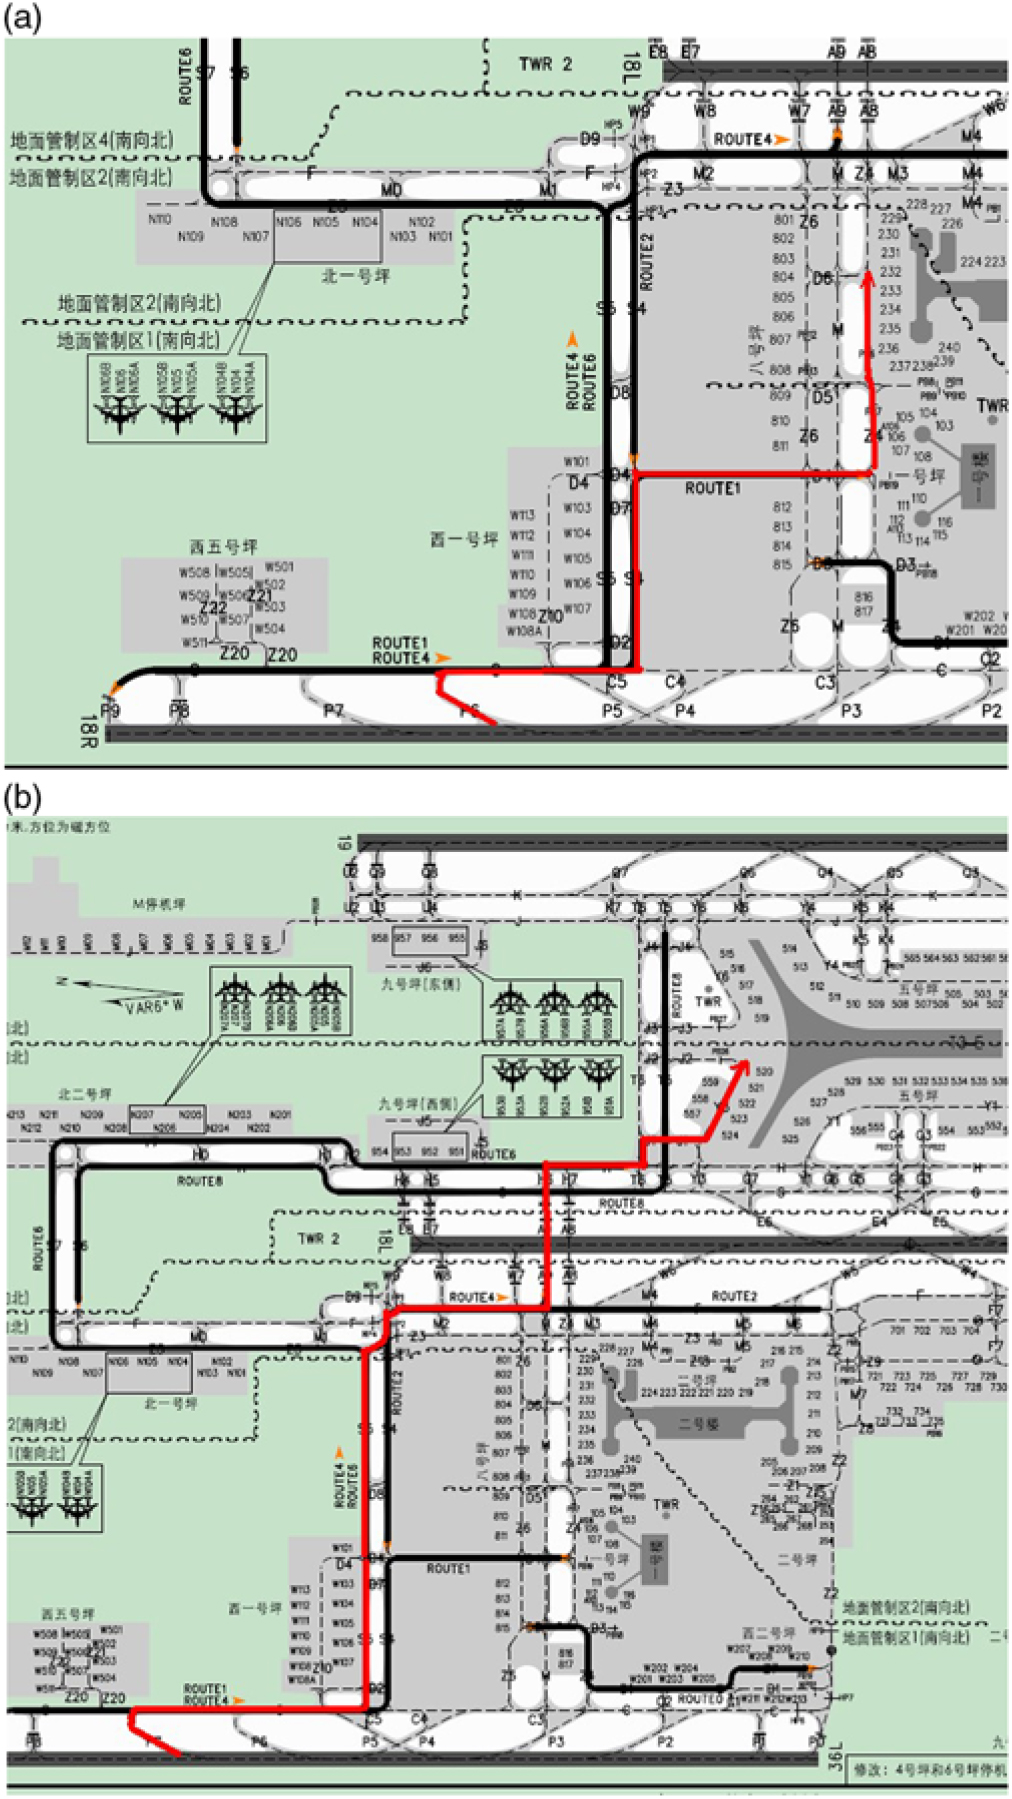
There were two taxi routes that varied by length and number of intersection crossings in this experiment (Fig. 2). One was a simple taxi route, with a length of 10.8 km and 10 separate intersection crossings, while the other was a complex taxi route, including a length of 19 km and 18 separate intersection crossings. When taxiing on the simple taxi route, the flight would exit runway 36L from P6, head north, and arrive at Gate 232. When taxiing on the complex taxi route, the flight would exit runway 36L from P7, head north, cross runway 18L, wait for runway clearance for approximately two minutes, and finally arrive at Gate 520. The simulated taxiing tasks were completed in both daytime and night-time scenarios (Fig. 3). In the daytime scenario, participants had unlimited visibility, and the flight was operated in the visual meteorological condition in which participants judged the flight situation (e.g., speed and orientation) by their own vision. In the night scenario, the airport operated in night mode, while the other meteorological conditions were normal. Each participant performed taxiing operations in four testing conditions (i.e., 2 types of taxi route complexity × 2 time scenarios), the order of which was randomly presented.
Taxi routes. (a) Simple route. (b) Complex route.
3.4 Data analysis
During taxiing tasks, task complexity (S T) was defined as follows:
 $$\matrix{ {{S_T} = lo{g_2}\left( {L \times {N \over V}} \right)} & {\left( 4 \right)} \cr } $$
where L was the length of the taxiing route in km, N was the number of turns, and V was the airport visibility. L and N were determined by the assessed taxiing task. V was specified by pilots according to the criteria presented in Table 2.
Five different visibility levels

Two different taxiing conditions. (a) Clear day. (b) Low visibility.

Additionally, because experience is a multifaceted construct(Reference Ericsson and Lehmann49,Reference Glaser, Chi, Chi, Farr and Glaser50) , it was measured by multiple indicators: (a) total flight hours, (b) instrument flight hours (actual and simulated combined), and (c) type of pilot rating (i.e., a commercial certificate with instrument ratings or a flight instructor training). Sixteen experts who had at least ten years of pilot training experience evaluated the pilots’ experience based on the three indicators with 5-point Likert-type scales. A complex index was created by summing up the grades of the three indicators with equal weights. The complex index was then normalised to a real number between 0 and 1, where 0 was the minimum and 1 the maximum experience value.
3.5 Subjective and objective measures of mental workload
Both subjective and objective measures were employed to assess pilots’ mental workload. Subjective measures were administered after the completion of each taxiing task by using the NASA-TLX.
The objective measure of mental workload in our study was mean pupil area, which was calculated from data recorded by the eye-tracking system. The system provides pupil diameters (in pixels) along the x-axis (diaX ) and y-axis (diaY ). Pupil size was computed as an ellipse area using the equation below:
 $$\matrix{ {Pupil{\rm{ }}area = \pi \times diaX/2 \times diaY/2} & {\left( 5 \right)} \cr } $$
Mental workload was also calculated using formula (2).
Sensitivity validity was chosen to validate the MWA-IT.
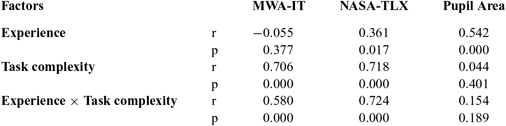
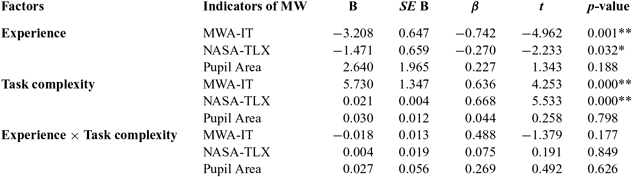
Sensitivity was performed by linear regression to determine the main effects of “task complexity” and “experience” on NASA-TLX (TLX) scores, mean pupil area, and mental workload (MWA-IT). Bi-variate correlations between MWA-IT, TLX, and mean pupil area were calculated and used to validate our mental workload model.
Workload means and standard deviations for each instrument: mean (SD)

Partial correlation coefficients between factors and indicators Correlation results between factors and indicators

4.0 RESULTS
Significant task complexity effect was found in NASA-TLX (F (3, 32) = 2.941, p-value = 0.048). And the same significant effect was also found in MWA-IT scores (F (3, 32) = 9.305, p-value = 0) (Table 3). However, there were no significant task complexity effects in average pupil area. Experience seemed not to effect MWA-IT scores, NASA-TLX, and pupil area.
Partial correlation regression indicated that experience correlated significantly and positively with NASA-TLX scores (r = 0.361, p < 0.05) and pupil area (r = 0.542, p < 0.05). Task complexity correlated with MWA-IT scores (r = 0.706, p < 0.05) and NASA-TLX scores (r = 0.718, p < 0.05). Results also indicate that the interaction of experience and task complexity correlated with MWA-IT scores (r = 0.580, p < 0.05) and NASA-TLX scores (r = 0.724, p < 0.05) (Table 4).
The results of the regression indicated that experience and task complexity significantly predicted MWA-IT scores and NASA-TLX scores. The two predictors explained 76.4% of the variance of MWA-IT scores (R2 = 0.583, F (2, 33) = 23.064, p < 0.05). It was found that experience significantly predicted MWA-IT scores (β = − 0.742, p < 0.05) as did task complexity (β = 0.636, p < 0.05). And the two variables could explain 72.1% of the variance of NASA-TLX scores (R2 = 0.490, F (2, 33) = 17.8, p < 0.05). It was found that experience significantly predicted NASA-TLX scores (β = − 0.270, p < 0.05) as did task complexity (β = 0.668, p < 0.05). However, there was no significant effect on mean pupil area (Table 5).
The correlation between NASA-TLX and calculated MWA-IT was 0.745 (p < 0.05). Additionally, the correlation between NASA-TLX and pupil area was 0.395 (p < 0.05). Finally, the correlation between MWA-IT and pupil area was 0.479 (p > 0.05).
Regression results of three instruments

*P < 0.05; **P < 0.01.
5.0 DISCUSSION
The results of the current study show that the method proposed in this study can predict subjective workload ratings with good accuracy (r = 0.722, p = 0.000). Furthermore, the MWA-IT model was validated to be able to reveal differences caused by task complexity, experience, and the interaction of these factors. MWA-IT and NASA-TLX showed the highest level of similarity. The study yielded positive correlation coefficients near 1 between the subjective measures of the NASA-TLX and the MWA-IT results. Thus, there is a very high level of convergent validity between these two measures.
Based on the current results, it is worth discussing several issues related to existing workload theories. First, when the task complexity varied, the method utilised in the current study could more accurately predict levels of mental workload than the subjective and eye movement methods. The existing model MWA-IT was designed based on information theory, and described the amount of information transmitted with different levels of interference per a given unit of time. The amount of information encoded in a given unit of time was more sensitive to environmental factors and the ability of task operators when compared to subjective methods. Second, the method of predicting workload in the current method differs from that of the task-based method in a fundamental way. The current method takes experience and environmental factors into account, which enhances assessment accuracy. The third issue is that the proposed method meets the typical criteria for mental workload measures (e.g., sensitivity and reliability). With regard to sensitivity, results indicate that the proposed method MWA-IT can provide measures that are at least as sensitive as the NASA-TLX. The method was able to differentiate the workload amount in four different taxiing scenarios, each with disparate elements, while the calculation of mean pupil area could not. In the current method, the workload measure generated directly originates from both the pilot and the demands of the tasks.
6.0 CONCLUSIONS
A mathematical model of pilot mental workload MWA-IT was successfully developed using information theory. The model was built accounting for experience, task difficulty, and visual performance. Contrary to other indices evaluating mental workload, the current model allows predicting the maximum load of pilots in a specified scene, which can help in avoiding pilot overload. The results of the mental workload model are in excellent agreement with experimental data, indicating that the model satisfactorily represents the behaviour of pilots during taxiing. More comparisons between model results and experimental data are still necessary to validate the model. The results could be improved by adding more factors (e.g., communication and operations), and a more detailed description of the closed operation loop. These can be accomplished through flexible computational implementation.
Acknowledgements
This research is support in part by the National Natural Science Foundation of China under grant #51705332.