Introduction
Nasal obstruction due to refractory chronic rhinosinusitis is most commonly treated using functional endoscopic sinus surgery (FESS).Reference Stammberger and Posawetz1, Reference Tan and Lane2 Following FESS, chronic sinusitis is commonly treated using intranasal medication (e.g. corticosteroids) introduced into the sinus regions.Reference Vaughan and Carvalho3 Correct delivery of intranasal corticosteroids is necessary in order to achieve optimal efficacy. However, the major factors determining deposition of intranasal corticosteroids within the paranasal sinuses (e.g. drug particle size, aerosol pressure and rate, and maxillary ostia size)Reference Hyo, Takano and Hyo4 are still controversial.Reference Hilton, Wiedmann, Martin, Humphrey, Schleiffarth and Rimell5
Various researchers have monitored drug deposition within the nose using in vivo human studies involving computed tomography (CT),Reference Senocak, Senocak and Bozan6 gamma scintigraphy with radio-enhanced particles,Reference Homer, Maughan and Burniston7 and endoscopic video imaging using dyed test formulations.Reference Dowley and Homer8, Reference Merkus, Ebbens, Muller and Fokkens9 However, these techniques are invasive and/or difficult to implement in live human subjects, and may involve radiation exposure or deposition of foreign particles within the lung.
Computational fluid dynamics modelling is an emerging technology which enables valid, accurate and straightforward assessment of particle deposition within the healthy nasal cavity.Reference Kimbell, Segal, Asgharian, Wong, Schroeter and Southall10–Reference Shanley, Zamankhan, Ahmadi, Hopke and Cheng16 This technology enables careful simulation and analysis of the effects of particle size, spray cone diameter and spray cone angle on the deposition of particles throughout the healthy nasal cavity.
However, to our best knowledge, such modelling has not been conducted within a nasal cavity which has undergone a FESS procedure.
In nasal cavities which have undergone FESS, the ostia may be enlarged and some ethmoid cells may have been removed. Therefore, it is possible that more airflow may be directed into the paranasal sinus cavities and the upper ethmoid and sphenoid sinus regions, which may affect the local deposition of intranasal medication.
Zhao et al. Reference Zhao, Pribitkin, Cowart, Rosen, Scherer and Dalton17 conducted numerical airflow modelling of the maxillary sinus regions for pre- and post-FESS nasal cavities, but did not consider the effect of ethmoid cell removal.
More recently, Xiong et al. Reference Xiong, Zhan, Jiang, Li, Rong and Xu18 constructed a post-FESS nasal cavity model, and found increased airflow into the sinus regions with reduced nasal resistance. However, their model employed virtual FESS based on modifications to a healthy nasal model, and only a laminar, low inspiration airflow rate was used.
Hence, the current study aimed to provide qualitative and quantitative information which could guide correct usage of intranasal medication in nasal cavities which have undergone conventional FESS procedures. Computed tomography scans were taken from an adult who had undergone FESS involving right maxillary sinus ostium enlargement and partial ethmoid and sphenoid sinus removal. Computational fluid dynamics modelling was then used to simulate the airflow and drug particle deposition within a nasal cavity model constructed using the CT scan images. Drug particle deposition along the left and right nasal cavity walls was recorded. We also present and discuss the effect of different particle diameters, inspiratory airflow rates and head tilt angles on maxillary sinus particle deposition.
Materials and methods
All the subject's personal identifiers were removed before data processing for the numerical study.
Institutional review board approval was obtained.
The patient was an adult Chinese male measuring 170 cm in height and 66 kg in weight, who had previously undergone conventional FESS on his right nasal cavity (Figure 1). Image acquisition, three-dimensional reconstruction, mesh grid formation and computational simulation followed the established techniques of our research group.Reference Chen, Lee, Chong and Wang19–Reference Chen, Leong, Lee, Chong and Wang21 The CT scans were taken at 1.5 mm intervals, and the structures of the internal nasal cavity were confirmed using endoscopy and acoustic rhinometry measurements.
Typical (a) coronal and (b) sagittal computed tomography scans of the nasal cavity of a patient following functional endoscopic sinus surgery.

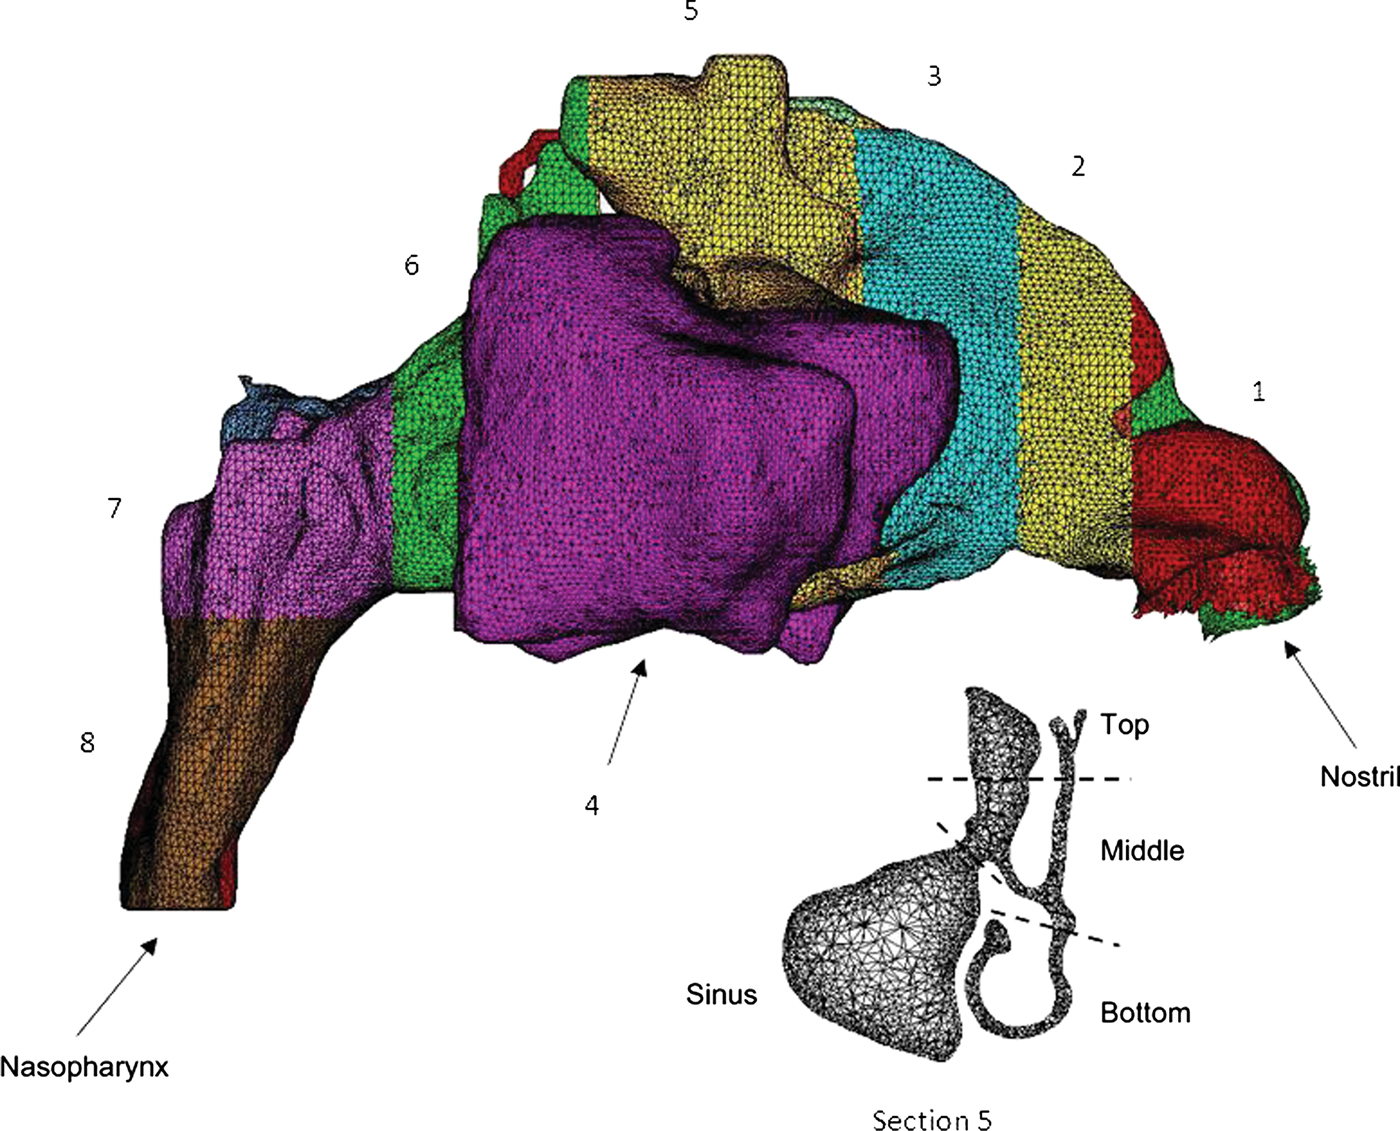
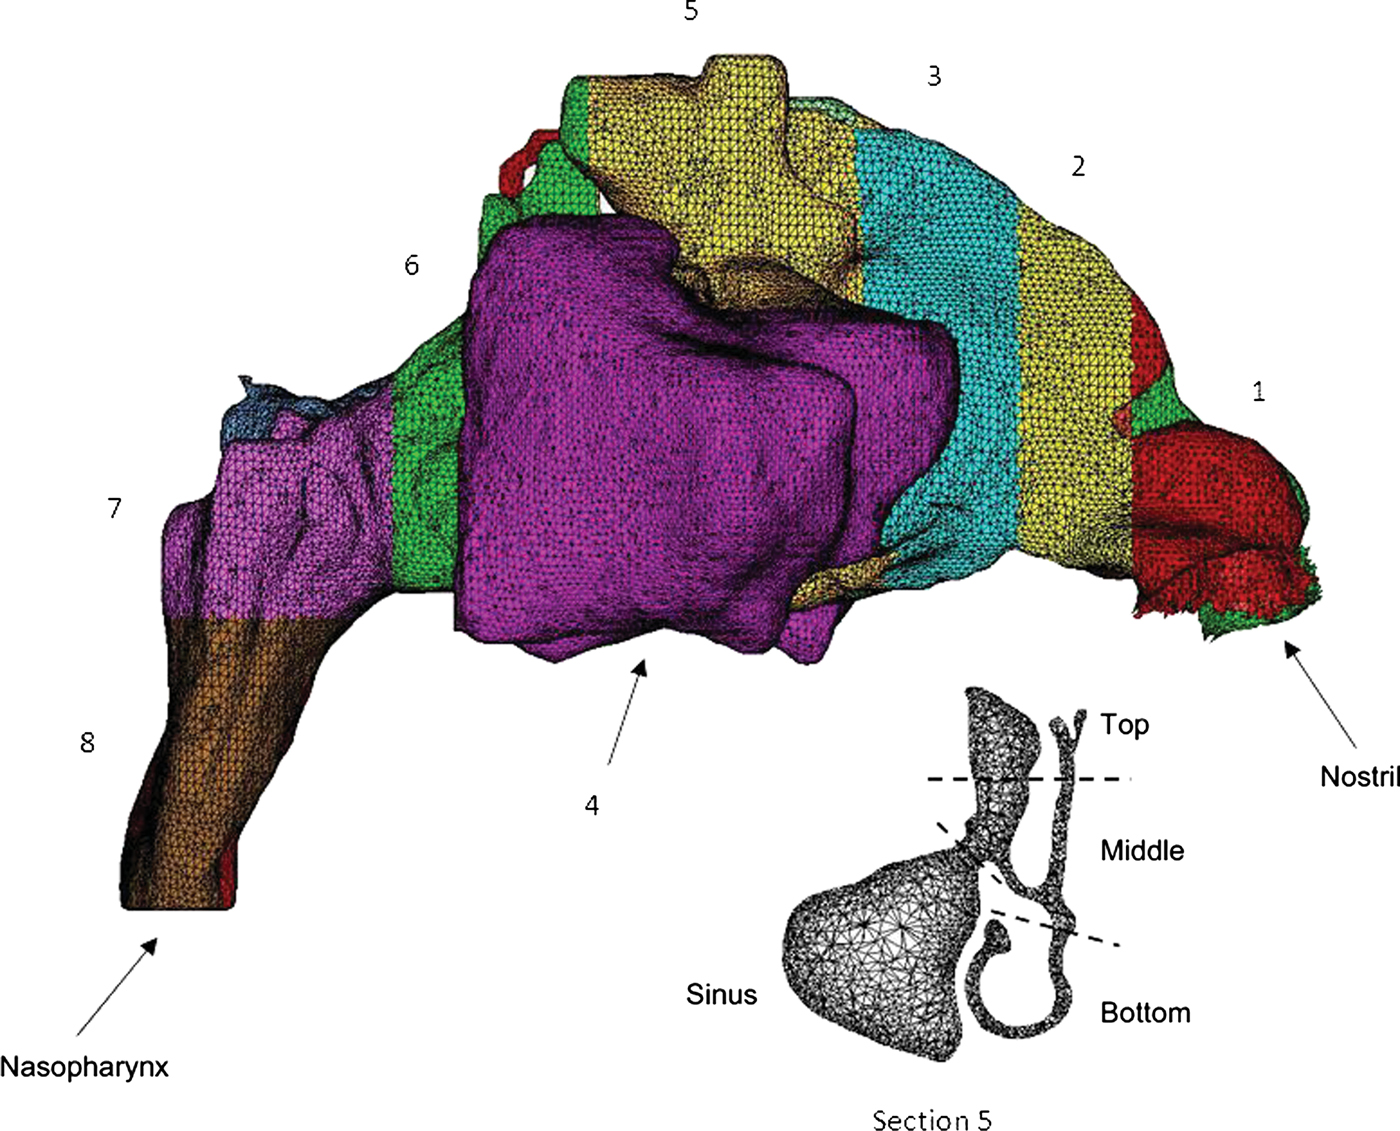
A three-dimensional image model (nasal cavity domain 76.14 cm3, Figure 2), which included the surrounding air volume within 10 cm of the nostril, was reconstructed using several commercially available software packages.Reference Chen, Lee, Chong and Wang19–Reference Chen, Leong, Lee, Chong and Wang21 A typical nasal cavity model included paranasal maxillary, ethmoid and sphenoid sinuses and comprised approximately 2.45 million tetrahedral cells, which was adequate to ensure insensitivity to mesh density (Figure 2).
Mesh illustration showing the left and right nasal cavities from the nostril to the nasopharynx, with differently coloured wall sections representing sections 1 to 8. The left and right maxillary sinuses (section 4) are shown as separate sections. Lower part shows division of section 5 into top, middle and bottom subsections.
For the computational fluid dynamic simulations, airflow was assumed to be incompressible and quasi-steady. The Reynolds averaged Navier–Stokes equation was solved with a k − ω model and a shear stress transport option for complex laminar–transitional–turbulent airflow treatments.Reference Liu, Edgar, Gu and Matthew13, Reference Xi and Longest14, Reference Chen, Lee, Chong and Wang19–Reference Chen, Lee, Chong and Wang22 Constant flow rates of 9.4, 18.8, 28.2 and 37.6 l/min at the nasopharynx were applied successively in order to model different breathing states (e.g. calm inspiration and medium and strong sniffing).Reference Kimbell, Segal, Asgharian, Wong, Schroeter and Southall10, Reference Shi, Kleinstreuer and Zhang12, Reference Inthavong, Tian, Li, Tu, Yang and Xue15, Reference Chen, Lee, Chong and Wang22 At the nostril, the pressure inlet boundary condition was applied with zero gauge pressure (i.e. atmospheric pressure). A discrete phase model was used to study the gas–particle flow (Figure 3). The Euler–Lagrange approach was implemented using the Lagrangian discrete phase model in the Fluent 6.3 software package (ANSYS, Canonsburg, Pennsylvania, USA).Reference Inthavong, Tian, Tu and Yang11, Reference Inthavong, Tian, Li, Tu, Yang and Xue15, Reference Chen, Lee, Chong and Wang22 The dispersed phase computations were performed by tracking 10 000 particles through the initially solved airflow field. Other simulation assumptions were similar to those reported previously.Reference Chen, Lee, Chong and Wang22 The effects of accretions and erosions were not considered, and particles were assumed to be trapped once they hit the nasal cavity wall.Reference Inthavong, Tian, Tu and Yang11, Reference Inthavong, Tian, Li, Tu, Yang and Xue15, Reference Chen, Lee, Chong and Wang22
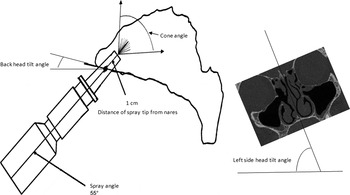
Diagram plus coronal computed tomography scan, indicating the different geometric drug delivery parameters and positions of the nasal spray.

To analyse drug particle deposition in different regions of the nasal cavity wall, the wall was separated into eight sections, from the nostril to the nasopharynx (Figure 2). The maxillary sinus region was section four. In order to distinguish and investigate drug particle deposition in the upper ethmoid and sphenoid sinuses, section five was divided into top, middle and bottom subsections (see Figure 2). We investigated the effects of initial particle velocity, particle diameter, nasal flow rate, and back and right side head tilt angle (see Figure 3). Particle traces inside the left and right nasal cavities were simulated with a spray insertion angle of 55°, a spray cone angle of 79° and a spray penetration distance of 1 cm from the nostril, as suggested by Kimbell et al. Reference Kimbell, Segal, Asgharian, Wong, Schroeter and Southall10 These parameters were fixed, while other factors were changed for the following computations.
Results
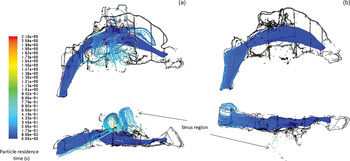
Figure 4 shows side and bottom views of the particle traces (colour-coded for particle residence time) for the left and right nasal cavities. For both cavities, it can be seen that the main particle streams were generally inside the main nasal cavity around the inferior turbinate in the ventral region. This was similar to reported particle streams within the healthy nasal cavity.Reference Chen, Lee, Chong and Wang22 The residence time at the nasopharynx was relatively longer than that at the initial spray position. This was because of variation in local velocity, which was greater inside the cavity passageway than in those regions near the nasopharynx.Reference Chen, Lee, Chong and Wang22, Reference Chen, Lee, Chong, Wang, Lim and Goh23
Side (upper) and bottom (lower) views of particle traces (colour-coded for particle residence time) for the (a) right and (b) left nasal cavities. Initial particle velocity = 1 m/second, particle diameter = 10 µm, spray insertion angle = 55°, cone angle = 79°, nose flow rate = 18.8 l/min, back and right side head tilt angles = 0°.

However, in the right nasal cavity (Figure 4a) it can be seen that some particles entered into the upper ethmoid and sphenoid sinuses, in the dorsal region, and into the right maxillary sinus. Due to these particles' relatively small size, they followed the velocity streamlines where there were circular patterns (i.e. vortexes) within regions.Reference Chen, Lee, Chong, Wang, Lim and Goh23 These particles stayed in these regions for a longer time, because of the abrupt decrease in velocity inside the wide sinus spaces.
In contrast, in the left nasal cavity (Figure 4b) fewer particles entered the maxillary and upper ethmoid and sphenoid sinuses, and particles were distributed much more uniformly. In the current model, only one particle entered the left maxillary sinus, but then circled back into the main nasal cavity.
Due to the previous FESS procedures in the right nasal cavity (Figure 1a), the maxillary sinus ostium was enlarged and parts of the ethmoid and sphenoid sinuses had been removed (Figure 1b). This could be expected to introduce a larger airflow from the main nasal cavity.Reference Chen, Lee, Chong, Wang, Lim and Goh23 In contrast, in the left nasal cavity (Figure 1b) the original, small ostium of the left maxillary sinus, and the complex upper regions, were present intact, and this helped to prevent most of the airflow (and thus drug particles) from entering these regions.Reference Chen, Lee, Chong, Wang, Lim and Goh23
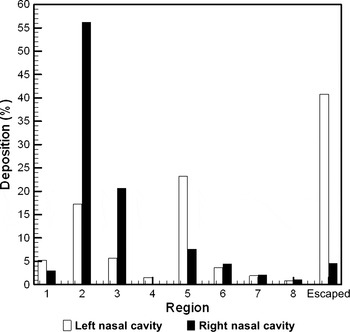
Figure 5 shows particle deposition ratios, expressed as percentages, for the different sections of the left and right nasal cavity walls. Our research group has previously published a similar analysis of a healthy nasal cavity.Reference Chen, Lee, Chong and Wang22 In both cavities, there was relatively greater particle deposition in section two due to this section's small cross-sectional area.Reference Chen, Lee, Chong and Wang20–Reference Chen, Lee, Chong and Wang22 Particle deposition in the left nasal cavity was similar to that previously reported for healthy cases.Reference Inthavong, Tian, Tu and Yang11, Reference Inthavong, Tian, Li, Tu, Yang and Xue15, Reference Chen, Lee, Chong and Wang22 However, in the right nasal cavity the largest deposition ratio (23.21 per cent) was found at section five, around the FESS site; in contrast, relatively smaller deposition ratios were detected at sections six to eight, further downstream. The ratio of escaping particles was much higher for the right nasal cavity (40.78 per cent) than the left (4.60 per cent). As predicted previously, 1.54 per cent of total particles were found to deposit in the right maxillary sinus region. There was no particle deposition in the left maxillary sinus region.
Particle deposition in the different sections of the nasal cavity. Initial particle velocity = 1 m/second, particle diameter = 10 µm, spray insertion angle = 55°, cone angle = 79°, nose flow rate = 18.8 l/min, back and right side head tilt angles = 0°.

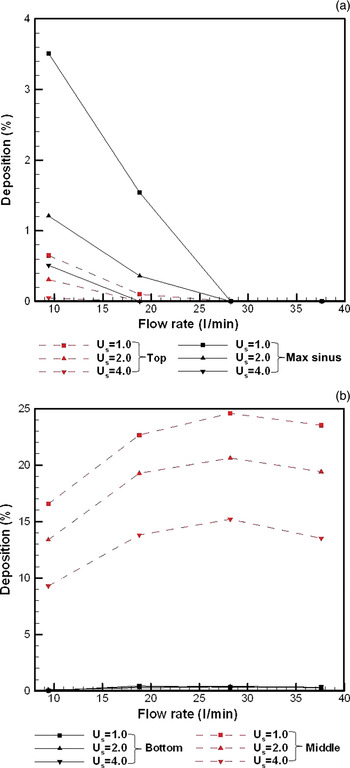
Figure 6 shows particle deposition for the right nasal cavity section five and maxillary sinus regions, for different inspiratory airflow rates and initial particle velocities. It can be seen that a lower airflow rate and lower initial particle velocity resulted in increased deposition (from 0 per cent to a maximum of 3.51 per cent) at the top of section five and in the maxillary sinus (Figure 6a). However, these deposition changes were not as significant as those found at the middle subsection of section five (i.e. from 9.29 per cent to a maximum of 24.58 per cent; see Figure 6b). This was due to the fact that the internal main airflow (with peak velocity) brought together the main particle streams and resulted in local particle deposition in the upper middle passages around the inferior turbinate.Reference Chen, Lee, Chong, Wang, Lim and Goh23
Particle deposition in right nasal cavity (a) section five top subsection and maxillary sinus, and (b) section five middle and bottom subsections, for different flow rates and initial particle velocities (Us). Particle diameter = 10 µm, spray insertion angle = 55°, cone angle = 79°, back and right side head tilt angles = 0°. Max = maxillary.

Figure 6b also shows that changes in initial particle velocity did not lead to significant changes in deposition ratio in the bottom subsection of section five, and that the deposition ratio value decreased to nearly zero when the airflow rate was 9.4 l/min. This was because airflow velocity was relatively lower in the bottom subsection of section five,Reference Chen, Lee, Chong, Wang, Lim and Goh23 and thus there was insufficient airflow to direct particles into this region. Figure 6b also shows that a constant initial particle velocity and an increasing airflow rate resulted in decreased deposition in the middle subsection of section five. This may be due to increasing deposition in the ‘frontier’ sections one to four with larger airflow rates over a short time period.
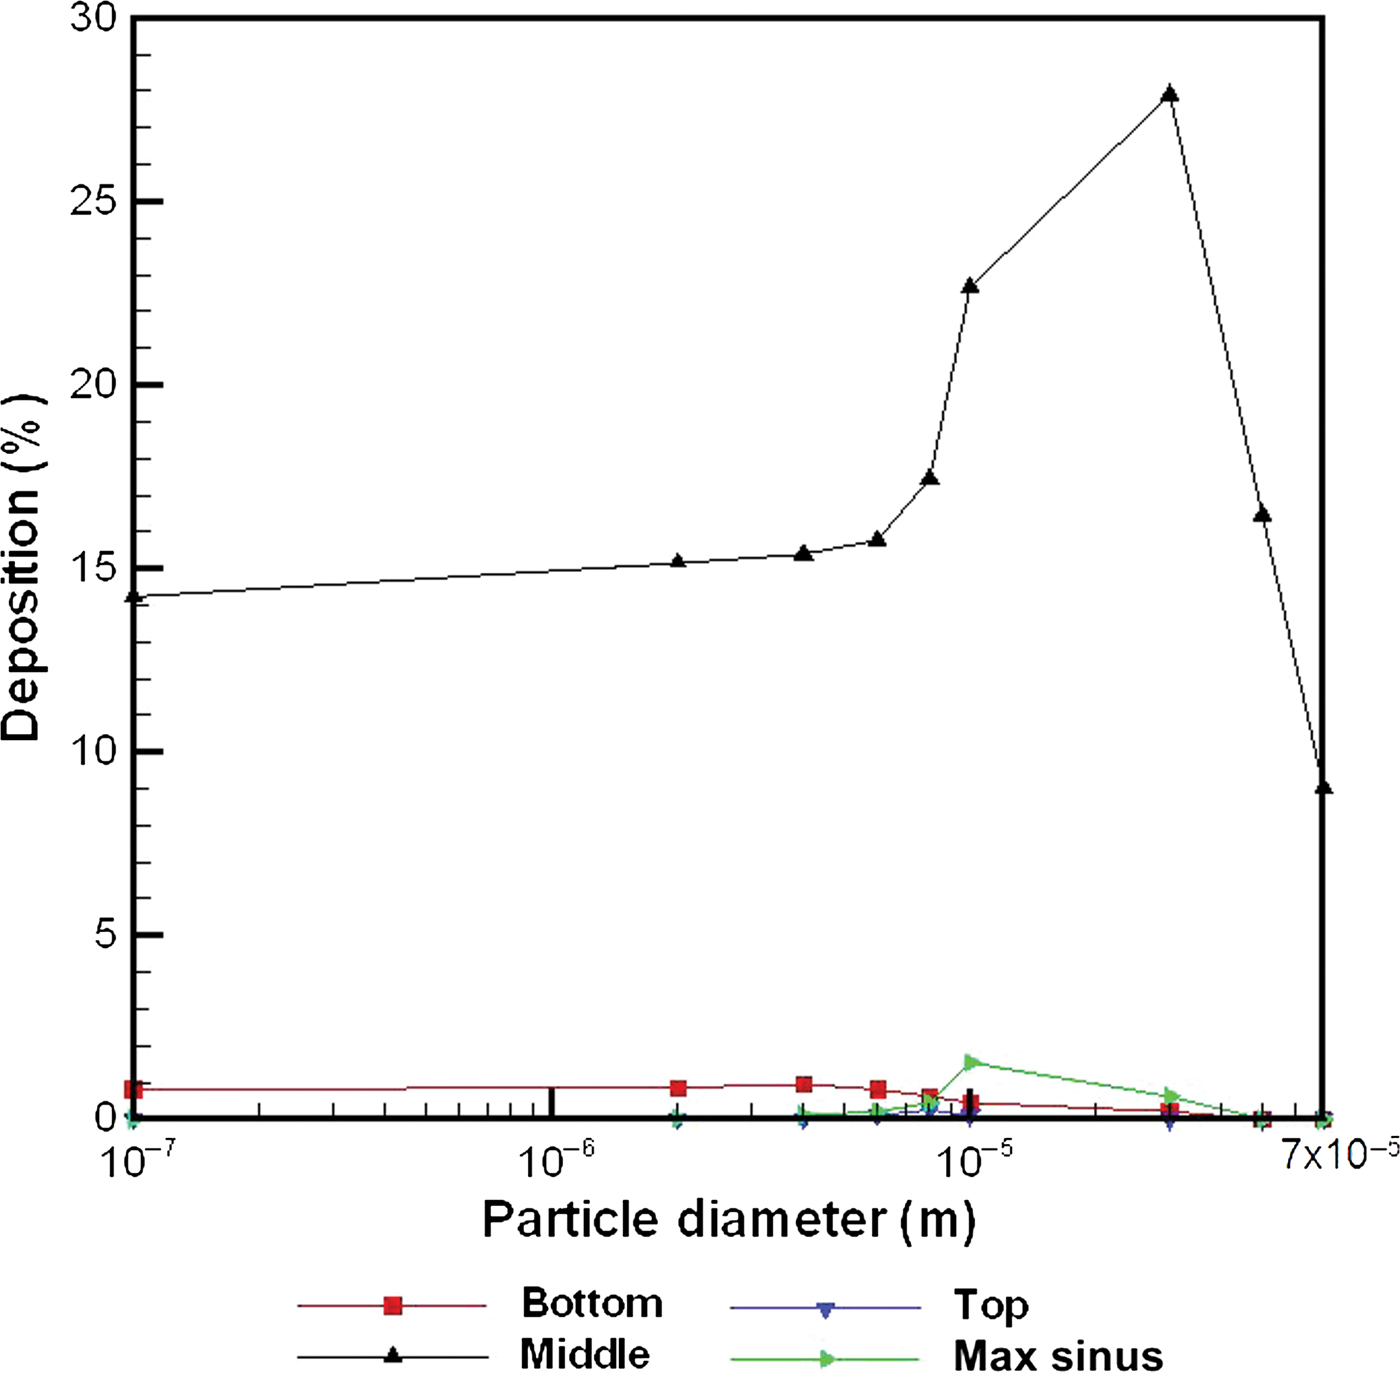
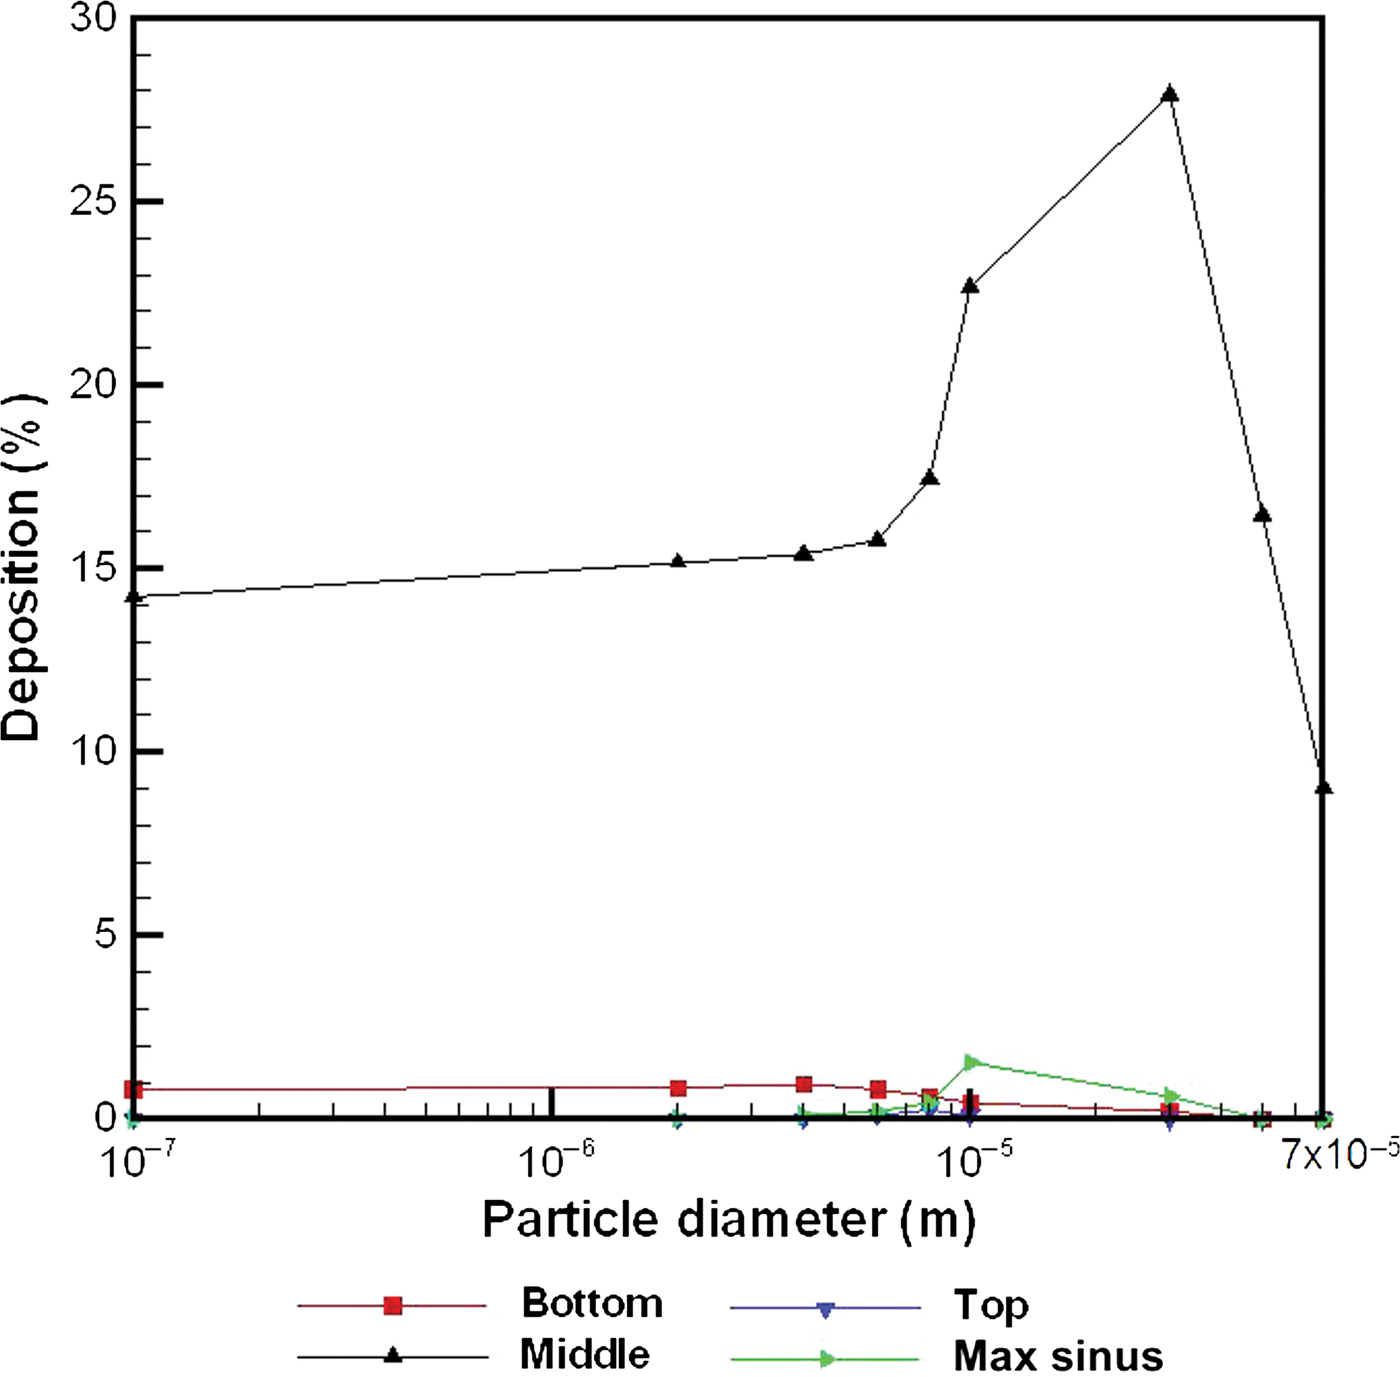
Similar to Figure 6b, Figure 7 shows that, in the middle subsection of section five, changes in particle diameter resulted in significant changes in deposition ratio. For particles 3 to 7 × 10⁻⁵ m in diameter, deposition increased as particle diameter decreased, whereas for particles smaller than 3 × 10⁻⁵ m in diameter deposition decreased as particle diameter decreased. Similarly, in the maxillary sinus region particles of approximately 10−5 m in diameter had the greatest deposition ratio. In contrast, in the bottom subsection of section five the optimal diameter was approximately 3 × 10⁻⁶ m. However, in the top subsection of section five the effect of particle diameter on deposition was not noticeable.
Particle deposition in the section five (top, middle and bottom subsections) and maxillary sinus regions of the right nasal cavity for different particle diameters. Initial particle velocity = 1 m/s, spray insertion angle = 55°, cone angle = 79°, nose flow rate = 18.8 l/min, back and right side head tilt angles = 0. Max = maxillary.
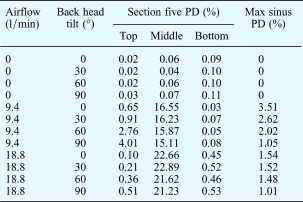
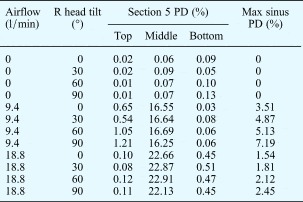
Tables I and II show that, in the absence of airflow (i.e. flow of 0 l/min), different back and right side head tilt angles produced only slight differences in deposition in section five of the right nasal cavity. The presence of inspiratory airflow aided particle deposition in the section five region, with greatest deposition occurring with a moderate airflow rate (e.g. 9.4 l/min). The optimum airflow rate differed between the section five and maxillary sinus regions, and also between the top, middle and bottom subsections of section five.
Particle deposition in right nasal cavity section 5 and maxillary sinus, by airflow and back head tilt angle

Initial particle velocity = 1 m/second, particle diameter = 10 µm, spray insertion angle = 55°, cone angle = 79°, right side head tilt angle = 0°. PD = particle deposition; max = maxillary
Particle deposition in right nasal cavity section 5 and maxillary sinus, by airflow and right head tilt angle

Initial particle velocity = 1 m/second, particle diameter = 10 µm, spray insertion angle = 55°, cone angle = 79°, back head tilt angle = 0°. R = right side; PD = particle deposition; max = maxillary
Table I also shows that changes in back head tilt angle helped enhance particle deposition in the top subsection of section five, but did so more effectively with a lower airflow rate (at 9.4 l/min, a change in back head tilt angle from 0 to 90° increased the deposition ratio from 0.65 to 4.01 per cent, an approximately six-fold increase). Table II shows that changes in right side head tilt angle helped enhance particle deposition in the right maxillary sinus region. Such changes were much more effective with a lower airflow rate (at 9.4 l/min, a change in right side head tilt angle from 0 to 90° increased the deposition ratio from 3.51 to 7.19 per cent, an increase of more than 100 per cent); furthermore, these changes enabled a greater increase in particle deposition than did changes in particle diameter (which increased deposition from 0 to 1.54 per cent; see Figure 7).
Discussion
Following FESS for chronic sinusitis, corticosteroids are administered intranasally with the intention of delivering the drug particles into the paranasal sinuses.Reference Vaughan and Carvalho3, Reference Hyo, Takano and Hyo4, Reference Moss and King24 However, there are few reported studies of how the physical properties of intranasal medication particles affect local deposition in the FESS region.Reference Hilton, Wiedmann, Martin, Humphrey, Schleiffarth and Rimell5
Those authors who have reported deposition simulations in healthy nasal cavities have not included (or considered) the maxillary, ethmoid or sphenoid sinuses in their models.Reference Kimbell, Segal, Asgharian, Wong, Schroeter and Southall10–Reference Shanley, Zamankhan, Ahmadi, Hopke and Cheng16 This was due to the fact that there is negligible local airflow into these cavities. In these studies, particle deposition within the main nasal cavity was uniform and regular; deposition in this site is relatively easy to measure and describe using computational fluid dynamic tools.
In contrast, the post-FESS nasal cavity induces airflow into these sinus cavities due to enlarged sinus ostia and the absence of upper air cells and tissue (Figure 1). This increases the complexity of internal airflow patterns (with altered airflow circulation and the development of vortexes with changes in breathing state),Reference Chen, Lee, Chong, Wang, Lim and Goh23 and thus affects local particle deposition.
We believe that the current model is the first reported attempt to investigate such abnormal particle deposition around the FESS site and within the sinus cavities, from a numerical viewpoint. The main objective of the current model was to characterise the effect of different particle properties and inspiratory factors on the local particle deposition at the FESS site and sinus cavities, and thus to enable optimisation of particle delivery.
Although the current model was based on a single human individual and thus may not be representative, our results still provide qualitative and quantitative information assisting the correct use of intranasal medication in patients undergoing FESS. We believe our findings will help improve the clinical efficacy of drug particle delivery, especially into the sinus regions. However, in order to make these results more relevant to the general population, similar studies are needed involving a number of post-FESS individuals with varying anatomy.
The current findings indicate that the optimal particle diameter for intranasal medication targeting the maxillary sinus region is approximately 10−5 m (see Figure 7). Hwang et al. Reference Hwang, Woo and Fong25 found that, for both normal and post-surgical nasal cavities, particles ranging from 0.9 to 1.1 × 10⁻⁵ m in diameter had superior deposition behaviour in the sinus regions. Hilton et al. Reference Hilton, Wiedmann, Martin, Humphrey, Schleiffarth and Rimell5 theoretically predicted that the best diameter range would be 0.3 to 1.0 × 10⁻⁵ m. The current predicted optimal diameter was within the above two groups' reported ranges. Hilton et al. Reference Hilton, Wiedmann, Martin, Humphrey, Schleiffarth and Rimell5 also reported that, in the maxillary sinus, improved particle deposition was obtained with smaller diameter particles. These authors used a nasal cavity model with FESS interventions to study the delivery of nebulised antibiotics. However, due to experimental restrictions, they reported an optimum mean diameter ranging from 0.67 to 0.99 × 10⁻⁶ m; in one additional case, the optimum diameter was 6 × 10⁻⁶ m. We compared the deposition results of these two group studies,Reference Hilton, Wiedmann, Martin, Humphrey, Schleiffarth and Rimell5,Reference Hwang, Woo and Fong25 bearing in mind the fact that they may not have been thorough and complete surveys. In contrast, our computational fluid dynamics model enabled a numerical, quick, straightforward approach to investigating particle deposition in the sinus regions, for a wider range of particle diameters.
• This study assessed drug particle deposition in normal and post functional endoscopic sinus surgery (FESS) nasal cavities, using a computational fluid dynamics model
• Airflow changes caused differing particle deposition in the two cavities, including sinus cavity deposition
• Particle deposition in the post-FESS maxillary sinus was greatest at low inspiratory airflow and low initial particle velocity
• Optimal particle diameter for local deposition was approximately 10−5 m for the maxillary sinus and 3 × 10⁻⁶ m for the base wall of the FESS section
It should be noted that the current nasal cavity model incorporated FESS involving removal of the uncinate process. The preservation or removal of the uncinate process remains a controversial topic for FESS surgeons.Reference Nayak and Balakrishnan26 Following FESS procedures, post-operative infection most commonly involves non-colonising bacteria.Reference Bhattacharyya, Gopal and Lee27 It has been proposed that the uncinate process may play a protective role, preventing deposition of bacteria and allergens. This theory may be supported by the current results, i.e. increased particle deposition in the sinus regions, which was more obvious with a lower inspiratory airflow rate.
Although not included in the current model, higher rates of maxillary sinus cilia motion may aid particle deposition, and may also affect local bacterial infection after FESS.Reference Bhattacharyya28
The current findings also suggest that, in the sinus regions, the particle deposition ratio was larger when airflow was present rather than absent. A moderate airflow rate was optimal (see Tables I and II), which is consistent with findings for the healthy nasal cavity.Reference Chen, Lee, Chong and Wang22, Reference Schroeter, Kimbell and Asgharian29
Following FESS, patients who self-administer intranasal medication to treat chronic sinusitis should be advised to maintain a moderate airflow rate, and may also be best advised to change their head tilt angle, in order to maximise deposition of medication onto the walls of the maxillary, upper ethmoid and sphenoid sinuses. In order to maximise medication deposition on specific areas of the nasal cavity wall, the optimal head position and airflow rate should be used, and the medication particles should be of optimal diameter; however, these parameters will vary depending on individual nasal anatomy.
Conclusion
This computational study provides qualitative and quantitative information aiding optimisation of intranasal medication delivery for patients who have undergone FESS procedures. Findings include particle deposition distributions along the lateral walls of both nasal cavities, one of which had previously undergone FESS, for particles with diameters between 10−7 and 7 × 10⁻⁵ m, and for a variety of inspiratory airflow rates and initial particle velocities.
Patients who self-administer intranasal medication following a FESS procedure should use a moderate inspiratory airflow rate, and the medication particle diameter should ideally be approximately 10−5 m, in order to improve particle deposition into the maxillary sinus cavity around the FESS region. Although changes in head position significantly alter particle deposition, this is not clinically relevant as the best deposition ratio thus produced is still below 10 per cent.
Acknowledgement
The authors would like to acknowledge the financial support of an Academic Research Grant (T208A3103) from the Ministry of Education, Singapore.