1 Background
Cross-country variations in the prices of prescription medicines have attracted considerable interest in recent years, both in the policy and the peer review literature. Recent empirical evidence suggests that significant pharmaceutical price differences exist between the United States and other countries (Congressional Budget Office (CBO), 2005, 2008), and that prices of patented prescription medicines are higher in the United States than in Canada or Europe. A study researching this became available in 1998 by the Committee on Government Reform and Oversight of the US House of Representatives as a minority staff report, reporting that drug prices in the United States were 72% higher than in Canada and 102% higher than in Mexico. Two earlier studies by the US General Accounting Office (GAO) using data from 1992 concluded that US prices were 32% higher than prices in Canada and 60% higher than the prices in the United Kingdom (GAO, 1995, 1996). In the United Kingdom, the Department of Health submits regular reports to Parliament, which, among other things, provide a comparison of UK prices with those in other OECD countries, as part of the Pharmaceutical Price Regulation Scheme (PPRS); in the 2009 PPRS report to Parliament, it was shown that US prices are 93% higher than German prices and 112% higher than UK prices in 2008 at constant exchange rates (Department of Health, 2009).
Further empirical evidence from the peer review literature points at methodological issues of cross-national price comparisons and confirms price differences across countries (Department of Health, 1997; Danzon and Chao, 2000a; Danzon and Towse, Reference Danzon and Towse2003; Danzon and Furukawa, Reference Danzon and Furukawa2003, Reference Danzon and Furukawa2008). Research has examined factors such as price controls and patent policy affecting launch dates of new pharmaceuticals among developed countries (Desiraju et al., Reference Desiraju, Nair and Chintagunta2004; Kyle, 2007; Danzon et al., Reference Danzon, Wang and Wang2005; Danzon and Furukawa, Reference Danzon and Furukawa2008) and developing countries (Lanjouw, Reference Lanjouw2005).
The evidence on whether US prices are higher than prices outside the United States is, nevertheless, conflicting at times and is dependent on the mix of products used, the methods applied to compare their prices and the time period chosen. Danzon and Furukawa (Reference Danzon and Furukawa2008), for instance, show that European countries’ prices were 6–33% lower than US prices, whereas the CBO, in a recent study, showed that prices of pharmaceutical products could be lower in the United States than in major European countries (CBO, 2005); this latter finding was also supported by Kanavos et al. (Reference Kanavos, Costa-Font and McGuire2007). Roughead et al. (Reference Roughead, Lopert and Sansom2007) found that Australian prices for medicines that represent significant clinical advances were similar to those paid under key US programs, despite fundamental differences in the two countries’ policy contexts, a finding which is also confirmed by an earlier study (Australian Productivity Commission, 2001). In the United Kingdom, the 2009 PPRS report to Parliament highlighted that although the 2008 weighted index of UK prices was significantly below than those in the United States, this difference may have been exacerbated by exchange rate movements over time (Department of Health, 2009). Danzon and Chao (Reference Danzon and Chao2000a), however, suggest that certain studies comparing prices among the United States and other countries may be biased by unrepresentative samples and unweighted indexes and use Laspeyres price indices to compare cross-country wholesale pharmaceutical prices.
The entire discussion about price levels in the United States vs Europe and Canada has triggered intense debate about whether American patients might benefit from lower prices for prescription medicines and whether products should be subject to re-importation instead, thus by-passing the higher prices of locally sourced products. One corollary of these empirical studies is that the United States could be paying a disproportionately high share of global pharmaceutical R&D (McClellan, Reference McClellan2003), although this has been challenged elsewhere (Light and Lexchin, Reference Light and Lexchin2005; Light, Reference Light2009).
The above raise questions about the factors that contribute to or determine cross-country pharmaceutical price variability. Although a considerable body of empirical literature exists on cross-national differences in the prices of prescription medicines, and a stream of literature has emerged in the past few years on the factors that determine prices in individual countries, little evidence exists on the determinants of pharmaceutical prices across different regulatory settings. In addition, the literature does not fully explore the effect that factors such as competition pre- and post-patent expiry, the type of price regulation, the age of product and the type of cross-country price differences put together might have on cross-country price differences in prescription medicines.
The objective of this paper is to investigate the determinants of originator branded prescription medicine prices across different regulatory settings and health care systems, taking into account their launch date, patent status, market dynamics and the regulatory context in which they diffuse. In particular, this paper analyzes price levels for a basket of prescription medicines and their differences in 15 OECD countries (United States, Japan, France, Germany, Italy, Spain, United Kingdom, Australia, Mexico, Austria, Portugal, Sweden, Greece, Slovakia and Belgium), the impact of distribution margins and generic entry on public prices and to what extent innovation, by means of introducing newer classes of medicines, contributes to price formation across countries. In doing so, this paper seeks to understand the factors that contribute to the existing differences in prices across countries, whether at an ex-factory or a retail level.
The paper contributes to the debate on cross-national differences in the prices of prescription medicines and their determinants in a number of ways: first, methodologically, individual country volume-weighted price indices are used to compare the prices of the basket of products across countries. Second, the analysis focuses only on originator prescription medicines (both patent-protected and patent-expired), thus recognizing that the dynamics of price determinants are different when generic medicines enter the market place; third, it provides a holistic approach to the determinants of prices, including competition pre- and post-patent, the impact of supply-side regulation, product age, exchange rate variability and sales attrition due to switch to other products. Fourth, the analysis is conducted over time rather than at a single point in time, thus allowing for dynamics. Finally, the basis of analysis is public prices of branded prescription medicines, which are paid for by health insurers, rather than list prices, which are often artificial prices.
Section 2 discusses the conceptual framework in which this analysis takes place. Section 3 outlines the data and methods employed in the analysis. Following that, section 4 presents the results of the analysis, whereas section 5 discusses the key trends that are emerging. Finally, section 6 draws the main conclusions.
2 Conceptual framework
The factors that influence pricing and the prices of prescription medicines are complex and have been investigated within the context of both pre-patent and post-patent expiry. Economic theory suggests that in regular markets, increasing entry and the resulting competition or the threat of entry may lead to lower prices. An important corollary is that when a second player enters a monopoly market, prices will drop. This is not necessarily the case in pharmaceutical markets. Factors influencing the nature of competition in pharmaceutical markets include the effect of patent protection, patent expiry, advertising, purchasing by third-party payers and price or volume regulation.
An important potential determinant of pricing and of prices of prescription medicines relates to market developments post-patent expiry. Empirical evidence from the United States suggests that generic entry leads to higher originator prices and that a necessary condition for such price increases is that generic entry leads to a decline in the own-price elasticity of reduced-form brand-name demand (Frank and Salkever, Reference Frank and Salkever1997), a phenomenon known as the ‘generics paradox’. Further empirical evidence from the United States suggests that innovator firms do not attempt to deter generic entry through their pricing strategies and this may lead to a significant reduction in market share of the originator drug post generic entry (Grabowski and Vernon, Reference Grabowski and Vernon1986, Reference Grabowski and Vernon1996; CBO, 1998); empirical evidence from Canada shows similar results (Lexchin, Reference Lexchin2004). Rather, innovator firms have continued to increase their prices at the same rate as before generic entry. Rizzo and Zeckhauser (Reference Rizzo and Zeckhauser2005) found that originator brand prices do not decrease prices after generic entry, whereas Caves et al. (Reference Caves, Whinston and Hurwitz1991) concluded that generic entry only leads to a slowdown in the increase of originator drug prices. Danzon and Chao (Reference Danzon and Chao2000a) showed that generic competition would lower prices in less-regulated regimes, whereas Kanavos et al. (Reference Kanavos, Costa-Font and Seeley2008) suggested that regulation in pharmaceutical markets would result in prices of generic medicines not declining fast enough.
Advertising and advertising intensity also influence the choice of pharmaceutical products in an environment of product differentiation pre-patent expiry, where products are considered to be broadly comparable at the therapeutic class level, or substitutes. Empirical evidence suggests that advertising, by means of detailing, has a powerful effect and systematically lowers price sensitivity because it increases brand loyalty, in addition to the effect of increasing a product's sales (Rizzo, Reference Rizzo1999; Berndt et al., Reference Berndt, Danzon and Kruse2007), as well as having spillover effects, such that advertising by one firm in a therapeutic category increases demand for other drugs in the same category (Berndt et al., Reference Berndt, Bui, Reiley and Urban1995).
A further important aspect that affects pharmaceutical prices is regulation of pharmaceutical markets. Recent studies have emphasized the importance of pharmaceutical regulation whether on the supply or the demand side (Kanavos and Costa-Font, Reference Kanavos and Costa-Font2005; Kanavos et al., Reference Kanavos, Costa-Font and Seeley2008). Regulation includes interventions on price through a variety of administrative measures, including the imposition of price ceilings, the adoption of price cuts, as well as methods such as cost-plus pricing, external price referencing and cost-effectiveness pricing. Assessing the relative costs and benefits of new medicines in relation to existing alternatives has been increasing in influence in recent years as part of enabling policy-makers to reach informed decisions on the value of a new product and, through that on its price, based on clinical and cost evidence (Sorenson et al., Reference Sorenson, Drummond and Kanavos2008; Kanavos et al., Reference Kanavos, Manning, Taylor, Schurer and Checchi2010, Reference Kanavos, Nicod, Espin, van den Aardweg and Pomedli2011a). Similarly, the uptake and use of external price referencing has increased considerably over the past two decades as a means of restricting prices in a particular country to those selected from other countries (Espin et al., Reference Espin, Rovira and Olry de Labry2010).
Some studies suggest that countries with strict price regulation of originator, in-patent pharmaceuticals have lower prices than countries with less strict regulation (Jönsson, Reference Jönsson1994). Yet, it is not always clear what the effect of regulated or unregulated prices is on the overall cost of pharmaceutical products, as volume must be accounted for. Recent findings indicate that the use of price controls, including external price referencing, has a statistically and quantitatively important effect on the extent and timing of the launch of new drugs and that price regulation in one country affects entry into other countries, and may affect the strategies of domestic firms (Kyle, Reference Kyle2007). In addition, imposing price ceilings in regulated markets may even lower the price in unregulated markets (Mujumdar and Pal, Reference Mujumdar and Pal2005).
Internal reference pricing, one form of reimbursement regulation affecting predominantly products or therapeutic classes characterized by patent expiries, has attracted considerable attention in the last 15 years (Aaserud et al., Reference Aaserud, Dahlgren, Kösters, Oxman, Ramsay and Sturm2009); in the Swedish context it has been shown to lead to a decrease in the market shares of particular originator products, suggesting higher levels of competition (Aronsson et al., Reference Aronsson, Bergman and Rudholm2001). Grootendorst and Stewart (Reference Grootendorst and Stewart2006) drawing upon evidence from British Columbia found that the daily cost of drugs declined following the introduction of reference pricing, but part of this reduction could be attributed to factors other than reference pricing.
Some studies have concluded that competition has kept prices low in markets with less regulation, particularly in markets with patent-expired drugs. At least three studies provide empirical evidence that generic competition is more effective in such countries (Danzon and Chao, Reference Danzon and Chao2000a; Magazzini et al., Reference Magazzini, Pammolli and Riccaboni2004; Kanavos et al., Reference Kanavos, Costa-Font and Seeley2008). Nevertheless, Danzon and Chao (Reference Danzon and Chao2000a) state that comparing prices of pharmaceutical products across countries gives uncertain results due to the differences in products, prices and volumes. On the basis of empirical evidence from Norway, the introduction of a price index that aimed in lowering entry barriers actually helped increase the market shares of generics and helped trigger price competition by reducing overall market power (Dalen et al., Reference Dalen, Strom and Haabeth2006). This policy measure may offer consumers the alternative of cheaper generics and, therefore, help reduce spending. At times, the presence of regulation, for instance, in the form of a price index used in price setting, may indeed skew the market, leading to different effects than what would happen in the absence of regulation.
Age, measured from the point of launching a new prescription medicine,Footnote 1 is also an important determinant of its price and may capture two effects; the first relates to the innovative potential of the new medicine in relation to existing therapeutic alternatives, such that if new medicines or classes of medicines display improvements in their clinical profile compared with existing ones, they will be priced at a price premium compared with those alternatives. Some regulatory authorities have mechanisms whereby the innovative potential of new medicines is captured (ÖBIG, 2007). It would be reasonable to assume that innovation leads to higher prices. However, Berndt et al. (Reference Berndt, Griliches and Rosett1992) found no evidence that product age had any impact on price indexes, but Danzon and Chao (Reference Danzon and Chao2000b) found a steeper decline of price with drug age in regulated markets. The second effect is the product life-cycle effect and postulates that drug sales follow a life-cycle pattern, increasing during a drug's initial years on the market, peaking and, eventually, declining; some evidence of that exists in the literature and concerns the anti-hypertensive market (Rizzo, Reference Rizzo1999), but is unknown whether it can be applied across the entire pharmaceutical market.
On the basis of the existing literature and in order to study the determinants of originator branded prescription medicines, we consider a price determination function that aims to explain prices across different settings. In particular, originator brand prices are set by profit-maximizing firms, taking the effects of competition, both pre- and post-patent expiry, regulation and the environment they sell in into consideration. This price determination function is depicted in equation (1):

where price, P, is a function of the product's age, A, the life-cycle effects, L, the nature of competition, whether pre- or post-patent, C, the overall cross-country differences, S, and the nature of regulation and its intensity in individual markets, R.
3 Data and methods
3.1 Data
Pricing (both at an ex-factory and a retail level) and sales data for the 50 leading originator branded prescription-only products by their worldwide sales and for each of 2004 and 2007 were used in this analysis, that is, a total of 100 branded products for the two years. The price data for these products were collected from national official sources, whereas sales were acquired from Intercontinental Medical Statistics (IMS). This paper included 15 OECD countries, notably the United States, Japan, France, Germany, Italy, Spain, United Kingdom, Australia, Mexico, Austria, Portugal, Sweden, Greece, Slovakia and Belgium.
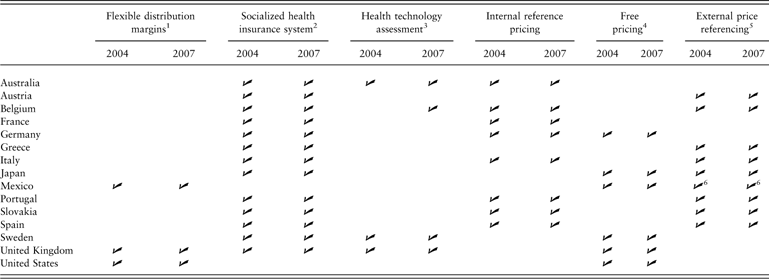
The study countries were selected, first, on the basis of the size of their pharmaceutical market, ensuring a balance between large markets and smaller markets. The 10 largest markets included in the study sample accounted for 80% of global prescription drug sales. A second criterion was geographical location (Europe, North America, Japan and Australia), whereas a third criterion was the variety of regulatory regimes for prescription medicines reflecting different priorities in supply-side policies; the sample includes countries carrying out value assessments and negotiating pharmaceutical prices (e.g. France, Sweden, Belgium, Australia, Italy and Japan), countries where pricing is by and large free (United States and Germany), countries having value assessments combined with rate of return regulation (United Kingdom), or countries with minimal intervention (Mexico) and countries that pursue an administrative control of pharmaceutical prices (Greece, Spain, Portugal, Slovakia and Austria). A summary of key policies affecting prices of originator pharmaceuticals in the study countries is provided in Table 1.
Key features of National Drug Policies, 2004 and 2007
1The other study countries have regulated distribution margins.
2As a means of coverage for the majority of the population.
3Explicitly used in the decision-making process.
4For new products; in the United Kingdom, although there is a rate of return regulation, pricing of medicines is in principle free.
5Applies in the majority of countries, mostly by defining a basket of countries taken as reference; usually, the average or the lowest of the basket are taken to be the benchmark price in the country in question. Frequencies of update differ, but they are usually annual (Austria, Belgium, Greece, Mexico and Portugal), or occur only at launch (Italy, Spain, France and Slovakia). In France, Italy and Japan prices from the reference countries are used indirectly to inform the pricing process, whereas in all other countries they are used explicitly. European Union (EU) countries’ basket typically includes other EU countries; Mexico's basket comprises six countries where the product in question enjoys the highest sales penetration. In Japan, the basket of countries includes the United States, the United Kingdom, Germany and France.
6Owing to the way the system operates in Mexico, it is a combination of free pricing with international price comparisons with validation from countries that have the highest penetration for the product under consideration.
Source: The authors.
The selected sample of 100 products (50 products each for 2004 and 2007) comprised a total of 68 unique molecules for both 2004 and 2007; 32 of these molecules were common for 2004 and 2007, whereas 18 molecules were unique for 2004 and a further 18 were unique for 2007. These 68 molecules were drawn from across 19 therapeutic categories. On the basis of their three-digit Anatomical Therapeutic Chemical (ATC) classification (three-digit), the 13 key therapeutic classes were (a) proton pump inhibitors grouped with ranitidine (five molecules); (b) statins (four molecules); (c) calcium antagonists and metoprolol (four molecules); (d) Angiotensin Converting Enzyme (ACE) inhibitors (one molecule); (e) sartans (three molecules); (f) opioids (two molecules); (g) anti-epileptics (three molecules); (h) atypical anti-psychotics (five molecules); (i) Alzheimer's (two molecules); (j) anti-depressants (four molecules); (k) biguanides (three molecules); (l) anti-bacterials for systemic use (five molecules); (m) drugs for obstructive airway diseases (five molecules); and (n) molecules from other therapeutic categories (22 molecules). The 13 leading therapeutic categories in the sample accounted for 67.65% of the molecules and over 78.81% of sales (measured in public prices) in 2007.
These inclusion criteria resulted in more than 50% coverage of the total pharmaceutical market in the study countries. The study countries also accounted for over 82% of the worldwide pharmaceutical market according to IMS.
Several of the originator brands in both 2004 and 2007 had already faced patent expirations and generic entry. In particular, 28 brands in 2004 and 32 brands in 2007 were off-patent in the United States, United Kingdom, Germany, France, Italy and Spain. Of the 22 brands that were patent protected in 2004, 13 were also patent protected in 2007. Although a number of the originator brands in the sample were patent-expired, the objective of this paper was not to study the prices or the price evolution of generics.
In order to ensure direct product comparability across countries, the most selling pack for each originator brand was identified and formed the basis for the calculation of an ex-factory and retail price indices. Due consideration was exercised so that the dosage was common for each product across the sample of countries. On average, the most selling pack represented 49% of the total brand sales in the study countries and in some cases it exceeded 80% of total brand sales. A price index approach was used to arrive at a country-specific composite price for the selected product basket.
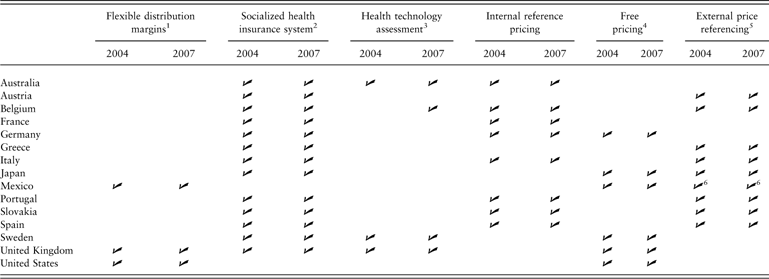
Both ex-factory and retail prices were used to study the retail segment, specifically only products dispensed in the outpatient market. Product price data were obtained from national official sources (see Table A1 in the Appendix), whereas sales data for each corresponding product were obtained from IMS. Prices were taken for the first quarter of 2004 and the first quarter of 2007. Prices were adjusted for defined daily dose (DDD), as defined by the World Health Organization (2008). Prices studied reflect the products’ dispensing cost, regardless of whether health insurance covers the entire cost, or the patient has to pay a co-payment.
The retail prices in this paper reflect prices actually paid by health insurers, although it is not possible to capture any rebates given to public insurance bodies on an ex-post basis. As we are studying originator brand prices only, it is thought that the effect of such rebates on prices is small and that where they exist they affect generic products predominantly (Kanavos et al., Reference Kanavos, Seeley and Vandoros2009). In the United States, prices from the Federal Supply Schedule (FSS) are used. FSS is a multiple award, multi-year federal contract that is available for use by any Federal Government agency and satisfies all Federal contract laws and regulations. Pricing is negotiated based on how vendors do business with their commercial customers and, therefore, reflects discounting practices elsewhere in the system. FSS prices do not capture the uninsured, who pay considerably higher prices.
3.2 The empirical model
In order to empirically test the impact of different variables on the prices of prescription drugs we built an econometric model and applied panel data analysis. The panel ID was therefore the molecule and the time variable was the year (one observation in 2004 and one in 2007). On the basis of equation (1), the estimated models are in equations (2) and (3):


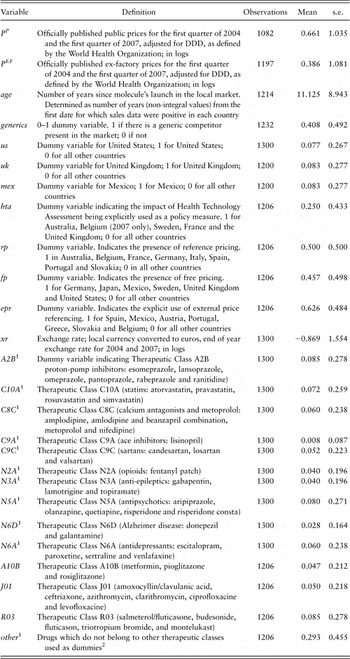
where i indicates the specific product in a specific country and t indicates time. P P is the log of the retail price and P EF is the log of the ex-factory price, adjusted for DDD. Both ex-factory and retail prices were expressed in euros by using the end-of-year exchange rate for 2004 and 2007, respectively. The use of exchange rates to convert prices in different currencies into a common currency is justified by the fact that they reflect price movements across traded goods, including pharmaceuticals, compared with purchasing power parities (PPPs), which are better suited to account for cross-country differences of non-tradables, such as health care services (Kanavos and Mossialos, Reference Kanavos and Mossialos1999). age is the number of years since the product's launch in a local market. It is determined as the number of years (non-integral values) since the launch of each brand in each of the study countries. agesq is the square of the age term and is included to allow for the possibility that sales will eventually decline with the number of years on the market, due to switch to other products. In doing so, it has been hypothesized that drug sales would follow a life-cycle pattern. generics is a 0–1 dummy variable which indicates the presence of generic competitors for the particular molecule or not and is benchmarked against patent expiry for each brand and for each of the study countries. Positive sales of a generic product indicate generic presence. This will show the effect of generic entry and presence on originator prices. us, uk and mex are country dummy variables for the United States, the United Kingdom and Mexico, respectively, which are included to account for potential differences in prices in these countries compared with the other study countries arising from differences in (a) the way prescription medicines are priced (free pricing in the United States, free pricing subject to rate of return regulation in the United Kingdom and free pricing subject to validation from countries with the highest product penetration in MexicoFootnote 2) and (b) distribution systems, whereby distribution arrangements in most countries remunarate wholesalers and pharmacists on the basis of fixed negotiated margins, except for the United States, the United Kingdom and Mexico, where flexible margin policies exist. xr is a control variable capturing the effect of exchange rate movements. As prices are expressed in euros, xr is used to control for changes in the exchange rates and captures price movements attributable to exchange rate movements and volatility rather than nominal changes in prices.
A number of regulatory dummy variables were also added to the model in order to determine the impact of regulation on prices. The impact of Health Technology Assessment (HTA) as a means of influencing prices is captured by the variable hta. HTA is explicitly used to inform pricing decisions in Australia, France, Belgium (only in 2007), Sweden and the United Kingdom. rp indicates the presence of internal reference pricing as a regulatory measure. This is present in Australia, Belgium, France, Germany, Italy, Spain, Portugal and Slovakia. fp indicates free pricing for pharmaceuticals, present in Germany, Japan, Sweden, the United Kingdom and the United States and indicates the absence of explicit regulatory intervention to set prices administratively. epr indicates the presence and explicit use of external price referencing in price setting in Spain, Austria, Portugal, Greece, Slovakia and Belgium. class indicates a dummy variable for each therapeutic class; the definition of therapeutic classes was based on diagnosis and the three-digit ATC classification. A definition and description of all variables is shown in Table 2.
Variable definition and summary statistics

DDD = defined daily dose.
1Based on the Anatomical Therapeutic Chemical (ATC) classification system.
2Ondansetron, clopidogrel, carvedilol, valsartan and hydrochlorothiazide combination, ezetimide and simvastatin combination, sildenafil, fluconazole, cyclosporin, diclofenac, rofecoxib, alendronic acid, sodium residronate, zolpidem, bupropion (zyban), cetirizine, fexofenadine, loratadine, ezetimibe, sumatriptan, valaciclovir and terbinafine.
Source: The authors.
In estimating equations (2) and (3), we have used random effects panel data analysis. The Hausman test suggests that it is preferable to follow the random effects approach because the χ 2 statistic is 0.49, indicating that the difference between the consistent fixed effects and the random effects estimator is statistically insignificant. The random effects approach assumes that the intercepts of the individual variables are different but that they can be treated as drawings from a distribution with mean μ and variance σα 2. The essential assumption here is that these drawings are independent of the explanatory variables (Verbeek, Reference Verbeek2005).
4 Results
4.1 Descriptive analysis: price comparisons across countries
An analysis of cross-country price differences reveals interesting results, which are summarized in Figures 1–5. A sub-sample of the study countries has been used to highlight the points raised in Figures 1–5, as all others usually follow pricing developments in the highlighted countries. In order to compare prices across countries, country-based (weighted) price indices have been created, both for ex-factory and for public prices, the latter reflecting prices paid for by health insurers. Clearly, weights vary across countries in order to reflect local market share patterns. The price index we have created takes into account product market shares in each country, but not absolute levels of consumption, as the latter would bias the results, leading to higher prices for countries with higher drug consumption. For this purpose, the weights used are volume-adjusted on a country-by-country basis; to that end, each drug's (volume-based) market share is taken into account in building a country's price index. For the calculations shown in Figures 1–5, the weighted average in the five largest European Union (EU) countries (United Kingdom, Germany, France, Italy and Spain), grouped together as ‘EU G5’ are taken as a base.
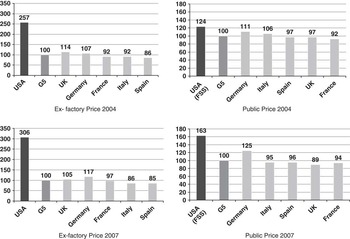
Price levels United States vs European Union (EU) countries United Kingdom, Germany, France, Italy and Spain (EU G5): ex-factory and public prices at current exchange rates, 2004 and 2007, price indices
FSS = federal supply schedule.
Note: For the United States, the wholesaler acquisition cost is taken into account.
Source: The authors.

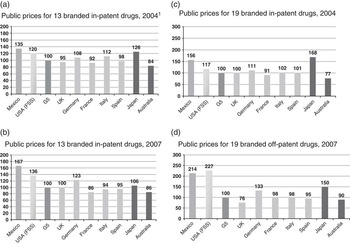
Public prices for branded in-patent and off-patent drugs at current exchange rates, 2004 and 2007, price indices
FSS = federal supply schedule.
Note: This figure shows price developments across the 32 drugs that are common for both 2004 and 2007. The 32 drugs considered in 2004 are all patent-protected. Of these 32, 19 had their patents expired in 2007, whereas the remaining 13 were still patent-protected. Therefore, panels a and b consider price developments of the 13 in-patent brands that retained their patents in both 2004 and 2007, whereas panels c and d show price developments in the 19 brands that lost their patent protection in 2007.
Source: The authors.

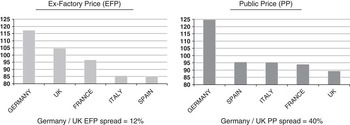
Public vs ex-factory prices: price levels in the G5 – prices for the top-selling 50 brands, 2007
Note: This figure considers the entire basket of branded products for 2007 (n = 50). EFP Index, G5 = 100; wholesale price = price that pharmaceutical companies charge directly to the local wholesalers (excl. VAT). PP Index, G5 = 100; retail price = pharmacy selling price (incl. VAT).
Source: The authors.

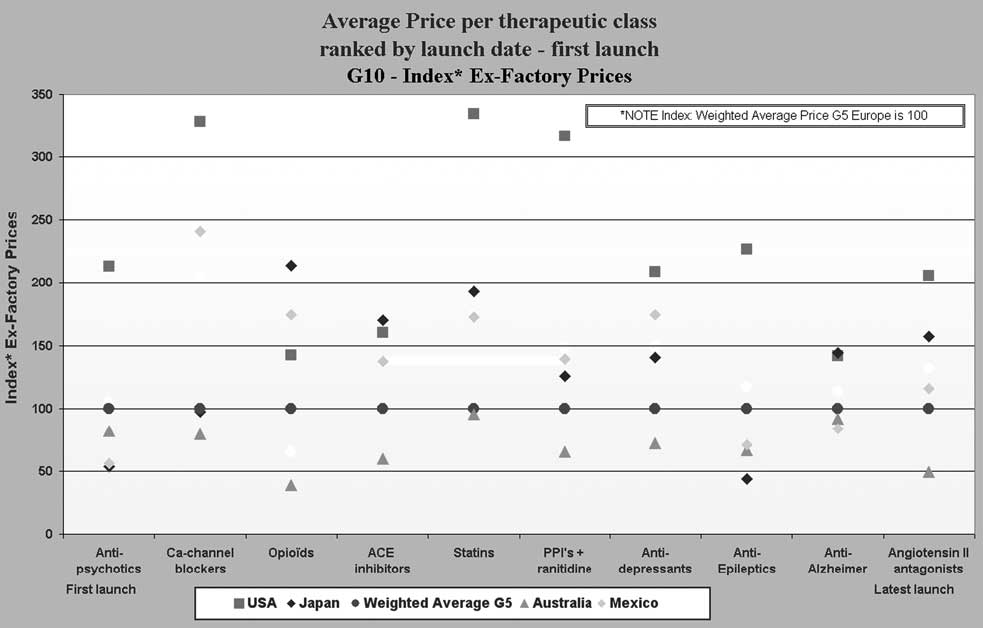
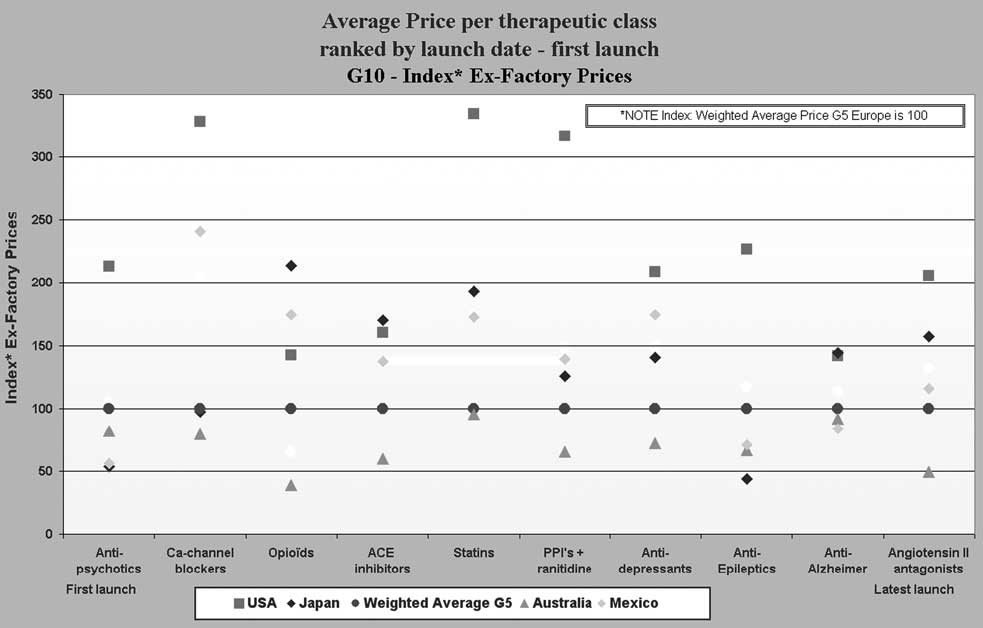
Therapeutic class (and class age) and international price differences; price spread across therapeutic classes by class age and first introduction, 2007
Note: Classes of products are listed from left to right taking into account each product's date of first introduction within each class.
Source: The authors.
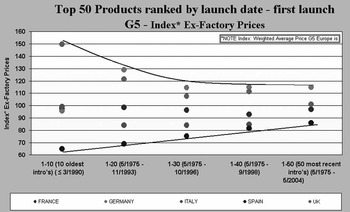
Relationship between product age and international price differences in European Union (EU) countries United Kingdom, Germany, France, Italy and Spain (EU G5), 2007 prices
Note: Classes of products are listed from left to right taking into account each product's date of first introduction within each class.
Source: The authors.

A comparison of ex-factory and public price levels between the United States and EU G5 between 2004 and 2007 suggests that ex-factory price differences appear to be very large between United States and Europe in both 2004 and 2007; public price differences, however, are significantly smaller (Figure 1). The difference in ex-factory prices between the United States and Europe is over 200% in 2007, whereas the same difference for public prices was 24% in 2004 and 63% in 2007 and is shown to be even smaller between the United States on the one side and the United Kingdom or Germany on the other. Price differences appear to have increased in 2007 compared with 2004.
An important aspect when comparing prices across countries is related to exchange rate variability. Exchange rate fluctuations may have a significant impact on ex-factory and public prices across countries. US ex-factory prices have increased by 19% compared with European prices between 2004 and 2007 for the sample basket. Exchange rate fluctuations have contributed to this difference by about a third (or 32%); US public prices, have risen faster (31%).
Between 2004 and 2007, US ex-factory prices have increased by 11% compared with European prices for 13 branded, in-patent products on the market; this rises to 22% if exchange rate changes are taken into account; US public prices for the same products have risen faster than G5 public prices (+14% or +26% taking into account exchange rate movements), but this is largely due to the depreciation of the US dollar compared with sterling or the euro. Ex-factory prices of brands whose patent has expired have risen faster in the United States than in Europe between 2004 and 2007 (+58% or +75% if exchange rate changes are considered); public prices have also risen faster in the United States than in EU G5 (+94% or 114% if exchange rate changes are considered).
Second, off-patent drugs are widely perceived as cost containment targets. Yet, the way the off-patent segment performs differs across countries. European countries typically regulate reimbursement; an important component of reimbursement policy is internal reference pricing (either at molecular or/and therapeutic class level), which, in addition to capturing competition and price decreases among generics, it can also lead to downward pressure of off-patent originator brands. This is not necessarily the case in the United States where generic competition can lead to a steep decline in generic prices, but can leave off-patent originator brands unaffected. This is captured in Figure 2, which highlights the price spread between the United States and some of the other study countries for both in-patent and off-patent drugs. Prices of in-patent brands increased in the United States by 13% compared with EU G5 between 2004 and 2007 (panels a and b). However, the spread is significantly higher in the case of originator brands whose patents expired in 2007 compared with 2004 (94% increase between 2004 and 2007) suggesting a divergence in policies between the United States and EU G5 or other countries (panels c and d). It also highlights the existence of the generics paradox in the United States namely that the prices of off-patent brands in the sample seem to be increasing in 2007 rather than decreasing, compared with 2004.
Third, it is important to stress that distribution margins and taxes are critical components of pharmaceutical expenditure and can generate a distortion when comparing prices internationally. In some countries the combined effect of VAT, wholesale and retail margins is significantly higher than in others, impacting the proportion of the retail price directed to manufacturers. Figure 3 helps highlight how distribution margins and VAT impact final (retail) prices in EU G5. The difference in ex-factory prices for the most selling 50 originator brand prices between Germany and the United Kingdom in 2007 was 12%. When comparing retail prices though, this difference increases to 40%. The findings are similar for Spain, France and Italy. UK retail prices are now lowest (compared with being the second highest at ex-factory level), as the impact of distribution margins and taxes has had a significant upward effect on retail prices in France Italy and Spain.
Fourth, age of the therapeutic class may help explain international price differences. Figure 4 shows the average price per therapeutic class ranked by launch date. Prices in 2007 are considered for EU G5, United States, Mexico, Japan and Australia, across 10 key therapeutic classes. There appears to be a significant positive correlation between the age of the therapeutic class and price differences. The longer the therapeutic class has been on the market, the greater are the price differences between highest and lowest prices. This figure shows that there are smaller price differences across countries for new drugs and that, overall, there appears to be some price convergence over time across major countries. In some price-regulated countries, this could partly be explained by the use of external price referencing as a method of pricing new medicines and the resulting launch sequencing strategies of manufacturers who launch products in unregulated or less-regulated markets first.
Fifth, age of a product appears to be an important determinant of drug price differences. New drugs coming into the market can be considered to be innovative. Clearly, not all new drugs are innovative and the link between ‘new drugs’ and ‘innovative drugs’ is not a linear one, but it is also the case that the perception of innovation varies across settings, particularly that of incremental innovation and this is often translated in the price premia of such innovations. Figure 5 examines ex-factory drug price differences across EU G5 countries in 2007. There appears to be a significant link between product age and price differences across countries. The more recent the market entry is, the smaller are the drug price differences across countries. For older drugs, prices differ significantly. In addition, the lowest prices appear to be rising for newer drugs and the highest prices seem to be decreasing for newer drugs, suggesting an overall price convergence.
4.2 Results of the econometric analysis
Four different specifications are estimated for each of the models shown in equations (2) and (3). In the first specification age, agesq, generics, xr and the country dummies are used as explanatory variables. The second specification also includes therapeutic class dummies. The third specification introduces all the regulatory dummies (hta, rp, fp and epr) but excludes class dummies, while the fourth specification includes all explanatory variables.
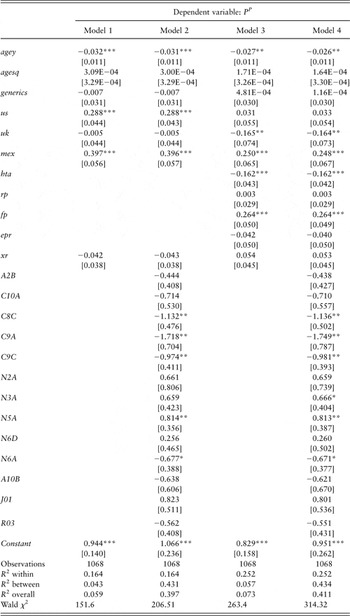
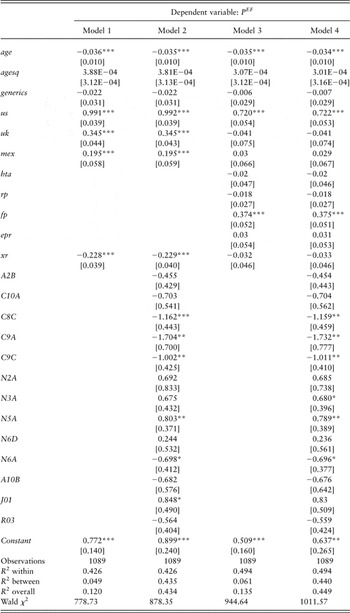
Results for the model in equation (2), outlining the determinants of public prices, can be found in Table 3. In the first specification, including only the effects of age, generic entry and exchange rates as well as country dummies, us, mex and xr have a positive and statistically significant coefficient at α = 1%. age has a negative and significant effect on prices, as expected. The coefficient of generics is statistically non-significant. When also including therapeutic class dummies as control variables (Model 2), results are very similar to Model 1. In the third specification, which introduces policy variables, age has again a negative effect on public prices (statistically significant at α = 1%). hta has a negative and significant coefficient: Countries that explicitly use HTA have on average lower prices by 16.2%, compared with those that do not use HTA. fp has a positive and significant coefficient: Countries which have free pricing have on average higher prices by 26.4% (statistically significant at α = 1%); this primarily reflects the situation in the United States and Germany. rp and epr are statistically not significant. The us dummy has a statistically non-significant coefficient in this model; it is very likely that the us and fp dummies interact in this case. mex has a positive and significant coefficient, while uk has a negative and significant coefficient, indicating that when controlling for other factors, Mexican public prices are on average higher than other countries in the sample, while UK public prices are lower on average. generics has a positive but statistically non-significant coefficient. This means that generic presence does not affect the price of the originator, a phenomenon studied before and known as the ‘generics paradox’ (Frank and Salkever, 1997). When including both policy and class dummies (Model 4), results are almost identical to those of Model 3.
Random effects panel data estimation

Robust standard errors in brackets.
*Significant at 10%; **significant at 5%; ***significant at 1%.
The results for a product's age and generic entry do not change across any of the four specifications of equation (2), which has public prices as a dependent variable, and are robust, as they do not change when model specifications change. What does change, however, is the coefficient for prices in the United States and the United Kingdom when controlling for regulation: us is positive and significant when excluding policy dummies, and remains positive but becomes non-significant when including them; this is probably the effect of interaction between us and fp. uk is negative and non-significant when excluding policy dummies and becomes negative and significant when including them.
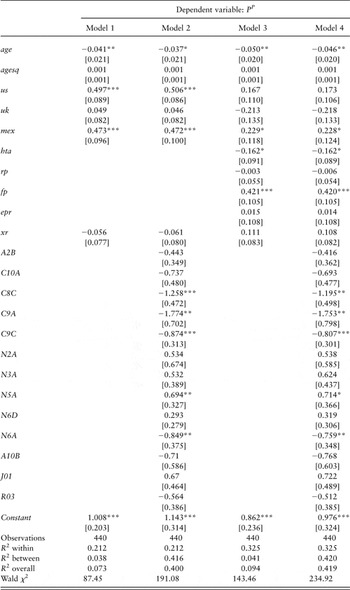
Results for equation (3), having ex-factory prices as a dependent variable, are shown in Table 4. Model 1 includes only age, generic entry, exchange rates and country dummies as explanatory variables. Age is negative and statistically significant and generics is non-significant. us, uk and mex are all positive and statistically significant, indicating that ex-factory prices in these countries are on average higher than in the other countries in the sample. US, UK and Mexican ex-factory prices are on average 99.1%, 34.5% and 19.5% higher than other countries. xr has a negative and statistically significant effect, which reflects the effect of different currencies and the impact of changes in the exchange rate on prices. This is also used to control for exchange rate fluctuations, as all prices have been converted to euros. When including class dummies (Model 2), results are the same as in Model 1. Policy dummies are introduced in Model 3, where age continues to have a negative and statistically significant effect. The effect of generic presence is not significant. The coefficient of us is 0.720 and positive and statistically significant, suggesting that US ex-factory prices are on average 72% higher than the other countries in the sample when controlling for the other variables included in the model. uk and mex are statistically non-significant. Of the four policy dummies, only fp has a significant effect, suggesting that countries with free pricing have higher ex-factory prices by 37.4% on average. xr continues to be negative but is non-significant in this model. Results do not change in Model 4 (which includes both policy and class dummies) compared with Model 3.
Random effects panel data estimation

Robust standard errors in brackets.
*Significant at 10%; **significant at 5%; ***significant at 1%.
As in the model depicted in equation (2), results for equation (3) appear to be robust across different specifications. Results suggest that newer classes of prescription medicines are more expensive than older classes based on their respective launch year. This is a finding that is present in all four specifications for both public and ex-factory prices. Prices in the United States appear to be higher than in other countries. The effect is not that obvious for public prices, where the difference can be non-significant and up to 28.8% when significant. The difference depends on the control variables included in the model. However, when it comes to ex-factory prices, US prices are between 72% and 99.2% higher, depending on the control variables included in the model. These results show that although there are significant price differences between the United States and other countries when considering ex-factory prices, these differences are much lower for public prices. Generic presence does not appear to significantly affect public prices of originator prescription medicines in any of the included model specifications.
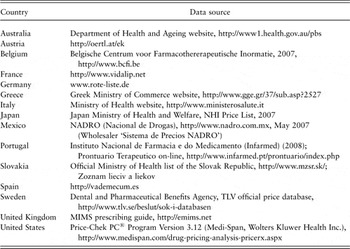
Finally, Table 5 demonstrates the empirical evidence that emerges from a sub-sample of the total sample, notably the determinants of public prices in that part of the sample comprising genericized originator prescription medicines. Product age continues to have a negative sign and is significant across all specifications, suggesting that the age of the product still drives prices and price variations across countries. us is positive and significant in Models 1 and 2, but positive and non-significant in Models 3 and 4. uk is non-significant, while mex is positive and significant in all four cases. Free pricing has a positive and significant effect and the explicit use of HTA has a negative and significant effect.
Random effects panel data estimation: off-patent originator drugs facing generic competition only

Robust standard errors in brackets.
**Significant at 5%; ***significant at 1%.
5 Discussion and policy implications
In this paper we have used a representative sample of originator branded prescription medicines to analyze the determinants of their prices and price changes across 15 OECD countries. Any potential biases occurring due to generic medicines and formulations and the different dynamics of the generic market, are avoided as generics are excluded. By using data at two different points in time, further insights are obtained on how product age, pharmaceutical price regulation and competition impact on prices of originator (in- and off-patent) branded prescription medicines. Both ex-factory and public prices are considered in the analysis. The inclusion of public prices is of great significance, as these are the prices that health insurers or consumers have to pay; consequently, assessments of affordability and cost containment unavoidably focus on this particular price.
Important findings have emerged from the analysis presented in this paper. First, although the price spread in older therapeutic categories used to be significant across countries, the same spread has narrowed down significantly for newer therapeutic classes; thus, price convergence is observed over time. Second, cross-country price comparisons are only meaningful if the right prices are compared in each case. Therefore, different studies may show different results, if prices across countries are not selected carefully. In this paper, we have demonstrated how significant price differences are when ex-factory prices are compared and how these differences narrow down significantly when public prices are compared across countries. Third, it seems that price differences between the United States and Europe have been exaggerated. Indeed US prices are higher than European prices, but not at the extent that is usually perceived. A very important aspect is that comparison of ex-factory price differences between United States and Europe can be meaningless as they do not reflect what health insurers pay in the United States.
Fourth, cross-country public price differences and cross-country ex-factory price differences are not the same. This highlights, among other things, the importance of distribution as a key contributor to public prices of prescription medicines, by default, as a contributor to the cost incurred by health insurance. The fact that in many cases distribution margins are regulated and directly (at times proportionately) linked to the prices of medicines further exacerbates this situation. Fifth, off-patent originator brands account for a significant proportion of the price variation between United States and Europe; differences in generic policies between Europe and the United States and more intensive intervention in four of the five largest European countries (Germany, France, Italy and Spain), which encompasses originator brands, can explain the significant increase in the price spread between the United States and Europe (G5). This is also a demonstration of the existence of the generics paradox, particularly in the United States, where prices of off-patent originator brands do not decline post-patent expiry, but, rather, increase faster than prices of in-patent originator brands. Again, this finding is a reflection of developments in the study sample between 2004 and 2007 (and might be the same or different in a wider range of off-patent originator brands), but is in contrast with developments in public prices of in-patent originator brands, where differences between the United States and EU G5 are significantly smaller. Sixth, product age is an important determinant of drug price differences. Newer products or classes of products are on average higher priced than older (classes of) products across all settings after having controlled for other factors. This is also confirmed by other recent work where one of the explanations offered for price increases is the lack of competition due to lack of therapeutically equivalent drugs (GAO, 2009). Upward convergence is also observed over time, which can result partly from explicit use of cross-country price referencing. Seventh, as shown within the European context, distribution and taxation can contribute significantly to the total cost of prescription medicines that health insurers pay. This cost varies widely and relates to significant differences across countries in the rates of payable VAT (e.g. 19% in Germany vs 2% in France and 0% in the United Kingdom), to differences in the way the distribution chain is remunerated or/and is allowed to operate; for instance, there is a fragmented wholesale and retail market structure with high, but regressive, margins in France and Italy, a less fragmented wholesale and retail market structure with flat rates in Germany or a liberalized wholesale and retail market structure in the United Kingdom with extensive horizontal and vertical integration combined with fixed fees per prescription dispensed and the opportunity to negotiate prices and discounts with manufacturers. Although a detailed discussion of taxation and distribution are outside the scope of this paper, the above differences are indicative of the reward structures in the overall pharmaceutical supply chain with analysis conducted elsewhere (Kanavos et al., Reference Kanavos, Schurer and Vogler2011b).
The evidence that has emerged from this paper has a number of policy implications. First, when conducting cross-national comparisons of prescription drug prices it is important to know what prices are compared and to ensure that such comparisons use the same denominator across countries. Misperceptions often occur about price levels across countries, particularly when list prices are confused with public prices. List prices coincide with public prices in European countries, but this is not the case in the United States. In this context, price differences between United States and Europe are not as extensive as originally thought.
Second, it is important to recognize the strategic importance of the components of drug prices across countries. One important factor that contributes to price differences across countries is taxation, through the imposition of a sales tax or VAT. Different approaches to taxation suggest that there is no economic rationale for imposing sales taxes or VAT on prescription medicines, other than taxing resources devoted to the health care budget. A further factor influencing prices is the contribution of the distribution sector, both wholesale and retail. Overall, the paper has shown that a significant component of the prices that health insurers pay relate to taxation and distribution costs and this could result in resource misallocation. Overall, public prices are totally different from ex-factory prices and the former reflect the rewards to the entire pharmaceutical value chain, while the latter are not representative of reality.
Third, the cross-country price spread for newer therapeutic categories or, indeed, products, is significantly lower than that for older therapeutic categories or products. As we move towards newer molecules over time by launch date, there is upward price convergence across the study countries overall. This is partly explained by external price referencing and the launch sequence for new products, whereby new products are first launched in less-regulated countries followed by price-regulated countries. This launch sequence influences in part the final price in price-regulated countries. In addition, considering that a significant proportion of the study countries are implementing some form of regulation on originator drug prices this finding challenges the arguments that the United States is bearing a significant part of the R&D burden compared with other regions.
Fourth, the price spread between in-patent originator brands in the sample is smaller compared with the same spread between off-patent originator brands in the same sample, both over time and between Europe and the United States; a significant proportion of the price variation in originator brands across countries is accounted for by changes in the off-patent originator brand segment; prices in that segment rise significant in the United States and decline overall in Europe, confirming the generics paradox in the United States and the associated policy implications.
Fifth, having controlled for other factors, the statistical significance of product age suggests that newer medicines or classes of medicines are rewarded with a premium over older treatments across all settings. Again, this challenges the argument that if innovation exists in newly introduced treatments, it is poorly rewarded outside the United States.
The analysis is not without limitations. First, there is no available data on advertising, for example in the form of expenditure in detailing, to test its impact on prices, although a recent systematic review has shown that advertising influences prescribed volume (Spurling et al., Reference Spurling, Mansfield, Montgomery, Lexchin, Doust, Othman and Vitry2010). Besides, the inclusion of the US dummy captures any unexplained heterogeneity surrounding direct to consumer advertising as this is the only country in the sample where it is allowed. Second, whereas the sample of products selected has a significant budget impact and accounts for a significant proportion of total originator branded prescription pharmaceuticals in the study countries, it may be the case that outliers may exist in terms of products that are sold in in-patient settings, which are highly specialized (e.g. vaccines or oncology products) and for which the pricing arrangements may be different. While this paper explores pricing determinants in the pharmacy market, an obvious extension would be to study pricing developments in the in-patient sector. Finally, while we have exhausted all possibilities to include prices actually paid by health insurance, it is not possible to account for any hidden rebates given from manufacturers to health insurers. As the subject matter is originator brand prices, it is thought that the impact of such rebates is limited.
6 Conclusions
In this paper, we have investigated the determinants of prices of originator branded prescription medicines across different regulatory settings and health care systems, taking into account their launch date, patent status, market dynamics and the regulatory context in which they diffuse. Volume-weighted price indices have been used to analyze price levels for a basket of prescription medicines and their differences in 15 OECD countries, the impact of distribution margins and generic entry on public prices and to what extent innovation, by means of introducing newer classes of medicines, contributes to price formation across countries.
The evidence shows that differences in ex-factory prices for branded originator prescription medicines between the United States and other countries, particularly key European markets, are significant, but these are not the prices that health insurers pay. By contrast, public price differences have been exaggerated and are not as high as originally thought. At public price level, differences between the United States and other countries, particularly Europe, are greatest for off-patent originator brands and significantly lower for in-patent originator brands. Exchange rate movements and volatility can exacerbate such differences and international comparisons should be treated with caution. Product age has a significant effect on originator brand prices in all settings after having controlled for other factors. Price convergence is observed across countries for newer compared with older originator brands and this could be partly attributed to the extensive use of external price referencing. Originator brand prices do not necessarily fall after generic entry and may actually increase, a phenomenon known as the ‘generics paradox’ and prevalent chiefly in the United States. Finally, distribution and taxes are important determinants of public prices in several of the study countries, having a significant impact on the cost of prescription medicines to health insurers and affecting the overall payoffs for the different stakeholders in the pharmaceutical supply chain.
Acknowledgements
The authors are grateful to Andrew Jack, Chris Muris, Paul DeNijs, Kees de Joncheere and two anonymous referees for very useful comments and suggestions. Fabio Mainieri and Meg Casson provided excellent research assistance. All outstanding errors are the authors' own. No conflicts of interest arise from this paper.
Appendix
Sources of pricing data

Notes: NHI=National Health Insurance; TLV=Tandvårds-och Läkemedelsförmånsverket (Dental and Pharmaceutical Benefits Agency); MIMS=Monthly Index of Medical Specialties.