I. INTRODUCTION
In recent years, nanoparticles were used to tune the physical properties of numerous matrix materials.Reference Sirinakis, Siddique, Monokroussos, Carpenter and Kaloyeros1–Reference Konstantinović, del Muro, Varela, Batlle and Labarta8 For example, they were used to change the optical behavior of a dielectric matrix due to the excitation of surface plasmon resonances,Reference Christke, Katzer, Grosse, Schmidl, Schmidl, Fritzsche, Petschulat, Pertsch and Rettenmayr9 to locally increase the critical current density in superconducting thin films,Reference Katzer, Stahl, Michalowski, Treiber, Schmidl, Seidel, Albrecht and Schütz10 allowing to optimize the performance of sensor devicesReference Katzer, Schmidt, Michalowski, Kuhwald, Schmidl, Grosse, Treiber, Stahl, Albrecht, Hübner, Undisz, Rettenmayr, Schütz and Seidel11 or to enhance resistive switching effects.Reference Au, Gao, Wang, Bao, Liu and Dai12,Reference Lee, Kim, Shin, Kim and Cho13 On the other hand, the matrix material can be used to tune the size, shape, and distribution density of the nanoparticles.Reference Katzer, Westerhausen, Naujok, Bernhardt, Schmidl, Fritzsche, Undisz, Drüe, Rettenmayr and Schmidl14 In particular, anisotropic particles that promise increased sensitivity are of great interest for detection technologies of biomolecules.Reference Dreaden, Alkilany, Huang, Murphy and El-Sayed15 Furthermore, various applications demand crystalline nanoparticles with different sizes and aspect ratios.Reference Dykman and Khlebtsov16 We will show that the growth of such particles is straightforward using matrix-induced growth.
Strontium titanate is used in science in many electronic devices like capacitors, thermistors, varistors, resistive switches, and as gate dielectrics in semiconductors due its high dielectric constant. In addition, it plays a decisive role as a substrate material for the growth of titanates and superconductive layers. In combination with Au nanoparticles, strontium titanate was recently used as a large band gap semiconductor for solar light photo-oxidation, which is highly interesting for energy conversion and environmental applications, including solar fuel generation and organic pollutant decomposition.Reference Ming, Suntivich, May, Stoerzinger, Kim and Shao-Horn17 On the other hand, in former experiments we have found the formation of a network of nanoscopic metallic islands in thin Au/STO/YBCO multilayer tunnel structures on STO substrates.Reference Grosse, Schmidl and Seidel18 The inclusion of self-organized grown metallic nanoparticles should influence the electrical properties of the STO thin films at lower temperatures also in a significant manner.
To determine the size and the shape of embedded nanoparticles, transmission electron microscopy (TEM) is used, which is a commonly used method. However, it requires the work-intensive preparation of lamellae, e.g., by using a focused ion beam (FIB). Furthermore, using TEM only small sample volumes can be probed. Alternatively, it is possible to perform a nondestructive investigation of the samples by x-ray diffraction (XRD), avoiding the risk of affecting the sample by the preparation or measurement process. It also offers the opportunity for investigating a larger sample volume, thus increasing the number of measured particles and improving the statistics. Information about the particle size and strain can also be gained.Reference Jiang, Rühle and Lavernia19
II. EXPERIMENTAL
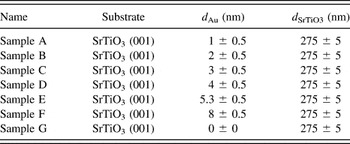
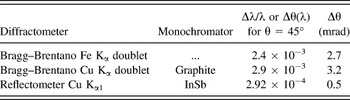
Au nanoparticles in a SrTiO3 matrix were prepared by a self-assembly method, which has been described in detail elsewhere.Reference Katzer, Westerhausen, Naujok, Bernhardt, Schmidl, Fritzsche, Undisz, Drüe, Rettenmayr and Schmidl14 First, Au layers with a thickness between 1 and 8 nm were deposited on ultrasonically cleaned (001) SrTiO3-substrates using DC magnetron sputtering. Using an argon pressure of 1.6 × 10⁻³ Torr under continuous gas flow and an emission current of 10 mA, a deposition rate of 4 nm/min has been found. To accurately determine the thickness of the prepared films, additional prepatterned substrates were coated in the same deposition process. Thus, atomic force microscopy measurements allowed obtaining the seed layer thickness without influencing the actual samples. Hence, thin gold layers with defined thickness could be deposited (error below 0.5 nm). Subsequently, the Au coated samples were heated to 800 °C in an atmosphere of pure oxygen (p = 100 Pa) with the purpose of initiating the dewetting of the Au seed layer. After an annealing time of 10 min, a SrTiO3 thin film matrix with a thickness of 275 nm was deposited by pulsed laser deposition (PLD). Using a KrF-excimer laser (λ = 248 nm, τ = 25 ns), operating at a repetition rate of 5 Hz and a laser fluence of 1.5 J/cm², the growth rate was found to be 11 nm/min. After the SrTiO3 deposition, the samples were cooled down to room temperature at a rate of 50 K/min in an atmosphere of pure oxygen (p = 200 Pa). The thus-produced samples with their different Au seed layer and SrTiO3 top layer thicknesses are listed and labeled in Table I. Furthermore, it has to be noted that for each individual sample a reference without nanoparticles has been prepared by exactly the same deposition process. This allows us drawing conclusions on how the STO matrix is affected by the presence of Au particles. To investigate the nanoparticles in the SrTiO3 matrix, XRD measurements were carried out using three different Bragg–Brentano diffractometers. To adapt the detection sensitivity and the angular resolution, various angular divergences and monochromators were applied (see Table II). The usage of different x-ray lines, namely, Cu Kα, λ = 1.54 Å and Fe Kα, λ = 1.94 Å allowed increasing the surface sensitivity by applying grazing incidence diffraction of asymmetric reflections. To correlate the integral information obtained by XRD with local measurements on single particles, scanning TEM (STEM) and high resolution TEM (HRTEM) measurements were also performed with a FEI Helios NanoLab 600i microscope (FEI, Hillsboro, OR) in a bright field modus (accelerating voltage of 29 kV) and a JEOL JEM-3010 microscope (JEOL Ltd., Tokyo, Japan) in a bright field modus (accelerating voltage of 300 kV). The investigated TEM and STEM species were prepared using a Ga-FIB included in the FEI Helios NanoLab 600i.
The names of the produced samples (name) with their substrate, Au seed layer thicknesses (d Au), and SrTiO3 top layer thicknesses (d SrTiO3). For each sample, a reference without Au particles was prepared in the same deposition process.

The used diffractometers (diffractometer) with their monochromators (monochromator) spectral bandwidth (Δλ/λ or Δθ(λ) for θ = 45°) and Bragg angle resolution (Δθ).

III. RESULTS AND DISCUSSION
A. Size of the Au nanoparticles
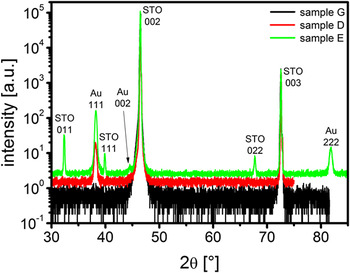
In θ-2θ-scans of a wide angular range (30–85°), see Fig. 1, we identified three Au-reflections: the dominant (111)-reflection, its higher order harmonic (222)-reflection, and the (002)-reflection, which is two orders of magnitude weaker. These are typical reflections for face-centered-cubic metals deposited on ceramic substrates.Reference Francis and Salvador20 The dominant Au-(111)-reflection can be found independently from the initial Au seed layer thickness. As opposed to this, the Au-(002)-reflection disappears at an Au seed layer below 4 nm (sample D), which is most likely caused by insufficient x-ray intensity. We have calculated the quotient of the integral intensity for the two Au reflections by the following formulaReference Spieß, Teichert, Schwarzer, Behnken and Genzel21:
 $${{I\left( {111} \right)} \over {I\left( {002} \right)}} = {{L\left( {{\theta _{111}}} \right)\cdot{P\left( {{\theta _{111}}} \right)}\cdot{H\left( {111} \right)}\cdot{{\left| {F\left( {111} \right)} \right|}^2}} \over {L\left( {{\theta _{002}}} \right)\cdot{P\left( {{\theta _{002}}} \right)}\cdot{H\left( {002} \right)}\cdot{{\left| {F\left( {002} \right)} \right|}^2}}}\quad ,$$
with the Lorentz factor L(θhkl), the polarization factor P(θhkl), the number of equivalent lattice plane H(hkl), and the structure factor F(hkl). An absorption factor, extinction factor, and a factor which is influenced by the used equipment were not considered, because they are nearly the same for the two Au reflections. This calculation yields to a ratio of 1.3 for the integral intensities of the Au-(111) and Au-(002)-reflections, whereas a ratio of 170 was determined from the measured integral intensities. By comparing these two ratios, we can conclude that a preferential particle orientation with the (111) lattice plane parallel to the surface is 100 times more probable than the [001]Au||[001]STO orientation. In addition, for Au seed layer thicknesses above 4 nm (sample E and sample F), secondary SrTiO3-orientations with lattice plane indices (011) and (111) can be observed. The fact that both samples show additional STO orientations which are more pronounced using the thicker Au layer already indicates that their appearance should be caused by a nanoparticle induced change in the STO growth direction. This is proved by the observation that the reference samples without nanoparticles, which were prepared in the same PLD process, do not show secondary STO orientations. Due to the fact that those samples were subject to the same preparation conditions, one can directly conclude that the presence of large Au nanoparticles leads to a reproducible change in the STO growth conditions. This was observed before in the case of BaTiO3 (BTO) thin films and offers the possibility of locally tuning the film growth, allowing the fabrication of multifunctional devices.Reference Yang, Yao, Li, Das and Viehland22 Considering Fig. 1, it is obvious that the full width at half maximum (FWHM) of the (011)- and (111)-SrTiO3-reflections is much smaller than the FWHM of the Au-(111)-reflection. After a detailed analysis of the diffraction line shapes, this implies that the secondary STO regions are of much larger extension than the Au nanoparticles, causing less size induced broadening of the x-ray reflection.
θ-2θ-scans of an epitaxially grown 275 nm pure SrTiO3 layer (black) and a 275 nm SrTiO3 layer with embedded Au nanoparticles (green and red). The seed layer had a thickness of 4 nm (red) and 5.3 nm (green). Cu Kα λ = 1.54 Å radiation has been used.

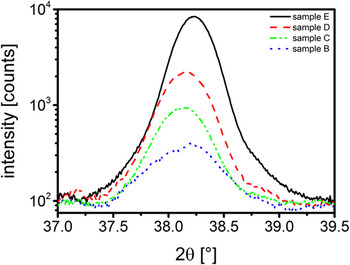
To examine the angular spread of the nanoparticles with (111) orientation, we performed ω-scans around the maximum. The FWHM of these ω-scans was about 0.7° (from sample B to sample E), corresponding to a very precise orientation of the nanoparticles along the <111>-direction, and doubles for the sample F. With increasing Au seed layer thickness, the obtained Au-(111)-reflections of the θ-2θ-scans get more intense (Fig. 2). This enhanced intensity can be explained either by the larger diffracting volume or by an increase of the coherently diffracting Au particle size. Obviously, the curves get narrower for larger Au seed layers. The small change in the peak position which can be seen in Fig. 2 should predominantly be caused by the different sample alignments between two measurements rather than from a continuous deformation of the particles' lattice planes.
XRD Au-(111)-reflection of crystalline Au nanoparticles in an epitaxial 275 nm thick SrTiO3 matrix for different Au seed layer thicknesses, Cu Kα.

In addition, we measured the asymmetric Au-(022)-reflection. For this, sample and detector were tilted with respect to each other to measure another reflection of the same (111) oriented particles. However, because the angle α between the (022) lattice plane and the sample surface is α = 35.3°, Cu Kα cannot be used, since the Bragg angle is smaller than α. Thus, we used Fe Kα ensuring that θ022 > α, i.e., the (022) reflection can be observed. Both reflections are broadened by the divergence of the used equipment and the x-ray line profile. However, the influence of these effects can be estimated.Reference Bowen and Tanner23 Assuming a Gaussian overlap for the integral breadths (total area under the diffraction maximum divided by the peak intensity) of these convolution effects, we determined the true integral breadth of the Au-(111)- and Au-(022)-reflections. By applying the Scherrer-equationReference Scherrer24:
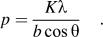 $$p = {{K\lambda } \over {b\cos \theta }}\quad .$$
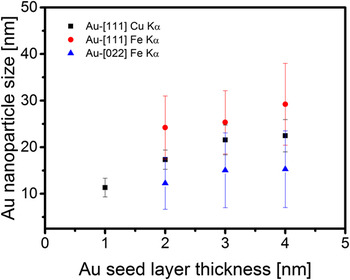
We have then calculated the size p of the nanoparticles using the wave length λ of the impinging x-rays, the Bragg angle θ, and the true integral breadth b of the Au-(111)- and Au-(022)-reflection. The factor K was assumed to be 1.1547 for the (111)-reflection and 1.0607 for the (022)-reflection.Reference Langford and Wilson25 The resulting size p corresponds to the size of the coherently diffracting volume along the Au<111> and Au<011> direction and is an average of all Au nanoparticles in the illuminated sample volume. Assuming single crystalline particles, which is in perfect agreement with all previous investigations,Reference Christke, Katzer, Grosse, Schmidl, Schmidl, Fritzsche, Petschulat, Pertsch and Rettenmayr9p can be identified as the particle size in a specific direction. As one would expect, if we increase the Au seed layer thickness, the size of the Au nanoparticles in the SrTiO3 matrix also increases. However, along the <111>-direction, the growth rate of particles appears to be larger than in the <011>-direction (see Fig. 3).
Size of the Au nanoparticles along the Au<111> and <011> directions, calculated from the measured Au-(111)- and Au-(022)-reflection breadth using the Scherrer-equation for different Au seed layers. Using Cu Kα radiation, the (022) reflection cannot be observed. However, the (111) Cu Kα data points are given as an additional proof.

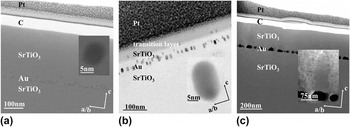
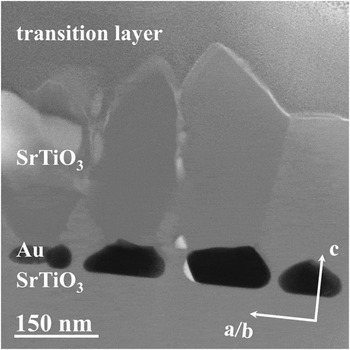
The particle size in the <111> direction measured using Fe Kα exhibits the tendency that the particles get bigger in this direction. However, the errors of these values are 30%. Therefore, the particle size in the <111> direction has additionally been measured using Cu Kα instead of Fe Kα to get values with a higher accuracy of 15–18%. Further, the influence of the instrument on the particle size determination was proved. As shown in Fig. 3, the size of the Au nanoparticles in the <111>-direction is a bit larger in the measurements with Fe Kα, which is caused by the different instrumental divergence functions of both set ups. However, both measurements exhibit the same increase in the particle size only with different absolute values. This shows that the obtained results and our drawn conclusions are not due to the experimental setup. Since the particle dimension in the <111> direction is larger than that in the <011> direction, the particles must have a nonspherical shape. This is in good agreement with previous investigations, where we can identify elliptical gold nanoparticles in a SrTiO3 matrix by STEM-investigations [Fig. 4(b)]. These particles are well ordered and have a similar size and shape, as we also would conclude from the x-ray measurements.
Bright field STEM-images of Au nanoparticles embedded in a SrTiO3 matrix for different Au seed layer thicknesses. The insets show a closer view of single Au nanoparticles. (a) Bright field STEM-image of sample A with almost spherical Au nanoparticles, accelerating voltage 29 kV; (b) bright field STEM-image of sample D with ellipsoidal shaped Au nanoparticle, accelerating voltage 300 kV. The transition layer is due to the FIB damage during the lamella preparation process; (c) bright field STEM-image of sample E with irregular shaped Au nanoparticles and some SrTiO3 grains (behold magnification), the contrast of the magnification was changed to increase the visibility of the SrTiO3 grain, accelerating voltage 29 kV.

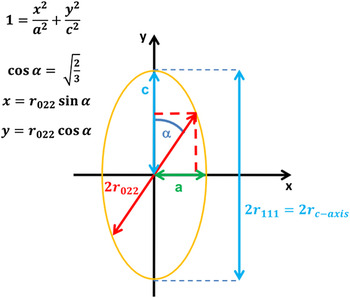
Using the investigated particles of an ellipsoidal shape, we can transform the size of the Au particles in the <011>-direction of Fig. 3 in a size of the a-b-direction using the equation:
 $${r_{a/b{\rm{ - axis}}}} = {{{r_{111}}\cdot{r_{022}}} \over {\sqrt {3r_{111}^2 - 2r_{022}^2} }}\quad ,$$
which arises from simple geometric considerations illustrated in Fig. 5.
Schematic illustration of an elliptical Au nanoparticle and geometric considerations to calculate the a-b-axis size of the particles from the measured Au-(111)- and Au-(022)-reflection breadths.

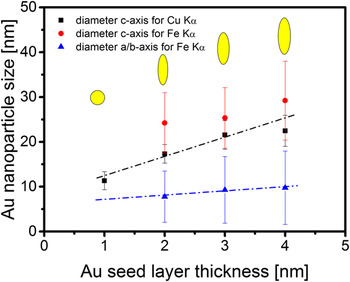
The resulting size of the Au nanoparticles along their a/b- and c-axes is shown in Fig. 6. With increasing Au seed layer thickness, the c-axis extension of the nanoparticles is enlarged. This tendency can be seen for the values, obtained by using Fe Kα, and gets better visible for the values, obtained by using Cu Kα with the higher accuracy. In contrast, the extension in the a/b-axis remains nearly constant. For measurement, the extension of the a/b-axis with Cu Kα is not possible. Therefore, only by comparing the c-axis values measured using Cu Kα with the a/b-axis values measured using Fe Kα a determination of the aspect ratio is possible. Consequently, we can observe a change in the particles' aspect ratio from 1:1 to 1:2 for Au seed layer thicknesses between 1 and 4 nm. For the samples with an Au seed layer thickness above a critical value of 4 nm (sample E and sample F), the situation is different. STEM-images of these samples show Au nanoparticles with a size of more than 100 nm (see Fig. 7), which are too large for a reliable size determination by applying the Scherrer equation. These Au nanoparticles seem to be facetted and are no longer elliptical shaped. Furthermore, as stated before, an Au induced change in the SrTiO3 cover layer growth can be observed. Two differently oriented regions with grain boundaries in between can be observed, which seem to start their growth at different facets of the Au nanoparticles, i.e., the faceting of the STO matrix is dictated by the shape of the Au nanoparticles. This leads to the conclusion that the growth direction of STO thin films can be changed by a substrate decoration with nanoparticles of appropriate size and shape, as described before in the case of BTO films.Reference Yang, Yao, Li, Das and Viehland22 Additionally, the presence of differently oriented grains and grain boundaries could affect the electric properties of STO as they are known to dominatingly affect the electrical properties of oxides.Reference Browning, Buban, Moltaji, Pennycook, Duscher, Johnson, Rodrigues and Dravid26 In particular, SrTiO3 is used for some applications, which rely heavily on the presence and behavior of grain boundaries.Reference Zhang, Sigle, De Souza, Kurtz, Maier and Rühle27 Furthermore, grain boundaries affect the transport of oxygen,Reference Merkle and Maier28 which plays a key role in the resistive switching of STO.Reference Rozenberg, Sánchez, Weht, Acha, Gomez-Marlasca and Levy29–Reference Szot, Speier, Bihlmayer and Waser31 Thus, our observations should be of great interest for future investigations.
Size of the Au nanoparticles along their a/b- and c-axis, respectively, calculated with Eqs. (1) and (2) from the measured XRD Au-(111)- and Au-(022)-reflection breadths for different Au seed layer thicknesses. The yellow shapes directly illustrate the nanoparticles' shapes corresponding to the data presented in the figure.

Bright field STEM-image of Au nanoparticles (black) embedded in a SrTiO3 matrix, for sample F (Au seed layer thickness of 8 nm, accelerating voltage 29 kV). The size of most of the particles is above 100 nm. Different grain orientations of the SrTiO3 cover layer can be seen, starting their growth from different facets of the Au nanoparticles. The regions of white contrast are voids.

B. Strain state of the Au nanoparticles
Up to now, we have seen that using an Au seed layer we are able to prepare elliptically shaped nanoparticles in the SrTiO3 matrix and that we can tune the aspect ratio by a variation of the gold layer thickness. It is not yet understood why the elliptical shapes arises and why a certain critical thickness exists at which the particle shapes immediately change and different SrTiO3 orientations can be observed. However, it is intuitively comprehensible that the particles or the SrTiO3 matrix should be strained, especially due to the different lattice parameters of the gold and strontium titanate. Therefore, a detailed strain analysis of the nanoparticles and the matrix seems to be interesting and could provide a reasonable explanation for a change in the particle shape.
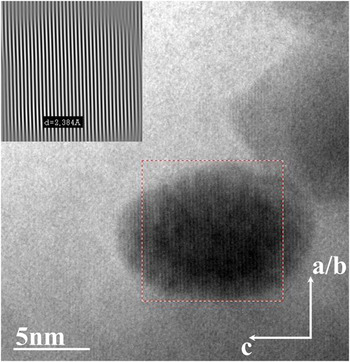
Until now, we have used the integral breadth of x-ray reflections to estimate the particle size. If we analyze the 2θ-position of the Au-(111)-reflection with respect to the 2θ-position of the (002) SrTiO3 substrate peak, small changes in the lattice plane distance in comparison with the theoretical value are determined. This is very interesting especially for the two samples displaying the additional (011) and (111) SrTiO3 reflections (sample E and sample F) (see Fig. 1). The lattice plane distance of these different oriented SrTiO3 regions was measured to be d STO011 = 276.3 pm and d STO111 = 225.7 for sample F and d STO011 = 276.5 pm and d STO111 = 225.9 pm for sample E. For both samples, these data are about 0.2–0.4 pm larger than the theoretical value (d STO011 = 276.1 pm and d STO111 = 225.5 pm). In contrast, the lattice plane distance for the Au-(111)-reflection was measured to be d Au111 = 235.3 pm for sample F and d Au111 = 235.1 pm for sample E, which is about 0.1–0.3 pm smaller than the theoretical value (d Au111 = 235.4 pm). This indicates a continuous deformation in both, the secondary SrTiO3 phase and the Au nanoparticles, which could be understood as a matching of both systems, Au nanoparticles and SrTiO3. The very small change in the lattice plane distance first seems to be inconsistent with HRTEM-measurements where we can find Au nanoparticles having a much stronger change in their lattice plane distance (Fig. 8 with d Au111 = 238.4 pm). However, it is pertinent to note that the XRD-measurements provide an integration over a large number of nanoparticles, whereas the HRTEM-measurements only observe one single particle. Thus, comparing the result of one single nanoparticle given by HRTEM with a mean value of thousands of nanoparticles given by an x-ray analysis does not necessarily require to find identical results.
HRTEM-image of an Au nanoparticle embedded in a SrTiO3 matrix (sample B, accelerating voltage 300 kV). Note that the whole sample seems to be rotated 90° compared to the STEM images we have shown before. This is only due to the measurement setup, as can be seen considering the corresponding coordinate system. The lattice plane distance can be analyzed using Fourier filtering. The red rectangle marks the area of the particle where the Fourier analysis has been performed.

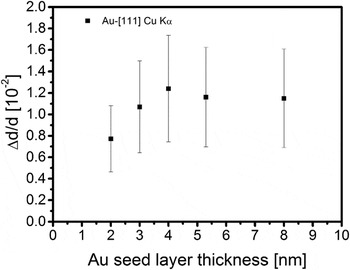
However, the results of the HRTEM-measurement can be understood, if we investigate the strain gradient in the Au nanoparticles, which also influences the integral breadth of the Au-(111)-reflections apart from the particle size. To give an estimation of this effect, we investigated the Au-(222)-reflection. The influence of the strain gradient on the reflection curve width is more pronounced for the (222)-reflection and stronger than the effect of crystal size broadening. From the relative change in the integral breadth b of the Au-(111)- compared to the Au-(222)-reflection, we can calculate the relative change in the lattice plane distance Δd/d along the c-axis of the Au nanoparticles using:
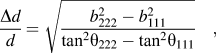 $${{\Delta d} \over d} = \sqrt {{{b_{222}^2 - b_{111}^2} \over {{{\tan }^2}{\theta _{222}} - {{\tan }^2}{\theta _{111}}}}} \quad ,$$
where θ111 and θ222 are the Bragg angles of the Au-(111)- and Au-(222)-reflections. In Fig. 9, it is shown that for an initial Au seed layer thickness up to 4 nm the change in the lattice plane distance is enlarged with increasing seed layer thickness. Above the critical value of 4 nm seed layer thickness, where secondary STO orientations and facetted particles can be observed, Δd/d seems to slightly drop and remains constant for higher seed layer thicknesses. For all samples, Δd/d is in a range between 0.7 and 1.3%, which corresponds to a change in the Au (111) lattice plane distance between 1.8 and 3 pm This is in good agreement with HRTEM-images (Fig. 8), where we find Au nanoparticles with a lattice plane distance of 2.38 Å instead of 2.35 Å [i.e., the theoretical value for the lattice plane distance of Au (111)]. To obtain this lattice plane distance, we used a Fourier filtering process. Unfortunately, an identification of Δd/d for the Au (022) was not possible with our laboratory x-ray setup due to the weak signal of the Au-(044)-reflection.
Average strain Δd/d of (111) orientated Au nanoparticles in SrTiO3 matrix parallel to the surface as a function of initial Au seed layer thickness.

IV. CONCLUSION
In conclusion, we have fabricated anisotropically shaped Au nanoparticles embedded in SrTiO3 and characterized them with XRD and TEM. The results of the x-ray and TEM analysis are in perfect agreement, showing that it is possible to control the aspect ratio of the Au nanoparticles by changing the Au seed layer thickness. Furthermore, it could be demonstrated that embedding large Au nanoparticles leads to a nanoparticle induced change in the STO growth direction, which should be of great interest for future studies. XRD proved to be a very powerful tool, particularly for studying size, shape, orientation, and deformation of crystalline nanoparticles prepared by matrix induced self-organization. It provided nondestructive integral information of a large sample volume without the need for an additional sample preparation.
ACKNOWLEDGMENTS
The authors would like to thank H. Marschner for characterizing the SrTiO3 substrates by x-ray topography. CK gratefully acknowledges financial support by the Landesgraduiertenförderung Thüringen.