Introduction
Mitochondrial genomes (mitogenomes) are often used for phylogenetic analyses focusing on the phylogenetic relationship of the shallow nodes from inter-familial to intra-species levels (Hirase et al., Reference Hirase, Takeshima, Nishida and Iwasaki2016; Zhang et al., Reference Zhang, Sun, Rouse, Wiklund, Pleijel and Watanabe2018; Tan et al., Reference Tan, Gan, Lee, Bracken-Grissom, Chan, Miller and Austin2019; Alves et al., Reference Alves, Halanych and Santos2020; Kobayashi et al., Reference Kobayashi, Itoh, Fukuda and Kojima2021; Ogoh et al., Reference Ogoh, Futahashi and Ohmiya2021; Sun et al., Reference Sun, Daffe, Zhang, Pons, Qiu and Kupriyanova2021). The animal mitochondrial DNA is generally circular, comprising 15–20 kilobase pairs (kbp) (Boore, Reference Boore1999), and is relatively conserved as compared with the quite diverse plant mitogenomes ranging from 6 kbp to ≥11 Mbp (Mower, Reference Mower2020). The mitogenomes of animals are usually comprised of 13 protein-coding genes (PCGs; cox1–3, atp6, atp8, cytb, nad1–6 and nad4l), 2 rRNAs and 22 tRNAs (Boore, Reference Boore1999), and this conservation ensures the homology of genes when performing the phylogenetic analysis based on the mitogenomes.
The phylum Annelida consists of over 20,000 described species, such as polychaetes, echiurans, sipunculans, hirudineans and oligochaetes (Capa & Hutchings, Reference Capa and Hutchings2021). Annelids include some early-branching lineages, Errantia (mobile annelids with well-developed parapodia) and Sedentaria (sessile annelids with less-developed parapodia) (Struck, Reference Struck, Purschke, Böggemann and Westheide2019; Rouse et al., Reference Rouse, Pleijel and Tilic2022). Sedentaria comprises ecologically and morphologically diverse members from the high-altitude mountains to the hadal zone, such as echiurans, vestimentiferans and clitellates (hirudineans and oligochaetes) (Manca et al., Reference Manca, Ruggiu, Panzani, Asioli, Mura and Nocentini1998; Paterson et al., Reference Paterson, Glover, Barrio Froján, Whitaker, Budaeva, Chimonides and Doner2009). The species of Sedentaria are interesting research subjects due to their evolutionary history. However, several families are not yet included in phylogenomics, and their phylogenetic position remains insufficiently resolved.
A family in Sedentaria, Arenicolidae includes four genera (Branchiomaldane, Abarenicola, Arenicolides and Arenicola) and 24 described species (Darbyshire, Reference Darbyshire2020). Arenicolids are known as ‘lugworms’ and are well-known polychaetes for their eye-catching faecal mounds in the intertidal to shallow sublittoral zones. Generally, arenicolids are deposit feeders, inhabiting silty sand by making burrows (Jumars et al., Reference Jumars, Dorgan and Lindsay2015) that can process sediments up to 280 times their dry body weight per day (Taghon, Reference Taghon1988). The phylogenetic position of Arenicolidae is well known. The sister relationship between Arenicolidae and Maldanidae has been supported by molecular phylogeny (Bleidorn et al., Reference Bleidorn, Vogt and Bartolomaeus2005; Struck et al., Reference Struck, Schult, Kusen, Hickman, Bleidorn, McHugh and Halanych2007) and morphology (Bartolomaeus & Meyer, Reference Bartolomaeus and Meyer1997). Arenicolidae is included in the clade of polychaetes (e.g. Terebellida, Capirellidae, Opheliidae and Scalibregmatidae), echiurans and clitellates (hirudineans and oligochaetes) (Struck et al., Reference Struck, Golombek, Weigert, Franke, Westheide, Purschke, Bleidorn and Halanych2015; Helm et al., Reference Helm, Beckers, Bartolomaeus, Drukewitz, Kourtesis, Weigert, Purschke, Worsaae, Struck and Bleidorn2018; Martín-Durán et al., Reference Martín-Durán, Vellutini, Marlétaz, Cetrangolo, Cvetesic, Thiel, Henriet, Grau-Bové, Carrillo-Baltodano, Gu, Kerbl, Marquez, Bekkouche, Chourrout, Gómez-Skarmeta, Irimia, Lenhard, Worsaae and Hejnol2021). Although a robust phylogenetic framework is established, the phylogenetic positions of some families in this clade remain unclear. The mitogenomic phylogeny might provide implications for the phylogenetic relationships in this clade, although the position of Travisiidae and Terebellidae are unknown in the previous analyses based on mitogenomes (Zhong et al., Reference Zhong, Hansen, Nesnidal, Golombek, Halanych and Struck2011; Nam et al., Reference Nam, Park, Kim, Kim and Rhee2021; Kobayashi et al., Reference Kobayashi, Itoh and Kojima2022a, Reference Kobayashi, Itoh and Nakajima2022b). The intra-familial relationship of Arenicolidae was also not entirely understood by phylogenetic analyses based on 16S or 18S rRNA sequences (Bleidorn et al., Reference Bleidorn, Vogt and Bartolomaeus2005; Darbyshire, Reference Darbyshire2017). The mitogenome sequences of arenicolids would therefore help elucidate the intra-familial relationships of Arenicolidae in the future and the inter-familial relationships of related families. However, mitogenomes are not yet available for Arenicolidae.
In this study, we determined and examined the first mitochondrial genome of Arenicolidae. The phylogenetic trees were reconstructed based on the nucleotide and amino acid sequences of the part of Sedentaria, including the mitogenomes of recently published families, which resulted in the most inclusive taxon sampling of ingroup families to elucidate the phylogenetic relationship of Abarenicola claparedi oceanica and closely related families.
Materials and methods
A specimen of Abarenicola oceanica was collected from the shallow subtidal zone (~1 m) in Rishiri Island, Hokkaido (45°06′57″N 141°17′18″E) (Kobayashi et al., Reference Kobayashi, Abe, Itoh, Tomioka and Kojima2018a). The specimen was fixed and preserved in 70% ethanol and was deposited at the Rishiri Town Museum (RTMANL001). The total DNA was extracted from the body wall tissue using a DNeasy Blood and Tissue Kit (QIAGEN, Hilden, Germany).
Long PCR was performed for the mitogenome following a method developed by Wu et al. (Reference Wu, Shen, Sun, Ren, Wang, Huang and Liu2009). The partial sequence of the 16S rRNA gene sequence was determined using the method described by Kobayashi et al. (Reference Kobayashi, Goto, Takano and Kojima2018b), using a universal 16S primer set (16Sar: 5′-CGCCTGTTTATCAAAAACAT-3′/16Sbr: CCGGTCTGAACTCAGATCACGT-3′; Palumbi, Reference Palumbi, Hillis, Mortiz and Mable1996). A primer set for long PCR (MalMito16SF: 5′-GAARAAGWTTGGCACCTCGATGTTGGCTTAG-3′/MalMito16SR: 5′-ATTATATGCTACCTTAGCACGGTCAGGRTACCGC-3′) was designed based on the dataset consisting of the 16S rRNA gene sequence of arenicolids and maldanids. The PCR mixture for long PCR comprised 2.2 μl of sterilized water, 6.25 μl of KOD One PCR Master Mix (TOYOBO, Osaka, Japan), 1.0 μl of 10 μM forward and reverse primers and 3.3 μl of template DNA solution diluted 10 times with sterilized water. PCR amplification was performed as follows: 60 s at 94°C for an initial denaturation, 35 cycles of 10 s at 98°C and 3 min at 68°C. PCR product of >15 kb in size was checked by electrophoresis in 1% agarose gel at 100 V for 40 min and used as a sample for next-generation sequencing.
A paired-end sequencing (2 × 300 bp) of the mitogenome amplicons was performed using an Illumina MiSeq System (Illumina) at the National Institute for Environmental Studies, Japan. The raw reads were registered at the NCBI repository (DRA013990, PRJDB13458 and SAMD00467651). A mitogenome sequence was assembled by GetOrganelle v1.7.1a (Jin et al., Reference Jin, Yu, Yang, Song, dePamphilis, Yi and Li2020) with the default setting except for -R set to 20 using the 16S rRNA gene sequence as a seed sequence. Assembled contigs and the 16S rRNA gene sequence were manually concatenated, and the complete mitogenome of A. claparedi oceanica was obtained. The PCGs and tRNAs were identified using the MITOS2 web server, and then the start and end positions of PCGs were manually checked. The annotated mitogenome sequence was deposited in GenBank through the DNA Data Bank of Japan with the accession number LC707921. Compositional skews were calculated as follows: AT skew = (A − T)/(A + T), GC skew = (G − C)/(G + C). A graphical map of the mitogenome was drawn using CGView (Stothard & Wishart, Reference Stothard and Wishart2004) and edited using Inkscape 0.91 (http://www.inkscape.org).
The maximum likelihood (ML) phylogeny was reconstructed based on the following subsets: (1) nucleotide sequences of 13 PCGs (nucP), (2) nucleotide sequences of 13 PCGs and 2 rRNAs (nucPR), (3) nucleotide sequences of 13 PCGs with ambiguous positions trimmed (nucPt), (4) nucleotide sequences of 13 PCGs and 2 rRNAs with ambiguous positions trimmed (nucPRt), (5) amino acid sequences of 13 PCGs (aaP) and (6) amino acid sequences of 13 PCGs with ambiguous positions trimmed (aaPt). In addition, phylogenetic analysis based on the RY-coding of the nucleotide sequences of PCGs was performed to reduce base compositional biases. This is because RY-coding was judged an effective strategy in inferring the phylogenetic relationship within Terebellida using mitogenomes by Zhong et al. (Reference Zhong, Hansen, Nesnidal, Golombek, Halanych and Struck2011). The same group was included in this study. On the other hand, the RY-coding considerably reduces information; therefore, the phylogenetic analysis based on the RY-coding was considered only for discussion on Terebellida. The nucleotide sequences were RY-coded with a Perl program RYcode (https://github.com/ebraun68/RYcode).
Each dataset consisted of 43 ingroups (oligochaetes, hirudineans, echiurans and closely related polychaetes) and two outgroups (Siboglinidae). The nucleotide sequences of mitogenomes of some Sedentaria, such as spionids and serpulids, are quite different from those of other Sedentaria (e.g. Sun et al., Reference Sun, Daffe, Zhang, Pons, Qiu and Kupriyanova2021), and they are not suitable for phylogenetic analyses. We therefore focused on the part of Sedentaria, which is phylogenetically related to Arenicolidae, and chose siboglinids as outgroups, referring to the current understanding of the phylogenetic relationships of Sedentaria (Struck, Reference Struck, Purschke, Böggemann and Westheide2019; Rouse et al., Reference Rouse, Pleijel and Tilic2022). The sequences were obtained from GenBank except for the newly determined sequence of A. claparedi oceanica (Table 1). The ML analysis was conducted with IQ-TREE v1.6.12 (Nguyen et al., Reference Nguyen, Schmidt, von Haeseler and Minh2014) using 1000 ultrafast bootstrap replicates. The NEXUS partition files were prepared to input sequence data into IQ-TREE. The best-fit substitution model for each gene was selected with ModelFinder (Kalyaanamoorthy et al., Reference Kalyaanamoorthy, Minh, Wong, von Haeseler and Jermiin2017), except for JC2 for the RY-coding dataset, implemented in IQ-TREE (Supplementary data). The amino acid sequences were translated using invertebrate mitochondrial code with SeqKit (Shen et al., Reference Shen, Le, Li and Hu2016). The PCGs were aligned with MAFFT v7 (Katoh & Standley, Reference Katoh and Standley2013) using the default option for PCGs. Q-INS-I option, which considers the secondary structure, was used for rRNAs in the MAFFT web server (https://mafft.cbrc.jp/alignment/server/index.html). FigTree v1.4.3 (http://tree.bio. ed.ac.uk/software/figtree/) was used to illustrate phylogenetic trees.
Mitogenome sequences used in this study. Bold indicates the sequence identified in this study

aThe classifications are after Schmelz et al. (Reference Schmelz, Erséus, Martin, Van Haaren and Timm2021) for oligochaetes, Tessler et al. (Reference Tessler, de Carle, Voiklis, Gresham, Neumann, Cios and Siddall2018) for hirudineans and Struck (Reference Struck, Purschke, Böggemann and Westheide2019) for polychaetes. bQuotation marks indicate that species were possibly erroneously identified and should be species of Whitmania (Ye et al., Reference Ye, Liu, Zhu and You2015). cJames (Reference James2012). dGoto et al. (Reference Goto, Monnington, Sciberras, Hirabayashi and Rouse2020).
The gene orders of the ingroup were mapped on the cladogram of nucPt to compare gene orders, including PCGs, rRNAs and tRNAs. Species whose mitogenomes were partially determined were excluded from mapping. The trnR of Perionyx excavatus (EF494507) was not annotated and detected with ARAGORN (base 5856 to 5915) (Laslett & Canback, Reference Laslett and Canback2004).
Results
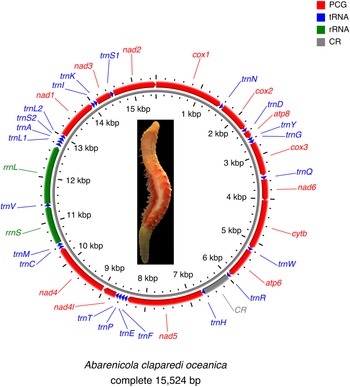
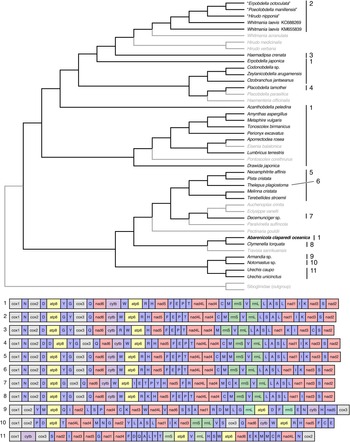
The mitogenome of Abarenicola claparedi oceanica was circular and consisted of 15,524 bp. The mitogenome included 13 PCGs (atp6 and atp8, cox1–cox3, cytb, nad1–nad6 and nad4l), 22 tRNA genes (one for each of the amino acids except for trnL and trnS) and 2 rRNA genes (rrnS or 12S rRNA and rrnL or 16S rRNA) (Figure 1 and Table 2). All determined genes were encoded on the ‘ + ’ strand (Figure 1). Non-coding region (621 bp) between trnR and trnH with high A + T content (79.6%) was a putative control region. GC skew of all genes was negative, indicating that C outnumbered G, while AT skew was largely negative or almost zero except for cox2, rrnL and rrnS (Table 3). The gene order, including the tRNAs of A. claparedi oceanica, was the same as that observed in various lineages in Sedentaria (Bleidorn et al., Reference Bleidorn, Podsiadlowski, Zhong, Eeckhaut, Hartmann, Halanych and Tiedemann2009; Oceguera-Figueroa et al., Reference Oceguera-Figueroa, Manzano-Marín, Kvist, Moya, Siddall and Latorre2016) (Figures 2 and 3).
Gene map of the mitochondrial genome of Abarenicola claparedi oceanica. The photograph shows A. claparedi oceanica. Red: protein-coding genes, blue: transfer RNAs, green: ribosomal RNAs, grey: control region.

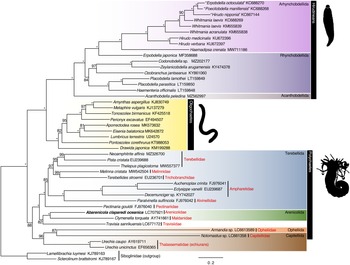
Maximum likelihood phylogeny of a subset of Sedentaria based on the dataset, including the nucleotide sequences of 13 protein-coding genes (PCGs) after ambiguous positions were excluded (10,938 characters; nucPt). Numbers above the branches represent the maximum likelihood bootstrap values (BS). Asterisks indicate the branches with BS = 100%. Abarenicola claparedi oceanica, whose nucleotide sequence is newly obtained, is shown in bold. Illustrations: Pontoscolex corethrurus (oligochaetes) and an unassigned hirudinean, obtained from phylopic.org, and a schematic illustration of Terebellidae (polychaetes).

Comparison of the gene orders of the ingroup based on the phylogenetic tree shown in Figure 2. The species with partial mitogenomes are not related (species names and branches shown in grey). Abarenicola claparedi oceanica, whose nucleotide sequence is newly obtained, is shown in bold.

Summary of the mitogenome of Abarenicola claparedi oceanica

Nucleotide composition (%) of 13 protein-coding genes, ribosomal RNAs, control region and the skewness of Abarenicola claparedi oceanica

The analyses based on each dataset (nucleotide sequences of PCGs, nucleotide sequences of PCGs and rRNAs and amino acids) yielded different tree topologies. In contrast, the exclusion of ambiguously aligned positions had little effect on the topology (Figures 2 and S1–S5). In all phylogenetic analyses, A. claparedi oceanica was clustered with Clymenella torquata (Maldanidae) (bootstrap values, BS = 100% in nucleotide datasets and 85%/95% in aaP/aaPt). The monophyly of the Terebellida, Arenicolida and Travisiidae clade was supported in all analyses, although the phylogenetic relationships in this clade differed between analyses. Travisia sanrikuensis was clustered with Arenicolida in nucP (BS = 84%), nucPt (BS = 82%) and aaP/aaPt (BS < 50%), whereas this species was sister to the Arenicolida and Terebellida clade in nucPR (BS = 79%) and nucPRt (BS = 97%) and was clustered with Capitellidae and Opheliidae clade in the phylogeny based on the RY-coding (BS = 94%) (Figures 4 and S6). Pectinariidae was sister to the other Terebellida species in all analyses except for the analysis based on the RY-coding. Terebellidae was not monophyletic in the analyses based on the amino acid sequences. However, the support values for the position of terebellid species were low, Thelepus plagiostoma was clustered with the Ampharetidae and Alvinellidae clade (BS = 71% in aaP and 69% in aaPt) and the other two terebellids (Neoamphitrite affinis and Pista cristata) were sister to the Melinnidae and Trichobranchidae clade (BS = 70% in aaP and 68% in aaPt) (Figure 4C). Monophyletic Terebellidae has clustered with the Melinnidae and Trichobranchidae clade. The clade, including these three families, was clustered with Ampharetidae and Alvinellidae in the analyses based on nucleotide sequences with generally high support values (BS = 76–97%). A phylogenetic analysis based on the RY-coding resulted in a different topology from the other analyses (Figure 5 and S6). The BS values were generally low in Terebellida except for the Ampharetidae and Alvinellidae clade (BS = 100%) and the N. affinis and P. cristata clade (BS = 98%).
Schematic cladograms of the phylogenetic relationship between the families in the Terebellida + Arenicolida + Travisiidae clade as suggested by the maximum likelihood phylogenetic analyses in this study. (A) The nucleotide sequence of protein-coding genes (nucP) and after trimming ambiguously aligned positions (nucPt), (B) nucleotide sequences of PCGs and ribosomal RNAs (nucPR) and after trimming (nucPRt) and (C) amino acid sequences of PCGs (aaP) and after trimming (aaPt). Numbers above the branches represent the maximum likelihood bootstrap values (BS). The order of BS corresponds to each heading. Figures 2 and S1–S5 show the whole phylogenetic trees. BS on the branch of Terebellidae in (A) and (B) indicates BS for three terebellid species. Species names show the paraphyletic Terebellidae in (C). Asterisks indicate the branches with BS = 100%.

Schematic cladogram of the phylogenetic relationship of Terebellida suggested by the maximum likelihood phylogeny based on the RY-coding of the nucleotide sequences of protein-coding genes (PCGs). Species names represent the paraphyletic Terebellidae. The numbers above the branches represent the maximum likelihood bootstrap values (BS).

The phylogenetic relationships of other clades (echiurans + Capitellidae + Opheliidae, hirudineans and oligochaetes) remained broadly stable between analyses. Thalassematidae (echiurans) was sister to the Capitellidae and Opheliidae clade (BS = 96–100%). The position of Thalassematidae was not resolved in the phylogenetic analysis based on the RY-coding, whereas Capitellidae and Opheliidae were monophyletic with full support (Figure S6). In the hirudinean clade, Acanthobdellidae was sister to the clade consisting of monophyletic Rhynchobdellida (Glossiphoniidae was clustered with the Piscicolidae and Ozobranchidae clade) (BS = 79–100%) and monophyletic Arhynchobdellida (Erpobdellidae and Hirudinidae) (BS = 100%). In oligochaetes, Rhinodrilidae was clustered with Moniligastridae and Crassiclitellata (Megascolecidae and Lumbricidae) clade (BS = 70–100%).
Discussion
This is the first study to determine the mitogenome sequence of Arenicolidae using Abarenicola claparedi oceanica and perform phylogenetic analyses using closely related families registered in GenBank. Using previously published mitogenome data (Bolbat et al., Reference Bolbat, Matveenko, Dzyuba and Kaygorodova2021; Nam et al., Reference Nam, Park, Kim, Kim and Rhee2021; Kobayashi et al., Reference Kobayashi, Itoh and Kojima2022a, Reference Kobayashi, Itoh and Nakajima2022b), mitogenomic phylogenetic trees were reconstructed with the most inclusive taxon sampling of the part of the Sedentaria families (oligochaetes, hirudineans, echiurans and some polychaetes). Analyses based on the nucleotide sequences confirmed the monophyly of Terebellidae, which was paraphyletic in analyses based on the amino acid sequences and previous mitogenomic phylogenies.
The mitogenome of Abarenicola claparedi oceanica is similar to the mitogenome of several lineages of Sedentaria with respect to the genes and gene order, including the tRNAs. Although this gene order is conserved in the lineages of Sedentaria, such as Megascolecidae and Moniligastridae (oligochaetes), Erpobdellidae and Ozobranchidae (hirudineans) and Siboglinidae (Bleidorn et al., Reference Bleidorn, Podsiadlowski, Zhong, Eeckhaut, Hartmann, Halanych and Tiedemann2009; Oceguera-Figueroa et al., Reference Oceguera-Figueroa, Manzano-Marín, Kvist, Moya, Siddall and Latorre2016), the present study is the first in the Terebellida + Arenicolida + Travisiidae clade. This finding supports that this gene order was conserved in the ancestral lineage of Sedentaria because a common origin and the subsequent changes of the gene order in each lineage are more parsimonious than obtaining the same gene order in multiple lineages independently. The gene order of Clymenella torquata (Maldanidae), which was clustered with A. claparedi oceanica in the phylogenetic analysis in this study, differed in trnK located between the trnR and trnH (Jennings and Halanych, Reference Jennings and Halanych2005). The gene order of C. torquata may therefore be uniquely obtained in this species or the ancestor of Maldanidae.
The sister relationship of Arenicolidae and Maldanidae established in this study has been well understood (Bartolomaeus & Meyer, Reference Bartolomaeus and Meyer1997; Bleidorn et al., Reference Bleidorn, Vogt and Bartolomaeus2005; Struck et al., Reference Struck, Schult, Kusen, Hickman, Bleidorn, McHugh and Halanych2007). The phylogenetic relationship of Terebellida, namely, the Ampharetidae + Alvinellidae clade, the Trichobranchidae + Terebellidae + Melinnidae clade and Pectinariidae, showed similar results to the transcriptome analyses (Stiller et al., Reference Stiller, Tilic, Rousset, Pleijel and Rouse2020) except for Terebellidae, which was sister to the Trichobranchidae and Melinnidae clade in this study. However, Trichobranchidae was sister to the Terebellidae and Melinnidae clade in Stiller et al. (Reference Stiller, Tilic, Rousset, Pleijel and Rouse2020). Although the close relationship between Terebellidae and Trichobranchidae recovered in mitogenomic phylogeny was suggested to be due to compositional bias in the mitogenomes of the Ampharetidae and Alvinellidae (Zhong et al., Reference Zhong, Hansen, Nesnidal, Golombek, Halanych and Struck2011), phylogeny based on transcriptomes also supported that Trichobranchidae is more close to Terebellidae than Ampharetidae or Alvinellidae (Stiller et al., Reference Stiller, Tilic, Rousset, Pleijel and Rouse2020). Zhong et al. (Reference Zhong, Hansen, Nesnidal, Golombek, Halanych and Struck2011) stated that the compositional bias in the mitogenome of Ampharetidae and Alvinellidae influences the phylogenetic relationships of Terebellidae and Trichobranchidae. They conclude that no approach completely ameliorated the influence of bias, although the phylogenetic analysis based on the RY-coding was suggested as the most effective strategy in their analyses. Unfortunately, the support values of the phylogenetic analysis based on the RY-coding were generally low in the present study. This method did not sufficiently resolve the phylogenetic relationship in Terebellida. The paraphyletic status of Terebellidae in mitogenomic phylogeny was suggested by the phylogeny based on the nucleotide sequences of PCGs in Nam et al. (Reference Nam, Park, Kim, Kim and Rhee2021) and by the phylogeny based on the amino acid sequences in Kobayashi et al. (Reference Kobayashi, Itoh and Nakajima2022b). In the present analyses, although Terebellidae was paraphyletic in analyses based on amino acid sequences, it was monophyletic with high support values in analyses based on nucleotide sequences.
A previous study on the mitogenomic phylogeny indicated a close relationship between Travisiidae and the Terebellida and Arenicolida clade (Kobayashi et al., Reference Kobayashi, Itoh and Kojima2022a). However, the phylogenetic position was not sufficiently clarified as the position of Travisiidae was poorly supported. The precise placement of Travisiidae was still ambiguous in the present analyses, which are more inclusive than the previous mitogenomic phylogenetic studies due to the addition of at least four polychaete families (Arenicolidae, Capitellidae, Melinnidae and Opheliidae) to the dataset of Kobayashi et al. (Reference Kobayashi, Itoh and Nakajima2022b). Scalibregmatidae was represented as the sister family of Travisiidae based on the molecular phylogenetic analyses (Persson & Pleijel, Reference Persson and Pleijel2005; Paul et al., Reference Paul, Halanych, Tiedemann and Bleidorn2010; Law et al., Reference Law, Dorgan and Rouse2014; see Blake & Maciolek, Reference Blake, Maciolek, Purschke, Böggemann and Westheide2020 for review on taxonomic status of Travisiidae), and Scalibregmatidae showed a sister relationship to the Arenicolida and Terebellida clade in the phylogenetic analysis based on transcriptomes (Helm et al., Reference Helm, Beckers, Bartolomaeus, Drukewitz, Kourtesis, Weigert, Purschke, Worsaae, Struck and Bleidorn2018; Martín-Durán et al., Reference Martín-Durán, Vellutini, Marlétaz, Cetrangolo, Cvetesic, Thiel, Henriet, Grau-Bové, Carrillo-Baltodano, Gu, Kerbl, Marquez, Bekkouche, Chourrout, Gómez-Skarmeta, Irimia, Lenhard, Worsaae and Hejnol2021). These results suggest that Travisiidae is one of the early-branching lineages in the Terebellida and Arenicolida clade.
The results of this study support the monophyly of both Arhynchobdellida and Rhynchobdellida. The phylogenetic relationship of hirudineans was contentious as the results were not congruent (Martin, Reference Martin2001; Rousset et al., Reference Rousset, Plaisance, Erséus, Siddall and Rouse2008; Tessler et al., Reference Tessler, de Carle, Voiklis, Gresham, Neumann, Cios and Siddall2018). For example, the Rhynchobdellida (proboscis-bearing leeches) was paraphyletic; Glossiphoniidae (Rhynchobdellida) was clustered with Arhynchobdellida (leeches without proboscis), not with Rhynchobdellida (Ozobranchidae and Piscicolidae) (Tessler et al., Reference Tessler, de Carle, Voiklis, Gresham, Neumann, Cios and Siddall2018). Moreover, the mitogenomic studies with limited taxon sampling of annelids showed the paraphyletic status of Rhynchobdellida (Wang et al., Reference Wang, Huang, Wang and Fu2018; Sosa-Jiménez et al., Reference Sosa-Jiménez, Torres-Carrera, Manzano-Marín, Kvist and Oceguera-Figueroa2020). These results were consistent with the paraphyly of Rhynchobdellida. Contrarily, the phylogenetic analysis based on the mitogenomes (Bolbat et al., Reference Bolbat, Vasiliev and Kaygorodova2020, Reference Bolbat, Matveenko, Dzyuba and Kaygorodova2021), anchored hybrid enrichment (Phillips et al., Reference Phillips, Dornburg, Zapfe, Anderson, James, Erséus, Moriarty Lemmon, Lemmon and Williams2019) and transcriptomes (Erséus et al., Reference Erséus, Williams, Horn, Halanych, Santos, James, Creuzé and Anderson2020) with more taxon sampling revealed the sister relationship between Glossiphoniidae and Oceanobdelliformes (only Piscicolidae in Erséus et al. (Reference Erséus, Williams, Horn, Halanych, Santos, James, Creuzé and Anderson2020)) and thus the monophyly of Rhynchobdellida. However, the number of the Arhynchobdellida families is still limited in the phylogenomic studies therefore further taxon sampling would be required to conclude the monophyly of hirudinean orders.
Supplementary material
The supplementary material for this article can be found at https://doi.org/10.1017/S0025315422001035
Acknowledgements
We are grateful to Hirokazu Abe (Ishinomaki Senshu University) and Shinri Tomioka (Rishiri Town Museum) for their help in collecting the specimen; Tomoyuki Nakano and Ryutaro Goto (Kyoto University) for their help in using the facilities at the Seto Marine Biological Laboratory, the Field Science Education and Research Center, Kyoto University; and two anonymous reviewers for their invaluable comments on the earlier draft.
Financial support
This work was supported by the Project for the Promotion of Environmental Genomics Studies by NIES (grant number 1620AQ007) and by JSPS KAKENHI (grant number JP22K15174).
Data availability
The mitogenome sequence of Abarenicola claparedi oceanica is available in GenBank under the accession no. LC707921. The raw reads were registered at the NCBI repository (DRA013990, PRJDB13458 and SAMD00467651).