
Introduction
Rutile-structured solid solutions are of crystal chemical interest and have applications in high-pressure research and earth science [Reference Ren, Fei, Yang and Bai1, Reference Gullikson, Leinenweber, Stoyanov, Zhang and Malik2, Reference Kulik, Nishiyama, Masuno, Zubavichus, Murzin, Khramov, Yamada, Ohfuji, Wille, Irifune and Katsura3, Reference Leinenweber, Gullikson, Stoyanov and Malik4]. In one example, SiO2 was found to have a limited but definite solubility in rutile (TiO2) at high pressure, up to 3.8 wt% at 23 GPa and 1800 °C [Reference Ren, Fei, Yang and Bai1]. Further solubility seems to be limited by the large size difference between Si and Ti. This solid solution has found application in finding the pressures and temperatures in kimberlites and other volcanic rocks, using the quantity of SiO2 dissolved in rutile.
To extend the range of possible solid solutions, the extreme size difference between Ti and Si can be mitigated by choosing an intermediate-sized cation, Ge, and this results in a continuous series from Ti all the way to Si, with Ge as the intermediary. A solid solution between argutite (GeO2) and stishovite (SiO2) has been studied by Gullikson et al. [Reference Gullikson, Leinenweber, Stoyanov, Zhang and Malik2] and Kulik et al. [Reference Kulik, Nishiyama, Masuno, Zubavichus, Murzin, Khramov, Yamada, Ohfuji, Wille, Irifune and Katsura3]. Significant amounts of silica enter the GeO2 phase at 1200–1500 °C and pressures above 3–4 GPa, [Reference Gullikson, Leinenweber, Stoyanov, Zhang and Malik2] and a full solid solution is achieved at a critical line near 1600 °C at 12 GPa [Reference Kulik, Nishiyama, Masuno, Zubavichus, Murzin, Khramov, Yamada, Ohfuji, Wille, Irifune and Katsura3]. This system has found its application as a pressure standard for high-pressure experiments [Reference Leinenweber, Gullikson, Stoyanov and Malik4].
In the current study, it was desired to develop a temperature standard for high-pressure research to go along with the previously developed pressure standard. EPMA measurements on geothermometers [Reference Schilling and Wunder5] and the rate of formation of a layer of MgAl2O4 spinel layer between layers of MgO and Al2O3 [Reference Watson, Wark, Price and Van Orman6, Reference van Westrenen, Van Orman, Watson, Fei and Watson7] have been used for measuring thermal gradients in high-pressure experiments. Thermal gradients have also been calculated using thermal modeling [Reference Schilling and Wunder5, Reference Hernlund, Leinenweber, Locke and Tyburczy8]. The current study was based on the continuing need for an accurate temperature sensor that can be analyzed by X-ray diffraction or Raman spectroscopy and rapid and simple techniques appropriate for high-pressure production facilities as well as for academic high-pressure laboratories. In such a standard, the phases should be simple structures (cubic, hexagonal, or tetragonal) for X-ray or contain substituting atoms of variable mass on noncentrosymmetric sites for Raman. Because the detection of phase separation near the critical point is more difficult, the critical point of the solvus should lie about 100–200 °C above the maximum temperature of interest, where the two coexisting phases are more easily distinguished, and the measurable range below this temperature should span some 500° C to cover a useful range for gradient measurements. Both pressure and temperature effects on the extent of solid solution are desirable to know. For X-ray application, the lattice parameters of the coexisting solutions need to be different enough that the peaks appear as “doublets,” each member of which defines one side of the solvus. The bulk composition should be chosen to lie near the critical point of the solvus so that both X-ray peaks appear over the widest range of temperatures.
Based on a promising phase diagram showing two rutile solid solutions with a solvus at ambient pressure [Reference Sarver9], and on the easily measurable difference in lattice parameters when Ti substitutes for Ge, we chose to test and calibrate the system GeO2–TiO2 as a temperature sensor between 4 and 7 GPa and from 1000 to 1600 °C. Although at ambient pressure the solid solutions are limited and the solvus is terminated by melting in a “rabbit ears” type phase diagram [Reference Sarver9], we found that at high pressure the melting temperatures increase more than the solvus critical point temperature, and thus, the full solvus becomes accessible. The exploration of the binary system and the P–T–X surface of the solvus are described here.
Results and discussion
Experimental points and model
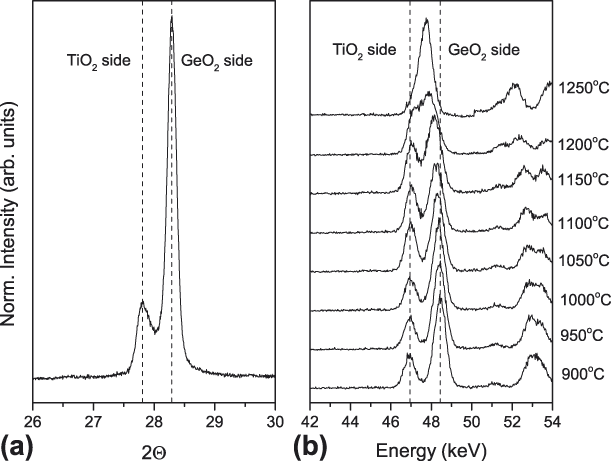
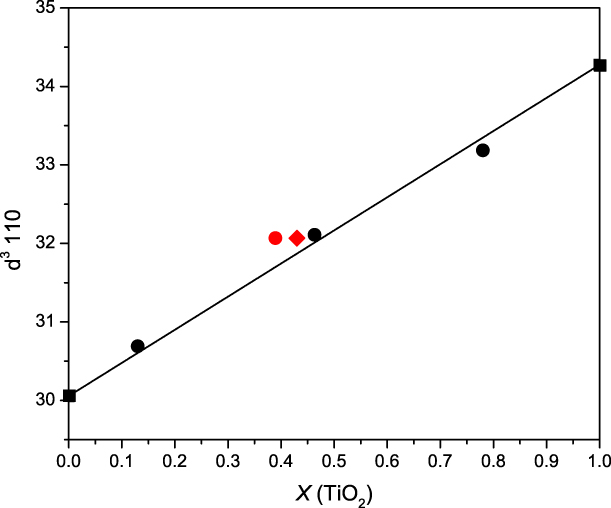
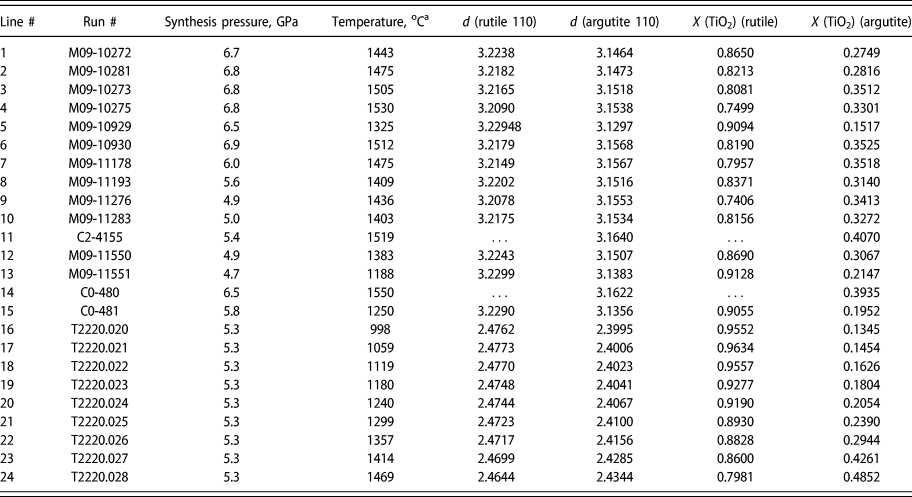
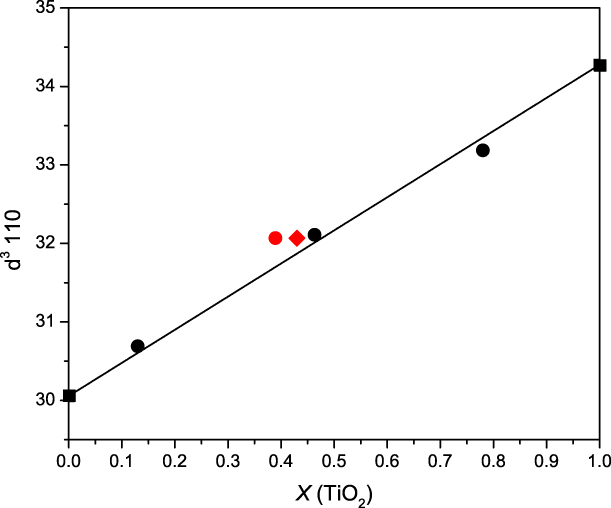
The degree of phase separation was analyzed using the (110) peak of rutile, which showed clear peak splitting in all of the lower-temperature experiments, with two peaks moving closer together and then merging into one peak at higher temperatures in both the quench and in situ experiments (Fig. 1). The cube of this d-spacing was used as a proxy for molar composition, a practice that is supported by a combination of EPMA data on multianvil runs from ASU and the single crystal study of an intermediate composition [Reference Stoyanov, Leinenweber, Groy and Malik10]. The experimental details on the sample synthesis and analytical techniques used in this study can be found in the Experimental methods section located at the end of the article. Figure 2 shows data on the cube of the (110) d-spacing versus mole fraction derived from EPMA data and site occupancy in the single crystal. This procedure allows for rapid analysis of the temperature standard in practice. The raw data from both the quench and in situ experiments, collected using the methods described in the Experimental section, is shown in Table I.
(a) X-ray data from a GeO2–TiO2 sample recovered from an experiment in the Cubic press at Hyperion (run #M09-11276, thermocouple temperature 1436 °C), showing the doublet in the 110 X-ray diffraction peak. The left peak is from the rutile with dissolved GeO2, whereas the right peak is from the argutite with dissolved TiO2. (b) Energy-dispersive data from the beamline experiment at GSECARS, showing the same behavior in situ. The 110 doublet appears at lower temperature but converges to a single peak at higher temperature.

Data on the composition of solid solutions in this study versus the cube of the 110 d-spacing for the rutile unit cell. The squares show the values for the end-members using previously published information [Reference Gullikson, Leinenweber, Stoyanov, Zhang and Malik2, Reference Gerward and Olsen16], with a reference line connecting them. The black dots are from EPMA data from a phase-separated run (ASU G-266) and a single-phase product (ASU G-249). The red symbols are from single crystals of Hyperion run C2-4224. The red circle is from EPMA data and the red diamond is from site occupancies in a single-crystal X-ray diffraction study [Reference Stoyanov, Haussermann and Leinenweber12]. The data demonstrate that the assumption of linearity between the two end-members is valid within the resolution of the data.
d-spacings and the mole fraction X (TiO2) of the two coexisting solid solutions in the GeO2–TiO2 system. Samples on lines 1–15: the raw data and derived mole fractions from quench experiments performed at Hyperion Materials & Technologies.a Samples on lines 16–24: the raw data and the derived mole fractions from the in situ experiment performed at GSECARS, Advanced Photon Source.b Points #11 and 14 were near or above the solvus and only the bulk composition phase (∼Ti0.4Ge0.6O2) was observed. Point 24 was 50° lower and a small amount of the Ti-rich phase was still present and both phases are shown in the table for that point. The GeO2-rich phase at this temperature is only 8 mol% different from the bulk composition.

a The temperatures in the Hyperion Materials & Technologies experiments were measured directly using a thermocouple located at the furnace center between the sample and the GeO2–SiO2 pressure standard.
b For all the T2220 data points from the beamline experiment, temperature corrections for the thermal gradient from the thermocouple to the GSECARS samples were applied. The corrections are on the order of +15% for all the temperatures relative to ambient temperature.
When the data are plotted in raw form, binning together all the results from different pressures, the points suggest a miscibility gap, but there is significant noise in the points. This noise is reduced considerably by applying a constant pressure correction (or projection to a constant pressure), z, of 60 ± 5 °C per GPa to all of the data points. This is equivalent to stating that the entire solvus changes in temperature by 60 ± 5 °C for each 1 GPa pressure increase. Such a change can be viewed as a result of the energetic effects of the “misfit” between Ge and Ti increasing with pressure. The derived temperatures for all the points are corrected to 6.6 GPa for the purpose of plotting them all in one T–X diagram and for fitting the Margules parameters. The temperature correction for pressure is a parameter of the model—the model for fitting the solvus uses a pressure-corrected temperature T corr, where
 $${T_{{\rm{corr}}}} = T + z\left( {P - 6.6} \right)\quad .$$
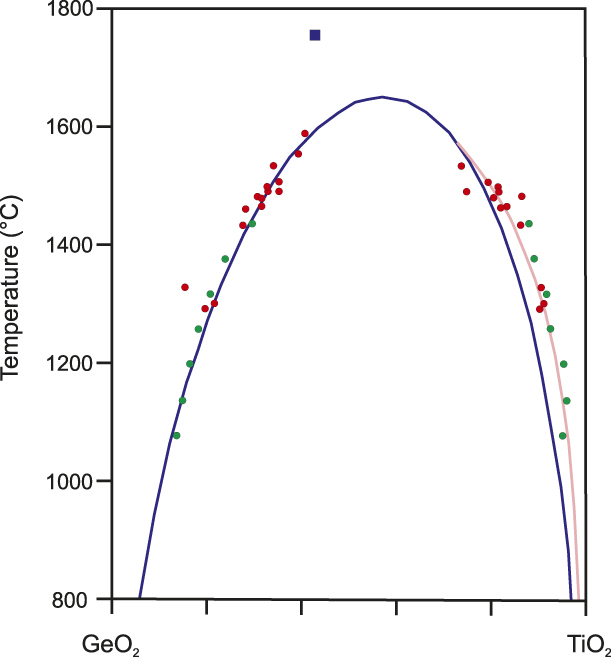
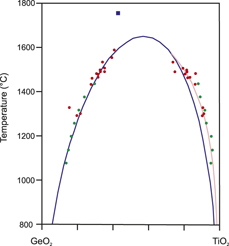
The points derived in this way, both from the quench experiments and the in situ experiments, fall along a very clean solvus line (Fig. 3). The solvus line shows distinct asymmetry, with the critical point occurring near 60% TiO2 (Table II).
The fit to the left side of the solvus using the Margules formulation (blue line) and the right side of the solvus using an exponential fit (pink line). Points from quench experiments at Hyperion are shown in red and from the in situ experiment at GSECARS in green. The blue square shows the synthesis condition for the single-phase disordered crystals described in the structure report of Stoyanov et al. [Reference Stoyanov, Leinenweber, Groy and Malik10]. The range of uncertainty in composition derived from d-spacings is estimated to be 5 mol%.

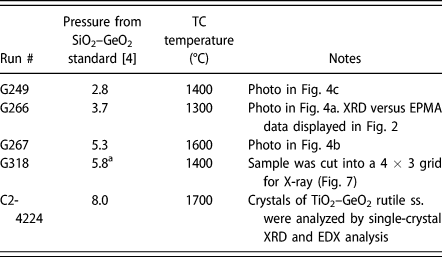
Selected runs referenced herein from a total of 24 runs on the TiO2–GeO2 system performed in a Kawai device (Little Green) at Arizona State University and one run (C2-4224) at Hyperion Materials & Technologies.
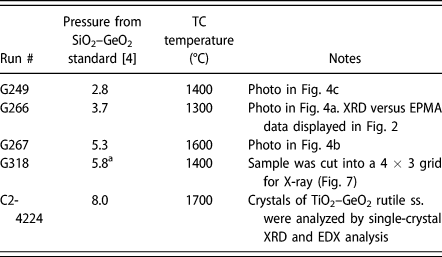
a No pressure standard was used–the pressure is derived from the calibration of the multianvil cell assembly [Reference Stoyanov, Haussermann and Leinenweber12].
To fit the data to a model solvus, the points were used to constrain solid solution models. A Margules formulation was tested first. This formulation is written explicitly in terms of Gibbs free energy of the solid solution:
 $$G = RT\left( {{X_{\rm{A}}}\ln {X_{\rm{A}}} + {X_{\rm{B}}}\ln {X_{\rm{B}}}} \right) + \left( {{\rm{W}}{{\rm{G}}_{21}} \times {X_{\rm{B}}} + {\rm{W}}{{\rm{G}}_{12}} \times {X_{\rm{A}}}} \right) \times {X_{\rm{A}}} \times {X_{\rm{B}}}\quad .$$
The first term is the ideal solution entropy, whereas the second term is the nonideal contribution, using Margules parameters—X A is the mole fraction of component A and X B is the mole fraction of component B. Two Margules parameters, WG21 and WG12, are included here because the experimental data indicate that the solvus is asymmetric, requiring two parameters. This type of system is treated exhaustively in Douce [Reference Douce11], and we are using the same symbols here. Because in their treatment they choose the lesser component at the critical point as component B and the greater as component A, we have chosen to label the system as GeO2–TiO2 (i.e., selected GeO2 as component A and TiO2 as component B). Then all the formulas in Douce [Reference Douce11] strictly apply.
The function for G expressed in Eq. (1) contains one minimum for each composition above the critical point of the solvus and two minima with a common tangent line below the critical point and within the solvus. The two compositions at the common tangent points represent the compositions along the solvus. The equations determining the two sides of the solvus do not have a closed-form solution; so we developed an iterative numerical procedure to determine the compositions along the solvus for each temperature. The temperature and composition at the critical point do have a closed-form solution, which is derived in the treatment by Douce. The calculation can be compared with the experimental points to fit the experimental solvus to the model.
To do this, a residual function was constructed from the sum of squares of differences between the mole fractions of the model and the data. If X A,i are the experimental points along limb A of the solvus and X B,i are the experimental points along limb B, we calculated a residual function using the following prescription:
 $$\mathop \sum \limits_{i = 1}^{{n_{\rm{A}}}} {{{{\left( {{X_{{\rm{A}},i}} - {X_{{\rm{calc}}}}} \right)}^2}} \over n} + \mathop \sum \limits_{i = {n_{\rm{A}}} + 1}^n {{{{\left( {{X_{{\rm{B}},i}} - {X_{{\rm{calc}}}}} \right)}^2}} \over n}\quad .$$
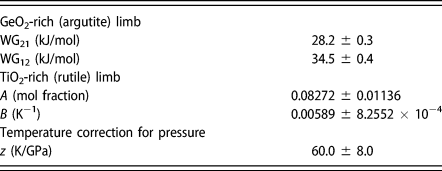
We used a total of 22 experimental points for the fitting. The parameters thus obtained are shown in Table III. The Margules function was found to fit quite well to the GeO2-rich limb of the solvus, which has higher solubility. However, that function was not able to fit the TiO2-rich limb as well. The critical temperature for the Margules function at 6.6 GPa was 1628 °C and the critical composition is near 57% TiO2. The residual in this case is 1.27%.
Parameters used in modeling the limbs of the solvus between two rutile phases in the GeO2–TiO2 system (see text for an explanation of the symbols).
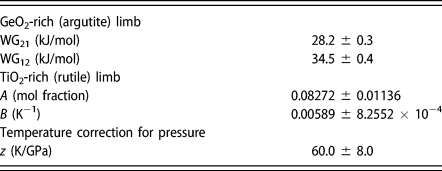
The data on the GeO2-rich limb were better represented by a simple exponential function
 $${X_{{\rm{Ti}}{{\rm{O}}_{\rm{2}}}}} = 1 - A{{\rm{e}}^{B\left( {T - 1600} \right)}}\quad .$$
The reasonable fit to this function implies that the solid solution on the TiO2-rich side is behaving like a Henry’s Law solution in which an excess entropy of the solution is the main determinant of the temperature dependence, with little or no contribution from excess enthalpy [Reference Leinenweber, Gullikson, Stoyanov and Malik4]. To provide the best fit to the whole dataset, then, the Margules formulation is used for the TiO2 side, which has higher solubility, and a Henry’s Law solution for the GeO2 side, which has the lower solubility. The residual improved to 1.13%. Both the Margules function and the exponential are shown in Fig. 3 along with the 22 data points.
Example from experiments in a Kawai-type multianvil
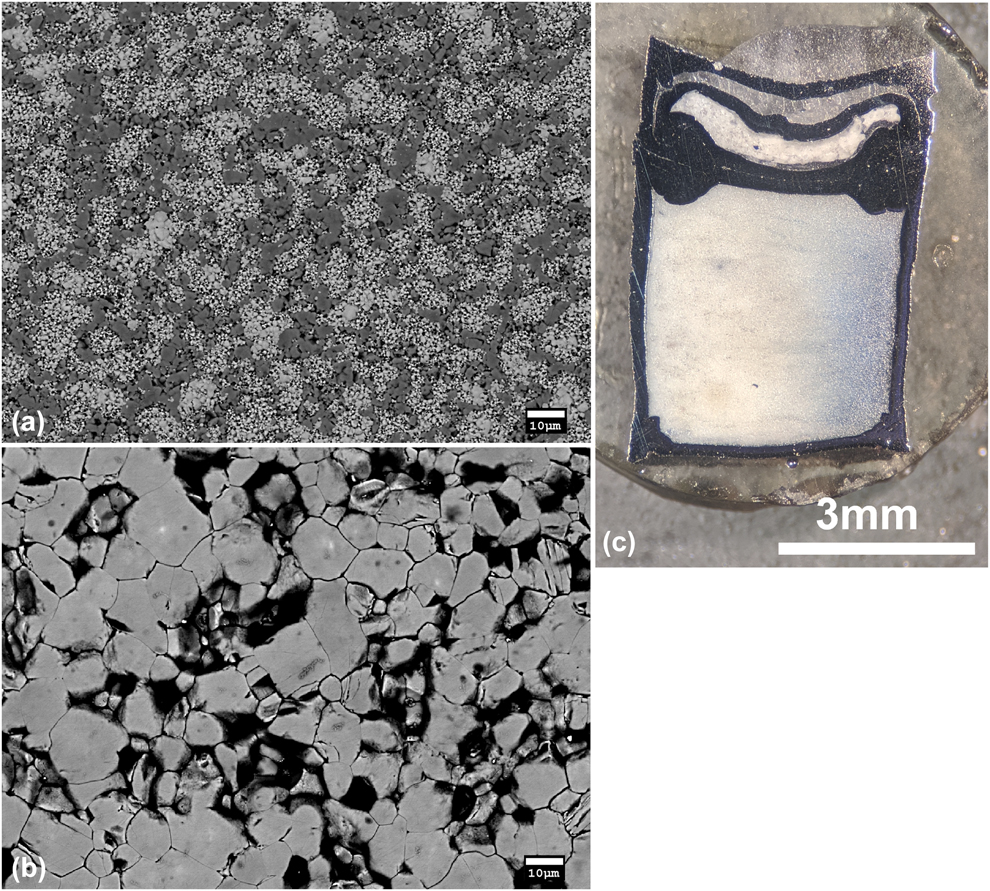
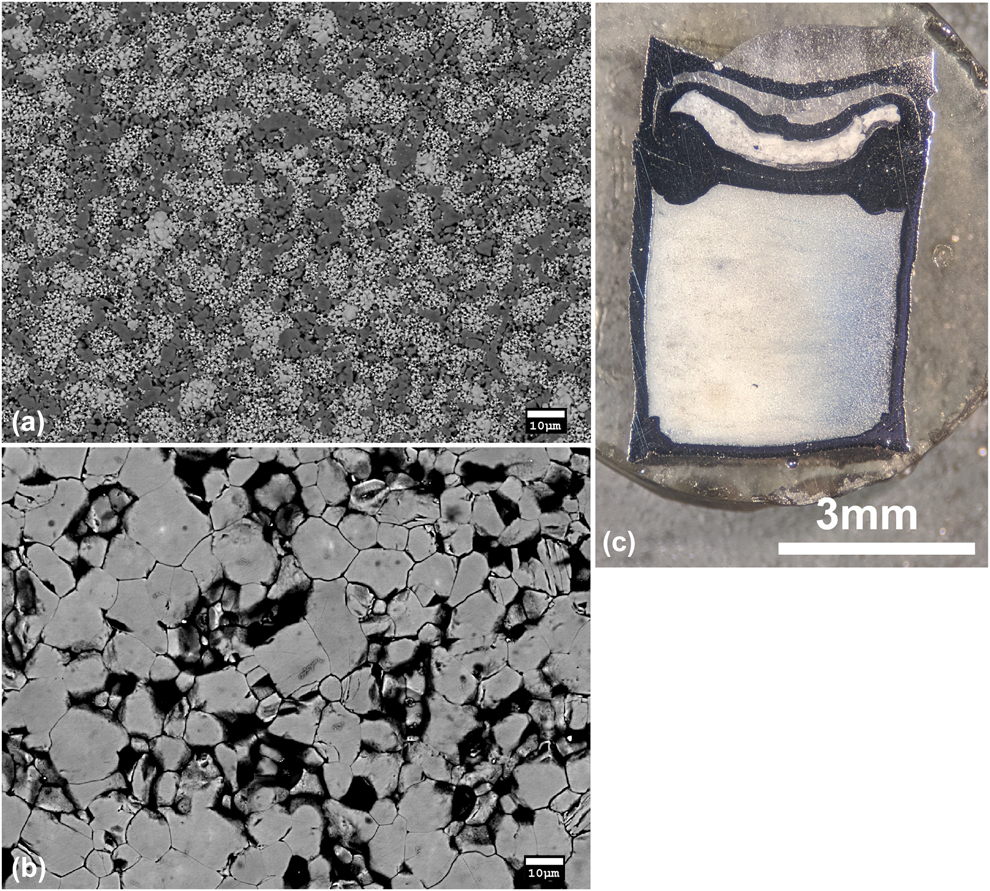
Although the initial exploration on this system and the verification of the immiscible behavior were performed using a Kawai-type multianvil device at ASU Table II, the data from those experiments were not used in the final calibration. We found that the system was so temperature sensitive that the thermal gradients in the small Kawai-type cell caused considerable uncertainty in the location of the solvus, especially by bulk X-ray measurement. The X-ray peaks for the bulk samples consisted of an average of the different regions and tended to be highly broadened and misshapen. The separation was clearly observed in EPMA where the hottest regions were more uniform in composition and the coldest regions had greater phase separation between more Ge-rich crystals and more Ti-rich crystals. The phase-separated regions generally had finer grain sizes, coarsening with greater solid solution and often being very coarse for the complete solid solution. A typical example of the 2-phase texture observed in a cooler region is shown in Fig. 4(a), whereas the coarser, single-phase texture with the bulk composition of the starting material, for a hotter region is shown in Fig. 4(b). The thermal gradients implied by the textures were consistent from run to run in terms of their geometry relative to the experimental assembly (described in more detail below). We also noticed that the phase-separated areas at temperatures less than 1400 °C tended to be white in color in cut sample capsule sections and changed gradationally to blue color for the hotter, less phase-separated, or single-phase regions [Fig. 4(c)]. The color effect could be due to grain size or the presence of some Ti3+ in the more extensive solid solutions.
(a) A typical BSE image of a phase-separated region in sample ASU G-266. The darker regions correspond to a TiO2-rich phase and the brighter regions to a GeO2-rich phase. The GeO2-rich regions were more fine-grained than the TiO2-rich regions in all the examples studied. This sample had clear X-ray peak splittings due to the phase separation. (b) A higher temperature texture from sample ASU G-267. The grains are all from a single phase with a composition near the bulk composition of the starting material, and the grain size is much larger and more uniform. (c) A photograph of a sample (ASU run G-249) showing the color variation from blue to white due to the temperature gradient across the capsule. The blue area is an area with more extensive solid solutions (presumably with some reduction to Ti3+) that formed at a higher temperature, and the white area is an area with more exsolved solid solutions that formed at a lower temperature. The thermocouple was located at the bottom center of the capsule. The pressure standard is visible in a separate smaller capsule above and adjacent to the main capsule.
The measurement and calibration of the solvus was then undertaken using the much larger furnaces and high-pressure cells at Hyperion Materials & Technologies. In that case, the thermocouple, pressure standard, and sample are all located in a much more homogenous temperature region, and variations in the sample from one part to another were not observed. The X-ray peak shapes were improved and the separation between the two peaks was more clear in the uniform-temperature samples.
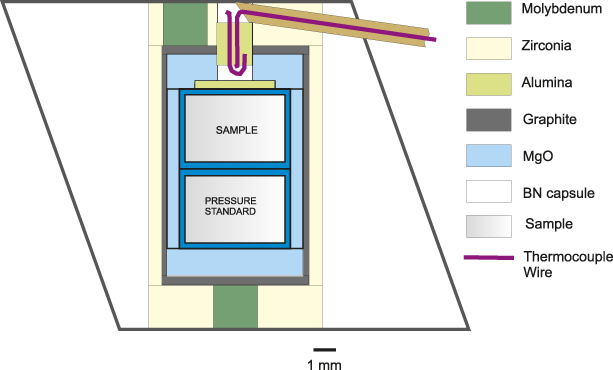
Our observation in the Kawai-type cell was very revealing because of the sensitivity of the sample to temperature differences. The design of the cell that was used is shown in Fig. 5 and is the same cell described in detail by Stoyanov et al. [Reference Stoyanov, Haussermann and Leinenweber12]. The gradients in sample compositions were visible in backscattered electron images on polished samples, which showed variations in the relative amounts and Z (average atomic number) contrast of the two coexisting solid solution phases from the colder parts of the sample to the hotter parts.
Drawing of the 18/12 assembly used in the experiments on the Kawai-type device at ASU. The black outline shows the octahedral pressure medium (MgO/Spinel).
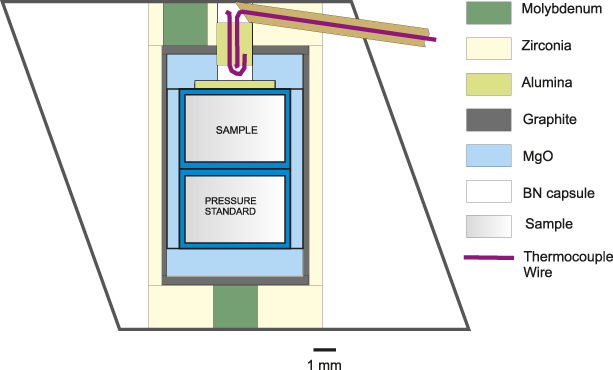
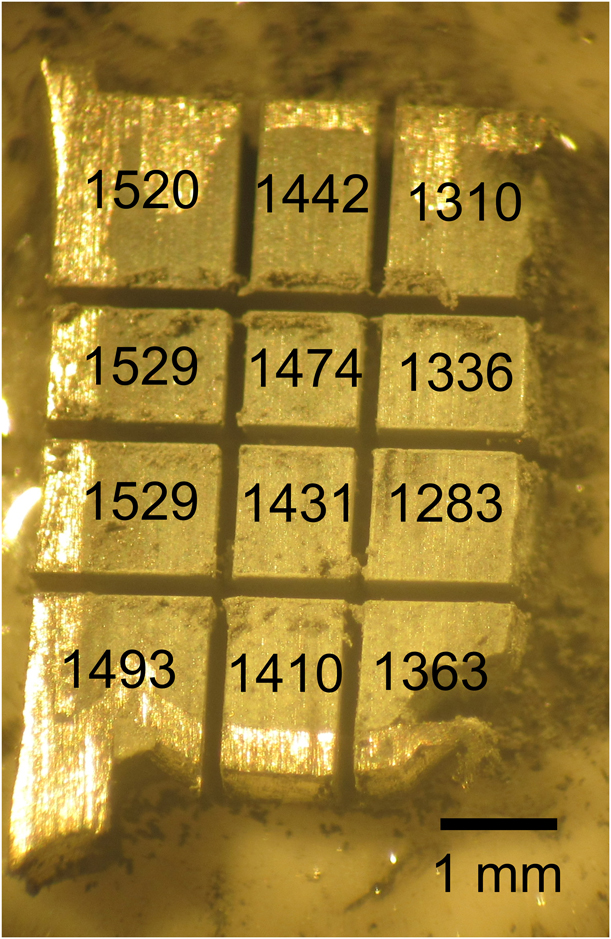
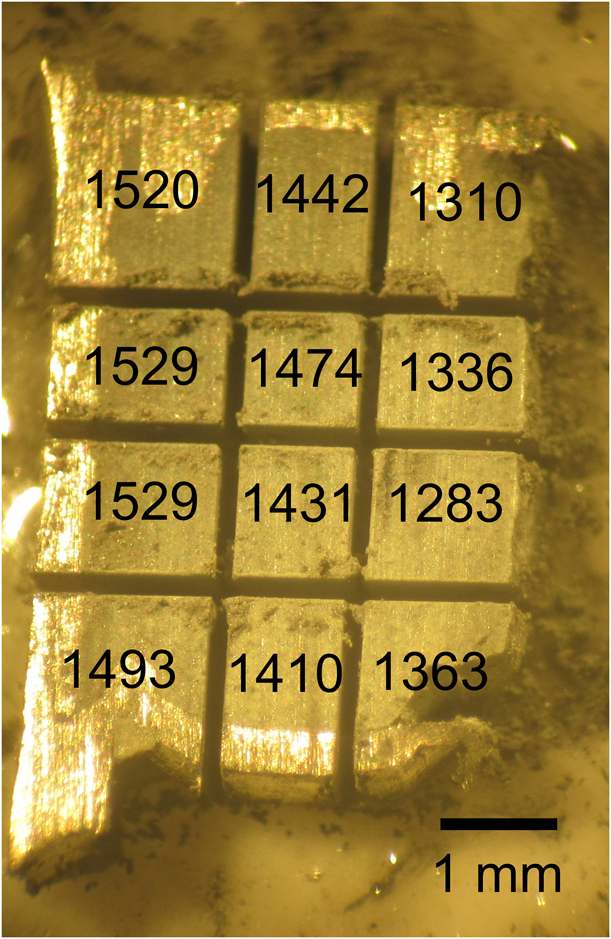
Once the solvus was characterized at Hyperion, we were able to go back and analyze the temperature profile of one of the samples from the Kawai-type cell used at ASU with X-ray diffraction techniques. The sample was chopped up into pieces using a wire saw, as shown in Fig. 6, and each small “brick” of the sample was X-rayed. The temperatures that were obtained for each “brick” are shown in Fig. 6. The conclusion is that the temperature in this cell is fairly uniform in the axial direction, but is variable in the radial direction from one side of the sample to the other (a “sideways” thermal gradient). The gradient is most visible when the sample is cut through the axial plane containing the top electrode of the cell assembly. As shown in Fig. 5, that electrode is placed off-center to allow the thermocouple to be placed in the center. The off-center placement of the electrode leads to the sideways nature of the thermal gradient because one side of the furnace is drawing more current than the other. The electrode on the opposite end of the furnace is located in the center, so the gradient is not as strong on that end.
View of the chopped-up Pt capsule and sample from the Kawai device (Run G-318) that were used to analyze temperature variations from one side of the capsule to the other using powder X-ray diffraction. The thermocouple temperature was 1400 °C and run duration was 2 h. The average temperature of each “brick” of the sample derived from XRD is displayed on the figure. The orientation of the capsule in this photograph is the same as in the diagram in Fig. 5, but in this case, the sample occupies the entire volume and there is no pressure standard. The hot region in the upper left is next to the off-center molybdenum electrical lead, and the cold region on the lower right is exactly opposite to it (the molybdenum lead at the bottom is located in the center).
Conclusions
The GeO2–TiO2 system was selected and analyzed as a possible temperature standard for high-pressure research between 4 and 7 GPa using X-ray diffraction on recovered samples as the probe. The equivalence of the samples recovered to ambient pressures, and the samples held under high pressure and temperature were verified using a single high-pressure in situ experiment with X-ray diffraction. Full solubility of GeO2 (argutite) and TiO2 (rutile) has been demonstrated for the first time. Based on the positions of the X-ray diffraction lines of the two coexisting solid solutions both in recovered samples and using in situ high pressure–temperature X-ray diffraction, the shape of the solvus is asymmetric and shows varying behavior: it is well-described by a Margules formulation on the GeO2-rich side, with a greater mutual solubility, whereas it is better described by an exponential function on the TiO2-rich side, with a lesser mutual solubility. The complete solid solution exists between 4 and 8 GPa above a critical line with the formula T c = 1623 + 60(P − 6.6). The critical point is not seen at ambient pressure because of melting, but it is consistent with the solubility of GeO2 in rutile seen in the 1-atm phase diagram below the melting point [Reference Sarver9].
An application of the system as a temperature sensor has been demonstrated in the 18/12 multianvil assembly. Surprisingly, it was found that the temperature varied more in the radial direction than the axial direction because of the breaking of radial symmetry by an off-center electrode. This falls outside of the past thermal modeling on high-pressure cells, which has always invoked radial symmetry. Rather than extending the models to full 3-dimensional symmetry, we suggest replacing the off-center electrode with a centered ring, which would bring the assembly back to being radially symmetric and within the current thermal modeling capabilities. In the future, this temperature sensor can be combined with thermal models to allow further understanding of the thermal profiles in any high-pressure assembly between 4 and 7 GPa pressure.
Experimental methods
Several different starting materials (precursors) were tested during the course of this study. The first series of experiments used a powder mixture of crystalline GeO2 and crystalline TiO2. Because of the limited kinetics of dissolution of the rutile throughout the duration of the experiments, part of it was detected unreacted in the recovered products. A second series were designed around the use of an attempted GeO2–TiO2 glass produced from the corresponding oxide powders with a starting molar ratio of 60:40 (Sem-Com Company, Toledo, Ohio) and quenched in water. The produced quenched melt contained grains of remnant crystalline TiO2 with about 8% GeO2, and the glass also suffered from GeO2 loss at high temperatures because of the high vapor pressure of GeO2 during its synthesis. The difficulties in obtaining a glass of the appropriate composition are consistent with the findings of Khan et al. [Reference Khan and Mohamed-Osman13] who reported the inability to produce high-quality glasses above a small percentage of TiO2 in GeO2. This unfortunately precluded the use of a glass precursor for this system. To shorten the reaction times under HPHT and eliminate the presence of unreacted rutile in the recovered post-HPHT samples, a third precursor material was made by replacing the crystalline rutile with nano-sized anatase (Alfa Aesar (Ward Hill, Massachusetts) 99.9%, 32 nm APS powder, lot #U12D005), whereas keeping the crystalline GeO2 (Sigma-Aldrich (St. Louis, Missouri) 99.998%, lot #MKCD8263). The powders of the two oxides were then blended in a 60:40 (GeO2:TiO2) molar ratio in isopropanol and dried under vacuum. This starting material was found to give the best reactivity, with only two phases present across the solvus, the clearest separation of the two phases, and the most symmetrical and narrow X-ray diffraction peaks in the recovered materials. Full Ge–Ti disorder in the solid solution was confirmed by single-crystal X-ray diffraction on an intermediate composition [Reference Stoyanov, Leinenweber, Groy and Malik10].
The first series of experiments to show the existence of the solvus were performed using a Kawai-type multianvil device at Arizona State University with an 18-mm octahedral assembly described elsewhere [Reference Stoyanov, Haussermann and Leinenweber12]. A graphite furnace and Pt capsule were used for all of the experiments. A GeO2–SiO2 pressure standard [Reference Leinenweber, Gullikson, Stoyanov and Malik4] was included next to the sample (opposite to the thermocouple) for most experiments. Run duration (time at the target temperature) was 2 h for all of these experiments. The separation into two rutile phases at pressures of 4–7 GPa and temperatures below 1600 °C was verified by backscattered electron imaging on several polished samples, in which separation into uniform Ti-rich and Ge-rich regions was observed, and by the splitting/separation of peaks in X-ray diffraction patterns. However, the thermal gradients were large enough to interfere with the precise measurement and calibration of the solvus to use as a temperature sensor. The differences across each sample were demonstrated by EPMA, where different degrees of phase separation were visible in backscattered electron images and confirmed using EDX compositional analysis in different regions of the sample. Phase separation was less (or absent) in the hottest regions of the sample and greater in the coolest regions, consistent with a normal solvus relationship. The EPMA analyses were performed on polished specimens using a JEOL JXA-8530F (JEOL Ltd., Tokyo, Japan) electron microprobe with a 15-kV accelerating voltage, a 10-snA beam current, and 20 s count times for EDX analysis. The analytical precision is estimated to be better than 5 rel.% for major element oxides (TiO2 and GeO2).
The primary series of quench experiments for the calibration of the GeO2–TiO2 solid solution were then performed using the industrial multianvil and belt high-pressure apparatuses at Hyperion Materials & Technologies. The larger sample volumes allowed for very low thermal gradients in the thermocouple/sample region, thus producing homogeneous samples with the most clearly defined split/separated X-ray peaks.
In all experiments, the samples were held for 45 min to ensure that they reach full equilibrium, and the temperature was monitored with a W5% Re–W26% Re (C-type) thermocouple and the pressure was obtained with a barometer using a separate sample of the SiO2–GeO2 [Reference Leinenweber, Gullikson, Stoyanov and Malik4] placed in a Pt foil capsule and located next to the main sample, with the thermocouple between them. The pressure standard was recovered and X-rayed to provide a value for the pressure in each experiment as described in detail elsewhere [Reference Gullikson, Leinenweber, Stoyanov, Zhang and Malik2, Reference Leinenweber, Gullikson, Stoyanov and Malik4]. In some cases, the sample was divided and separate X-ray diffraction experiments were performed to verify the uniformity of the samples. In those cases, no difference could be detected between different parts of the sample, indicating that temperatures were uniform throughout, unlike in the case of the samples obtained from the Kawai device.
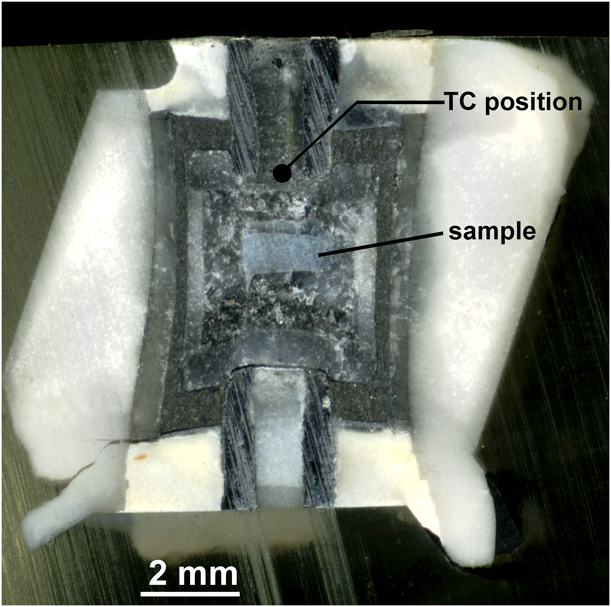
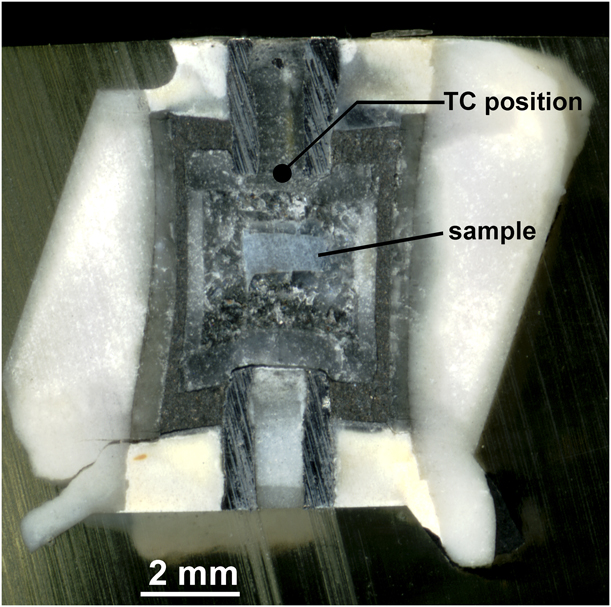
To confirm that the GeO2–TiO2 solid solutions are also stable at the original high pressure and temperature conditions and to see the behavior in real time, an experiment was performed using synchrotron radiation to observe changes in the X-ray diffraction patterns directly at high pressure and temperature. The measurements were performed using the Large Volume Press (Kawai-type) installed at the undulator beamline at Sector 13 of the Advanced Photon Source (13-ID-D) operated by the University of Chicago GSECARS Consortium. A small sample was used (the beam profile is less than 100 μm) to ensure temperature uniformity. An NaCl capsule was used to be consistent with the offline measurements and because NaCl does not react with the GeO2–TiO2 sample in the temperature range of the solvus. The diffraction pattern from the NaCl sample capsule was used as a pressure standard, [Reference Decker14] and the temperature was measured with a W5% Re–W26% Re (C-type) thermocouple. The cell used in the experiment was recovered and mounted in epoxy for post-HPHT analysis. To prevent the dissolution of the salt capsule containing the sample and preserve its orientation relative to the thermocouple, light mineral oil was used for sectioning the cell, and the sectioned cell is shown in Fig. 7. Because the sample was contained in an NaCl capsule with the thermocouple outside, a correction for thermal gradient was made using the finite difference model of Hernlund et al. [Reference Hernlund, Leinenweber, Locke and Tyburczy8], using the thermocouple and sample location obtained from the photograph of the sectioned cell shown in Fig. 7, and using the undeformed cell dimensions as input. The correction was positive (the sample is hotter than the thermocouple) and the thermocouple temperature was consistently about 15% cooler than the sample temperature relative to ambient. The X-ray peak splittings were measured as a function of temperature at 50 °C intervals. After the GeO2 and TiO2 starting material converted to the pure rutile phases, the peaks were observed to merge together gradually as the temperature was increased. At each temperature, the sample was allowed to equilibrate for 10 min, and it was confirmed that peak positions were not changing with time. Once this equilibrium test was completed, the peak positions were obtained by fitting Gaussian peaks to the 110 peaks on the GeO2 and TiO2 phases. To estimate the compositions of the two solid solution phases observed in situ, experimental bulk and lattice parameter compressibilities from Haines et al. [Reference Haines, Léger, Chateau and Pereira15] for GeO2 and Gerward and Olsen [Reference Gerward and Olsen16] for TiO2 were used, along with a thermal expansion coefficient of 8.0 × 10⁻⁶/K, and the agreement with the quench data was good. Because of the close agreement between the recovered and in situ samples, both the recovered and in situ datasets are considered together in this treatment.
Sectioned cell that was used for the in situ experiment at GSECARS (sample T2220). The distance between the thermocouple and the sample was measured, and a finite difference thermal model was used to correct the sample temperature.
The lattice parameters of the GeO2–TiO2 solid solution were determined by powder X-ray diffraction, using a Bruker D8 (BRUKER AXS GmbH, Karlsruhe, Germany) X-ray diffractometer in Bragg–Brentano geometry with operating conditions of 40 kV, 40 mA, a 0.3-mm scattering slit for the incident beam, a 4°-wide position-sensitive detector for the diffracted beam, and a diffractometer radius of 200.5 mm. Each sample was mixed with ∼30 weight percent LaB6 standard (NIST 660c) to provide an internal standard for the X-ray diffraction peak positions. The same zero-background slide was used in every experiment for consistency of the sample displacement. The lattice parameters were fitted using the program CrystalCracker [Leinenweber, online distribution].
The beamline experiments at the GSECARS (Sector 13), Advanced Photon Source, and Argonne National Laboratories used a white X-ray beam in the range from 10 to 70 keV. The energy was calibrated using three fluorescence lines, AgKα, AgKβ, and Co57 γ2, from sources kept next to the detector so the lines were visible in each data collection. The two theta angle was constant and was calibrated at the beginning of the experiment using the lines from NaCl in the sample capsule before pressurization.
Acknowledgments
Funding for this project was provided by Hyperion Materials and Technologies. Use of the COMPRES Cell Assembly Project was supported by COMPRES under NSF Cooperative Agreement EAR 1661511. Portions of this work were performed at GeoSoilEnviroCARS (GSECARS) (Sector 13), Advanced Photon Source (APS), and Argonne National Laboratory. GeoSoilEnviroCARS is supported by the National Science Foundation—Earth Sciences (EAR-1128799) and Department of Energy—Geosciences (DE-FG02-94ER14466). This research used resources of the Advanced Photon Source, a U.S. Department of Energy (DOE) Office of Science User Facility operated for the DOE Office of Science by Argonne National Laboratory under Contract no. DE-AC02-06CH11357. We would like to thank the two reviewers for their constructive feedback. We also thank Camille Mayberry for assistance with experiments at ASU, Devin Keating at ASU for his help with taking optical images of the synthesized samples, and Yanbin Wang and Tony Yu at GSECARS for beamline support.