1 Introduction
The breakup of liquid sheets plays a crucial role in the generation of industrial sprays (Eggers & Villermaux Reference Eggers and Villermaux2008) or natural processes such as sea spray (Wu Reference Wu1981). The industrial production of sprays proceeds typically via the formation of sheets, which break up to form ribbons. Ribbons are susceptible to the Rayleigh–Plateau instability, and quickly break up into drops. In nature, sheets are often formed by bubbles rising to the surface of a pool (Boulton-Stone & Blake Reference Boulton-Stone and Blake1993; Spiel Reference Spiel1998; Lhuissier & Villermaux Reference Lhuissier and Villermaux2011). Once broken, the sheet decays into a mist of droplets (Lhuissier & Villermaux Reference Lhuissier and Villermaux2011; Feng et al. Reference Feng, Roché, Vigolo, Arnaudov, Stoyanov, Gurkov, Tsutsumanova and Stone2014), and collapse of the void left by the bubble produces a jet (Duchemin et al. Reference Duchemin, Popinet, Josserand and Zaleski2002).
It is therefore of crucial importance to understand the mechanisms leading to the breakup of sheets. In contrast to jets and liquid threads (Eggers & Villermaux Reference Eggers and Villermaux2008), there is no obvious linear mechanism for sheet breakup, unless there is strong shear, and the mechanism is that of the Kelvin–Helmholtz instability (Tammisola et al.
Reference Tammisola, Sasaki, Lundell, Matsubara and Söderberg2011). As a result, some authors have invoked the presence of attractive van der Waals forces (Vrij Reference Vrij1966) to explain spontaneous rupture (Thoroddsen et al.
Reference Thoroddsen, Thoraval, Takehara and Etoh2012). However, the average thickness of a sheet at the point of breakup has been measured (Spiel Reference Spiel1998; Lhuissier & Villermaux Reference Lhuissier and Villermaux2011) to lie between 100 nm and 100
 $\unicode[STIX]{x03BC}\text{m}$
, depending on the purity of the liquid. Van der Waals forces, on the other hand, only have a range of tens of nanometres (Seemann, Herminghaus & Jacobs Reference Seemann, Herminghaus and Jacobs2001; Champougny et al.
Reference Champougny, Rio, Restagno and Scheid2017), and cannot play a significant role except perhaps for the very last stages of breakup.
Instead, it has been suggested (Tilley & Bowen Reference Tilley and Bowen2005; Lhuissier & Villermaux Reference Lhuissier and Villermaux2011; Bowen & Tilley Reference Bowen and Tilley2013; Néel & Villermaux Reference Néel and Villermaux2018) that gradients of temperature could promote breakup, because they produce Marangoni forces (Craster & Matar Reference Craster and Matar2009), which lead to flow. This cannot be a linear mechanism, since for reasons of thermodynamic stability Marangoni flow will always act to reduce gradients; molecular diffusion will also alleviate (temperature) gradients. In addition, the extensional flow expected near a potential pinch point will stretch fluid particles, once more tending to reduce gradients. Thus a sufficiently strong initial variation of the temperature (or some other contaminant) is needed. Lhuissier & Villermaux (Reference Lhuissier and Villermaux2011) have shown that strong thermal convection is present in the sheet caused by rising bubbles, whose associated temperature variations could be the cause for breakup. More recently, Néel & Villermaux (Reference Néel and Villermaux2018) initiated breakup by either contaminating the sheet with a drop of another liquid, or by local heating, thus showing directly that such perturbations can lead to rupture of a liquid sheet.
In the absence of viscosity, it was found numerically that sheets can break up in finite time (Matsuuchi Reference Matsuuchi1976; Pugh & Shelley Reference Pugh and Shelley1998), if there is a sufficiently strong initial flow inside the sheet. This was confirmed analytically by Burton & Taborek (Reference Burton and Taborek2007), who found a similarity solution leading to finite-time breakup. Their solution is slender, so a long-wavelength approximation can be used, and the final stages of breakup are described by a local mechanism. However, it is found numerically (Bowen & Tilley Reference Bowen and Tilley2013) and supported by theoretical arguments (Eggers & Fontelos Reference Eggers and Fontelos2015) that an arbitrarily small amount of viscosity inhibits this singularity, and the sheet returns ultimately to its original equilibrium thickness. Namely, on the basis of the inviscid scaling found by Burton & Taborek (Reference Burton and Taborek2007), the viscous term becomes of the same order as the surface tension term when the minimum sheet thickness is of the order of the viscous length scale,
 $$\begin{eqnarray}\ell _{\unicode[STIX]{x1D708}}=\unicode[STIX]{x1D708}^{2}\unicode[STIX]{x1D70C}/\unicode[STIX]{x1D6FE},\end{eqnarray}$$
which even for a low-viscosity liquid such as water only reaches approximately 10 nm. For the analogous case of jet breakup, see Eggers & Villermaux (Reference Eggers and Villermaux2008), and for liquid sheets with viscosity, see the recent study by Fontelos, Kitavtsev & Taranets (Reference Fontelos, Kitavtsev and Taranets2017), showing asymptotic convergence to the equilibrium flat state. Bowen & Tilley (Reference Bowen and Tilley2013) have thus asked the question whether, in the nonlinear regime, temperature gradients could remain effective in driving the sheet towards vanishing thickness. If there is no viscosity, yet temperature (and thus surface tension) gradients are taken into account, the Burton & Taborek (Reference Burton and Taborek2007) singularity is recovered, and surface tension gradients play a subdominant role. This is consistent with the above argument that a pinching solution will only stretch, and thus alleviate, thermal gradients. However, paradoxically, numerical evidence (Bowen & Tilley Reference Bowen and Tilley2013) suggests that, if both finite viscosity and surface tension gradients are taken into account, breakup can occur, by a mechanism different from those considered previously. However, Bowen & Tilley (Reference Bowen and Tilley2013) were unable to find a consistent similarity description, and numerical evidence is inconclusive as to whether there is a finite-time or infinite-time singularity. Néel & Villermaux (Reference Néel and Villermaux2018) provide an explanation, confirmed by experiment, for the formation of a sharp temperature jump within the thin pinch-off region, which has been observed by Bowen & Tilley (Reference Bowen and Tilley2013) to persist during the later self-similar evolution of the sheet.
In this paper, we address the late stages of pinch-off in the presence of both finite viscosity and surface tension gradients. For simplicity, here we only consider variations of the temperature. The resulting equations are the same as those for a surfactant in the limit of high solubility (Jensen & Grotberg Reference Jensen and Grotberg1993; Matar Reference Matar2002). In the next section, we describe the equations coming from a long-wavelength assumption: the sheet thickness is much smaller than a typical variation in the lateral direction. This is consistent with the small aspect ratio of typical sheets: while the thickness may be of the order of micrometres, temperature varies over a fraction of the lateral extension of the sheet, which is typically a millimetre. In addition, we will see that close to breakup the aspect ratio becomes vanishingly small, so the slenderness assumption is valid near breakup as well.
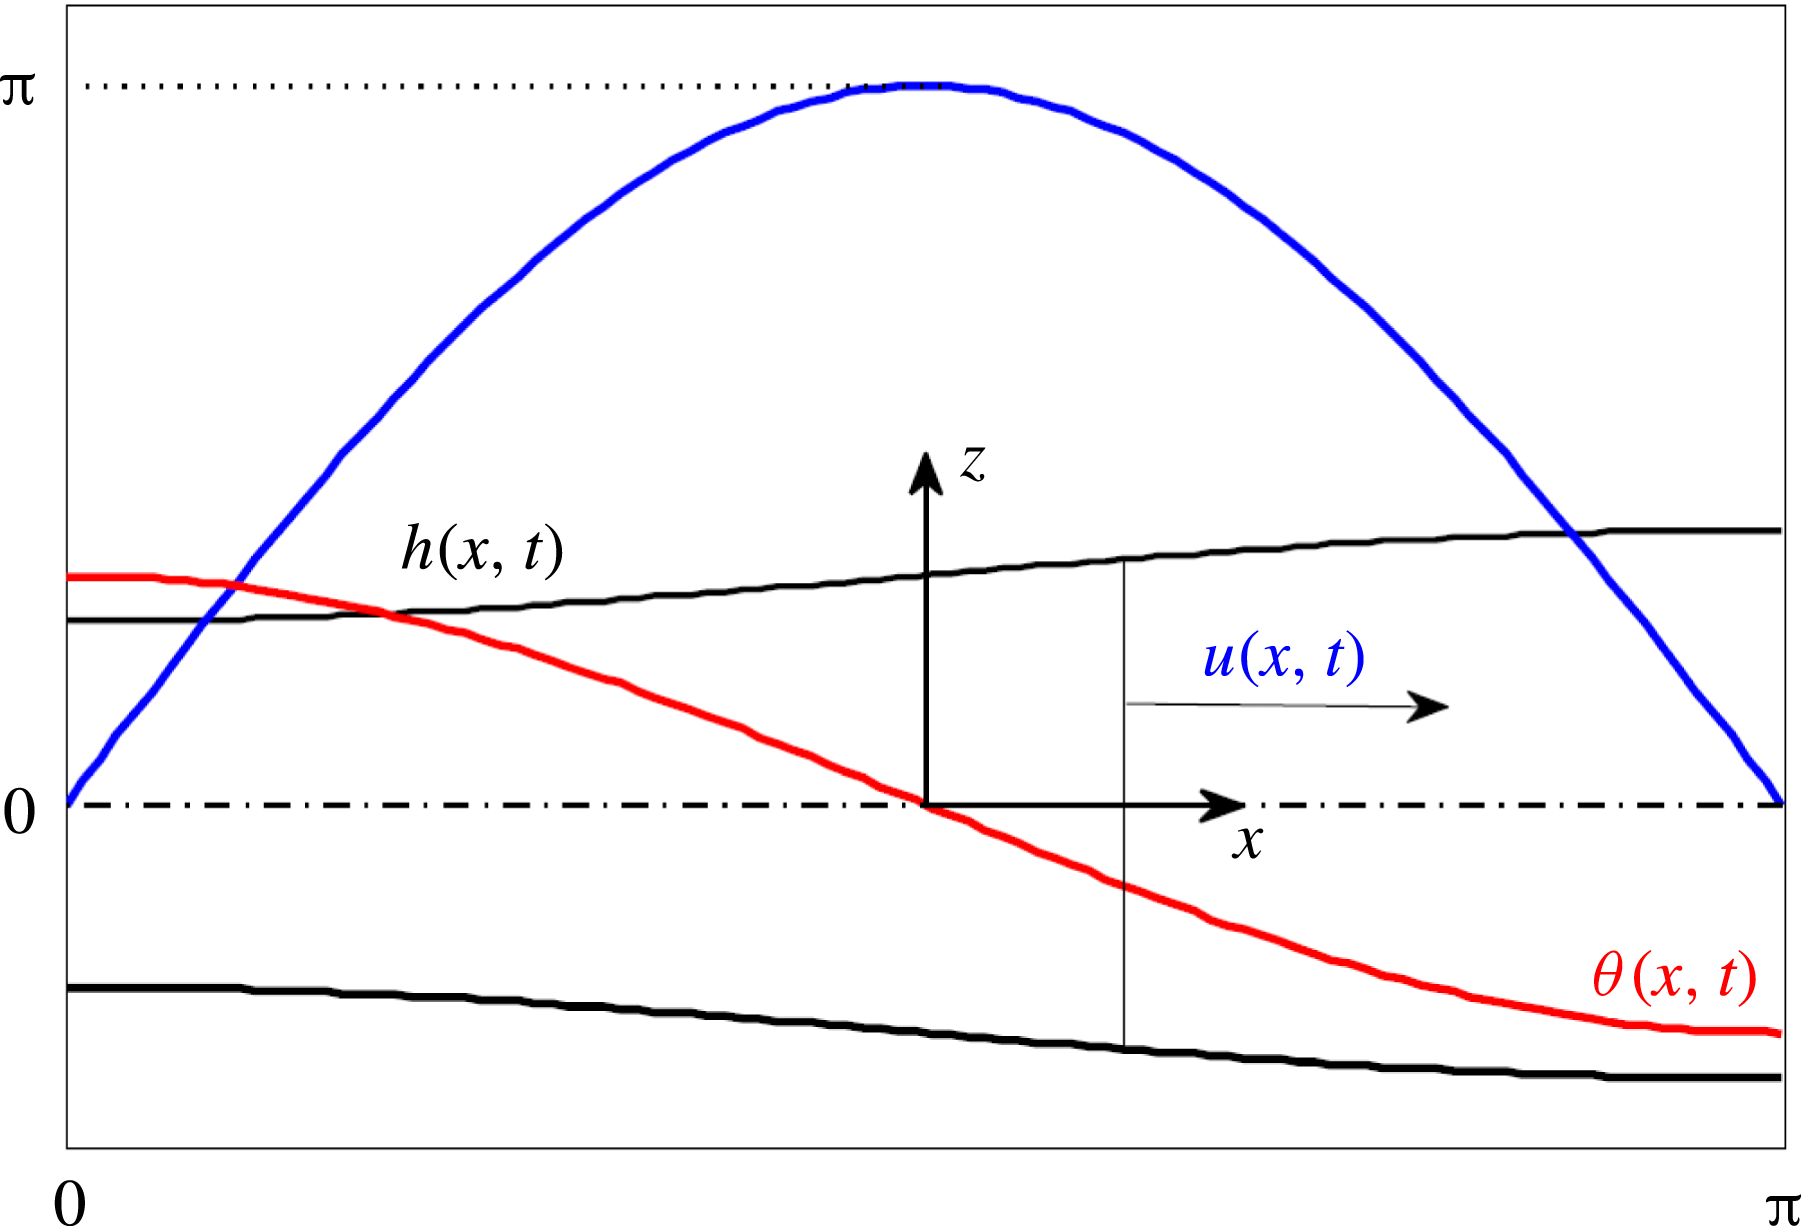
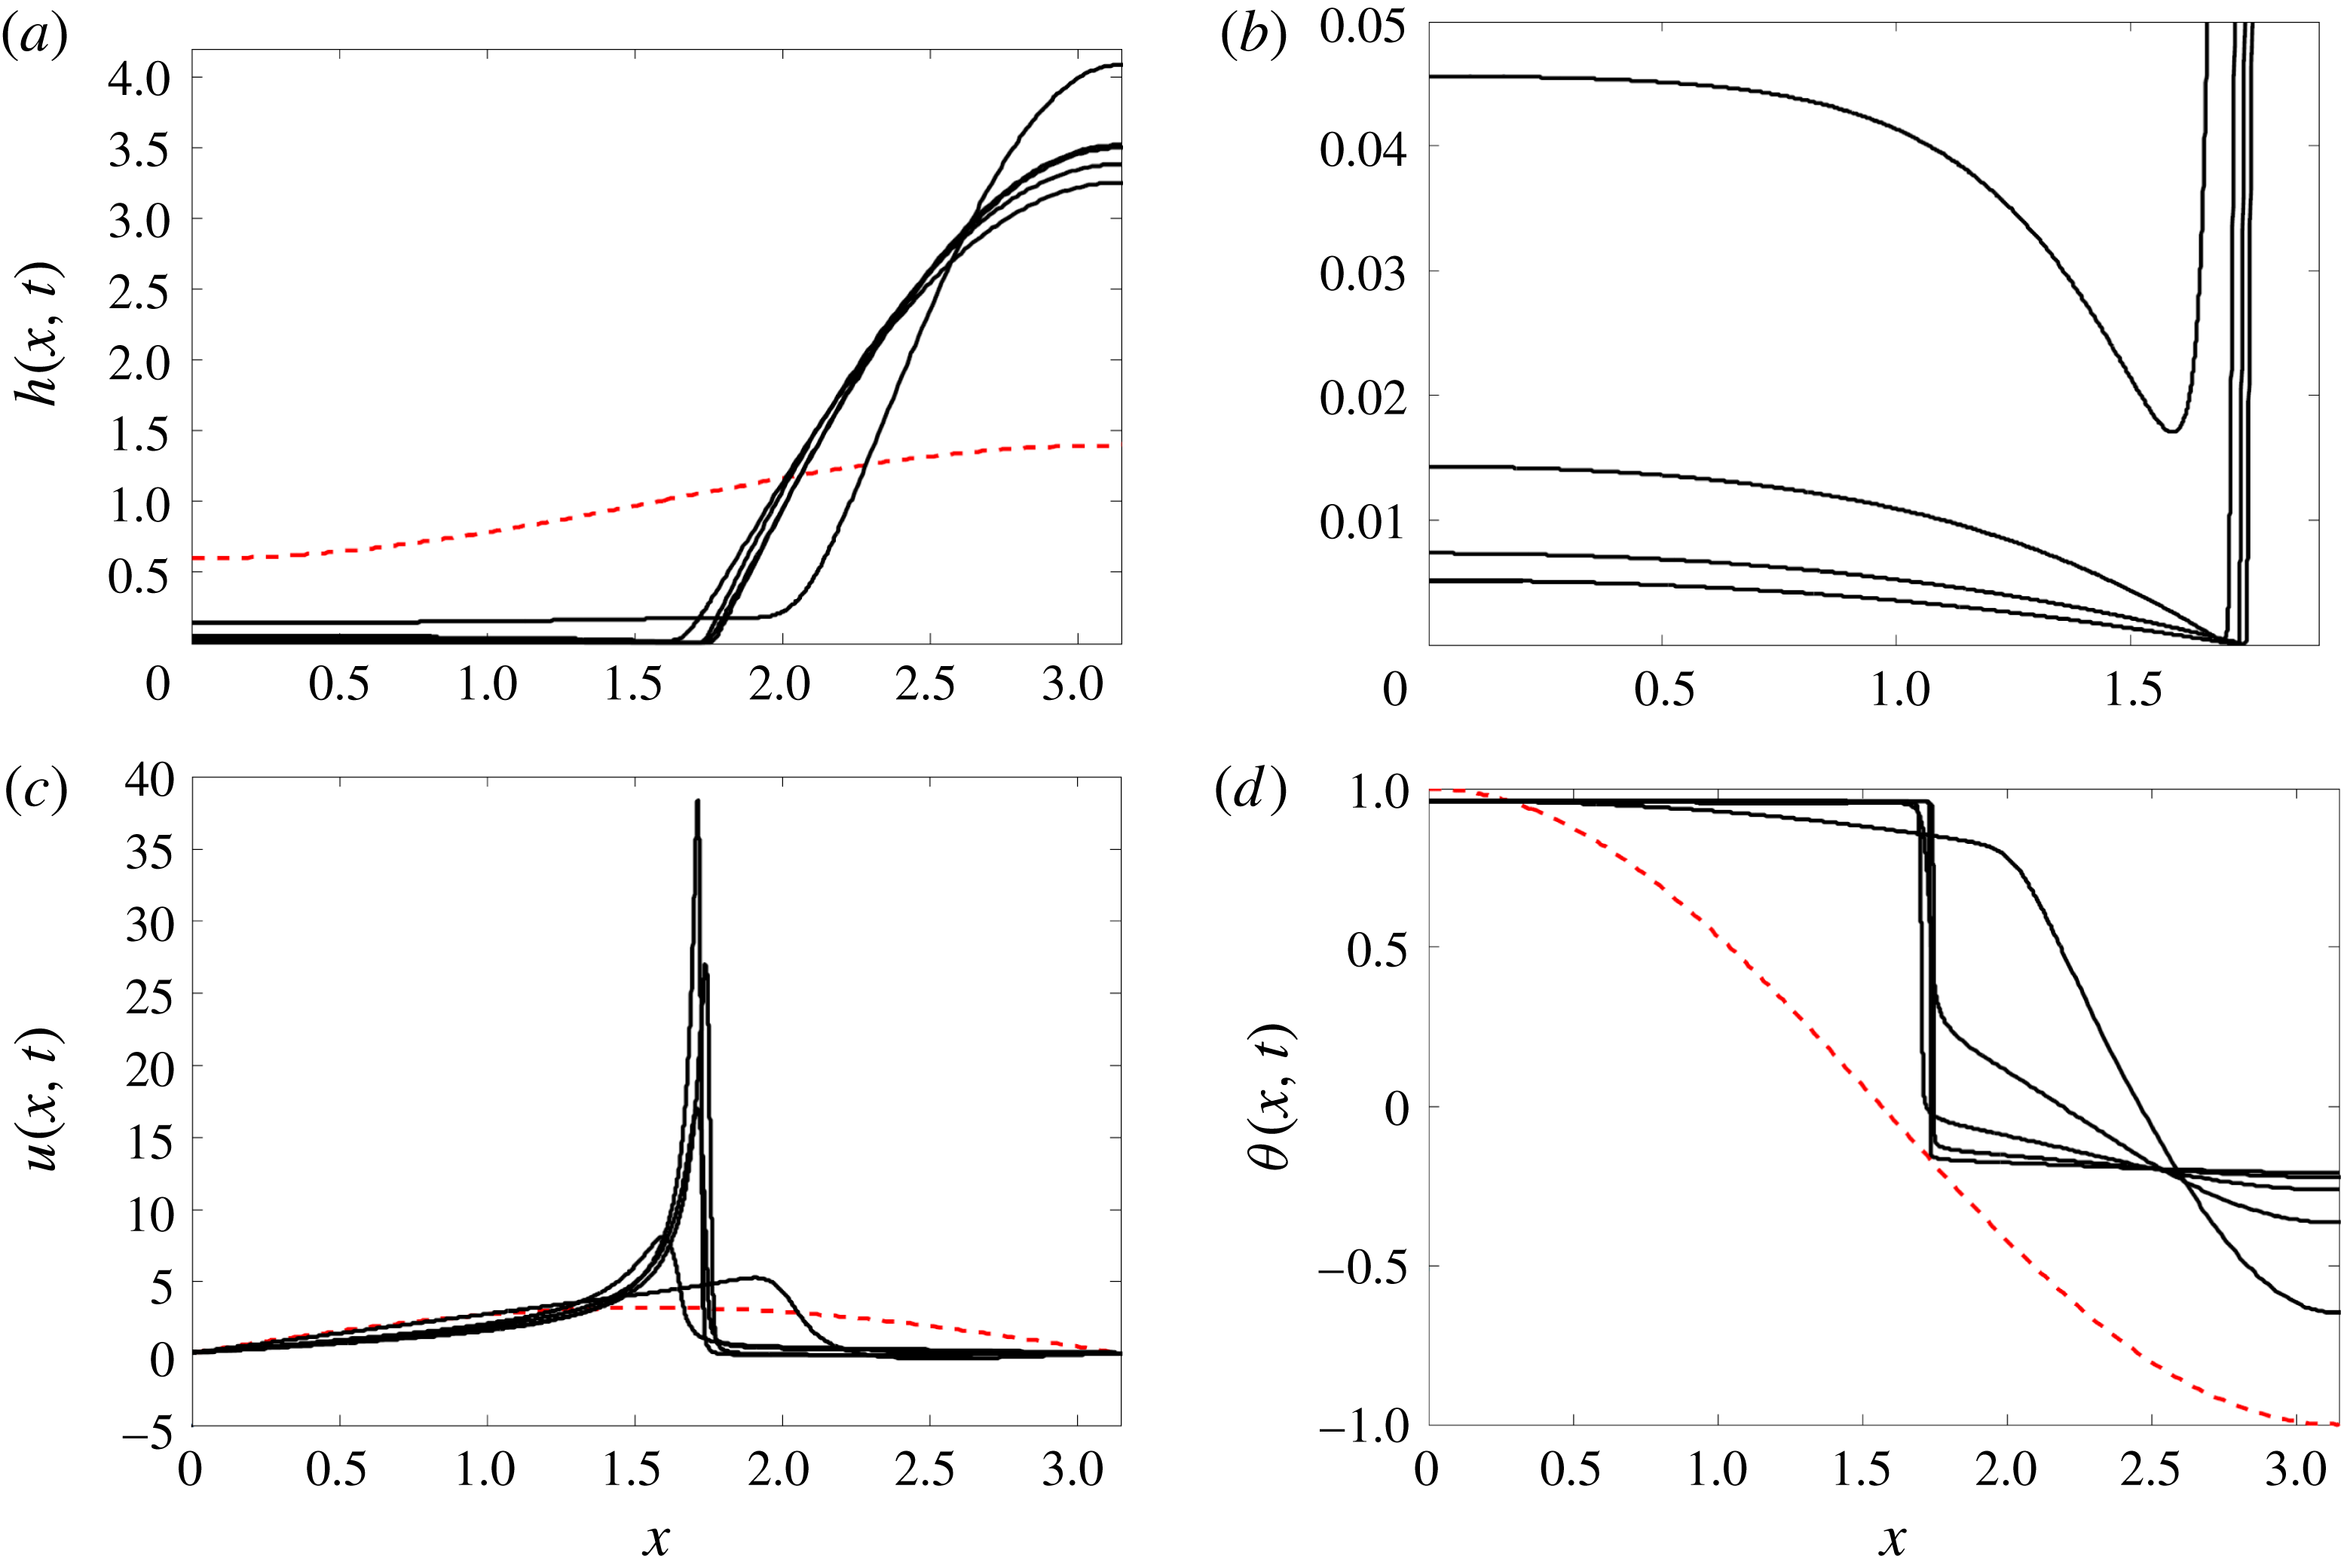
We choose a one-dimensional description, based on the idea that, if instability is triggered by a random variation of the temperature, there will be one direction along the sheet in which gradients are greatest. This assumption of a one-dimensional description is also supported by recent measurements of the film thickness using interferometry (Néel & Villermaux Reference Néel and Villermaux2018). It is observed that Marangoni stresses lead to a strong increase in gradient of either temperature or another contaminant, which grows principally in one direction. The one-dimensional geometry of the sheet is presented in figure 1, using the initial conditions considered by us. In figure 2 we show a typical numerical simulation of the equations of motion (2.2) to be considered below, which leads to rupture. Everything is reported in dimensionless variables, explained in detail in § 2. For water, the dimensionless parameters chosen in figure 2 correspond to a sheet of approximately
 $6.9~\unicode[STIX]{x03BC}\text{m}$
width and 220 nm thickness, with a surface tension variation of 1 % across the sheet.

Starting from smooth initial profiles for the sheet thickness
 $h(x,t)$
, velocity
 $u(x,t)$
and temperature
 $\unicode[STIX]{x1D703}(x,t)$
, the shape of the sheet evolves towards a thin film on the left, connected to a macroscopic droplet right (see figure 2
a). A zoom of the pinch region (figure 2
b) shows that the sheet thickness goes to zero in a localized fashion near the point where the sheet and the drop meet. In the same region, the velocity has a sharp and increasing maximum (figure 2
c), while the temperature develops an increasingly sharp jump (figure 2
d).
Rupture of a viscous liquid sheet as described by (2.2), starting from initial conditions
 $h(x,0)=1-0.4\cos (x)$
,
 $u(x,0)=\unicode[STIX]{x03C0}\sin (x)$
and
 $\unicode[STIX]{x1D703}(x,0)=\cos (x)$
, a particular case of those used in Bowen & Tilley (Reference Bowen and Tilley2013) (dashed curves), with parameters
 $O={\mathcal{D}}=1/4$
and
 ${\mathcal{M}}=10$
. Shown are six snapshots, taken at times
 $t_{0}=0,~t_{1}=2.247,~t_{2}=4.032,~t_{3}=5.138,~t_{4}=5.987,~t_{5}=6.800$
, of the height profile
 $h(x,t)$
(a), with a zoom of the pinch region shown in (b). The velocity
 $v(x,t)$
and temperature
 $\unicode[STIX]{x1D703}(x,t)$
profiles are shown in (c) and (d), respectively.

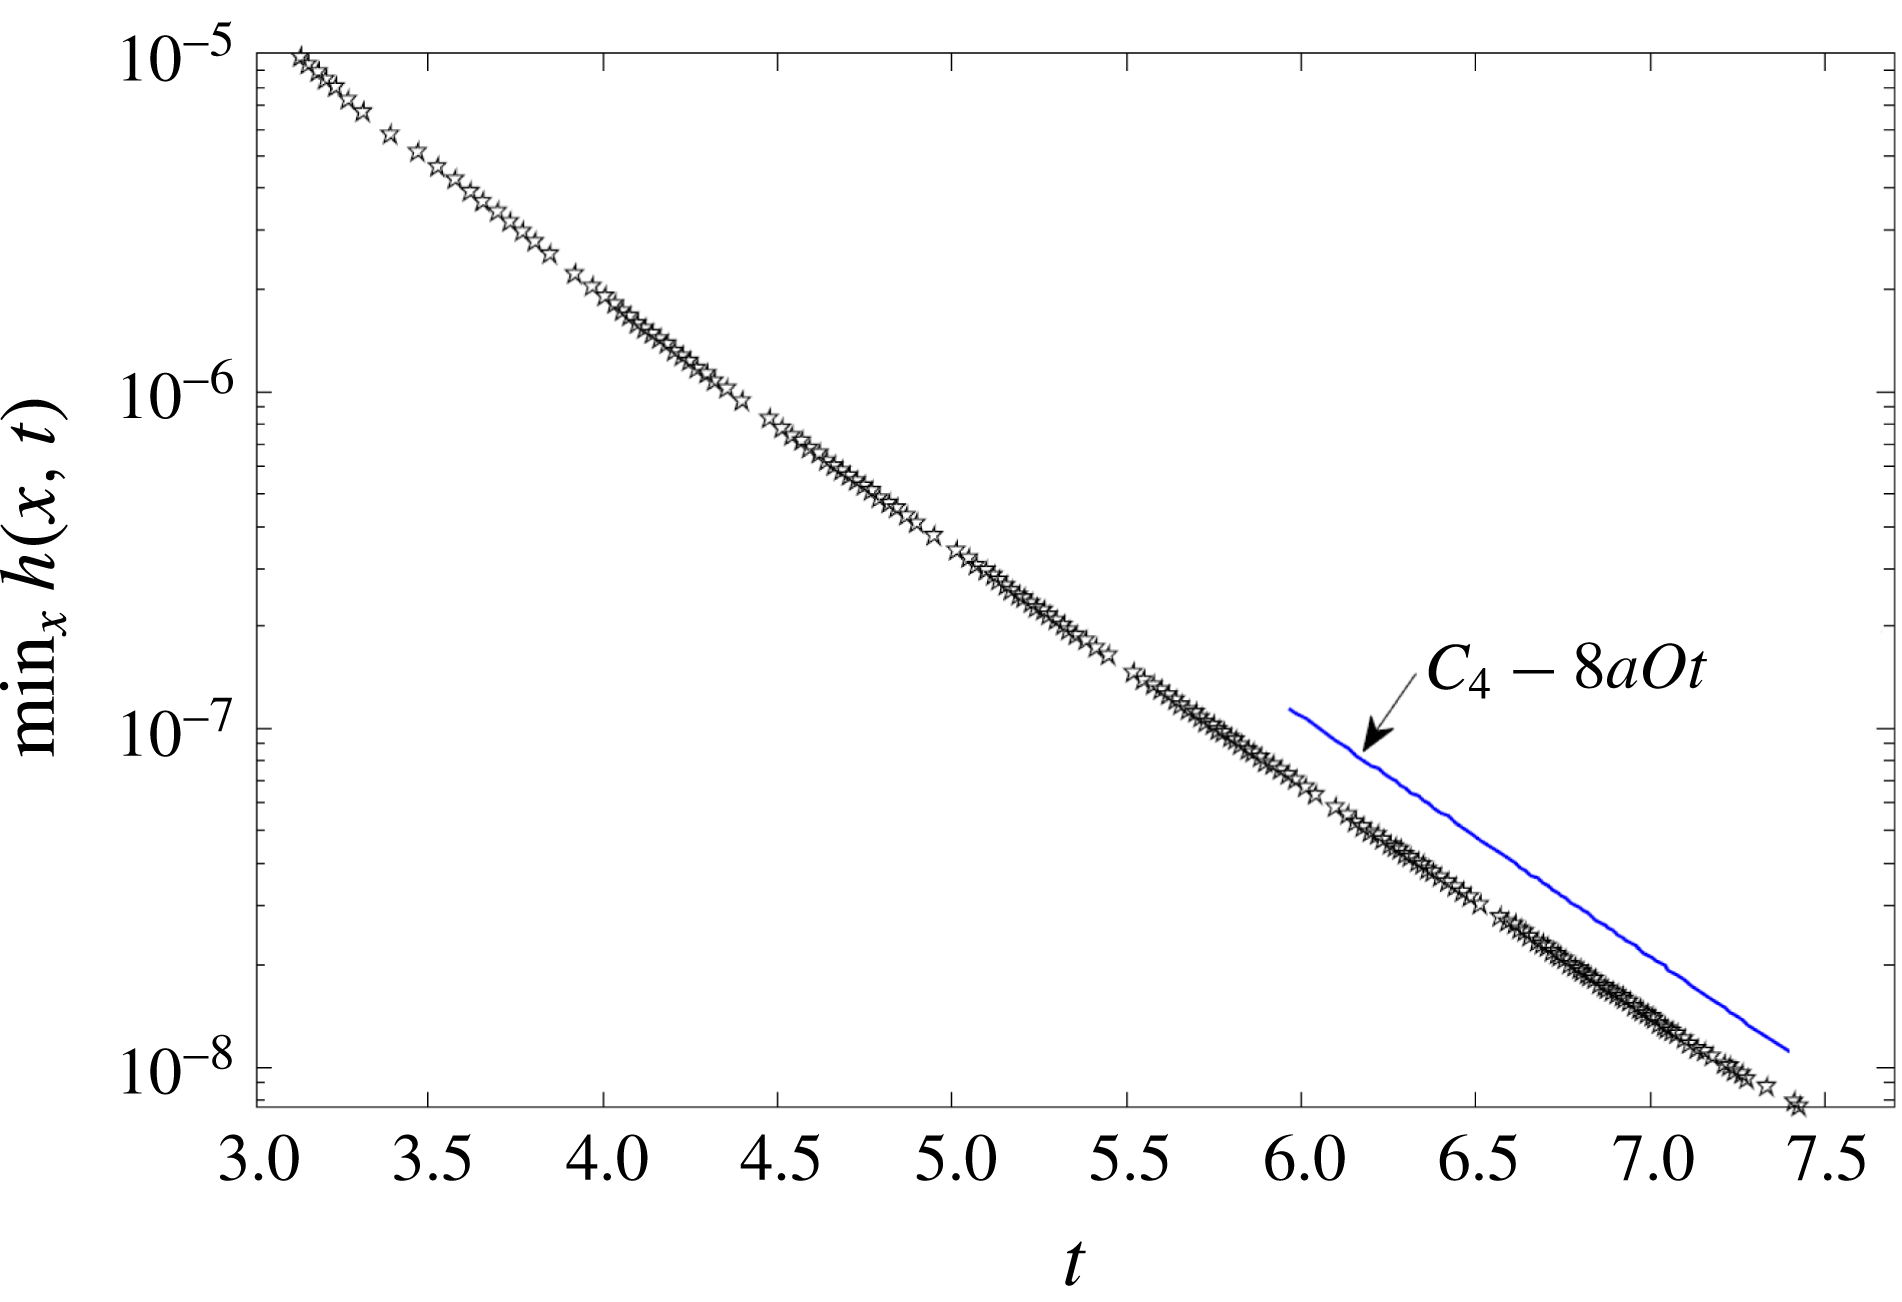
In the third section, we construct an analytical solution in which the sheet thickness goes to zero exponentially. The macroscopic outer part consists of an exponentially thinning film on one side, and a static ‘drop’ on the other. Over both parts of the outer solution the temperature is approximately constant but different, with a strong gradient between the two regions. The pinch region connecting the two parts is described by two different similarity solutions, which hold in two different regions, with two different sets of scaling exponents. Matching all regions together, we are able to describe pinch-off in terms of a single free parameter, which is the position of the pinch point. All other parameters are found in terms of the initial conditions, or can be absorbed into a shift in time. The results agree very well with numerical simulations of the long-wavelength equations. We show for the first time, both theoretically and numerically (see figure 5), that the minimum of the sheet thickness
 $h(x,t)$
decreases exponentially, at a rate we calculate. This result refutes the conjecture of Bowen & Tilley (Reference Bowen and Tilley2013) that finite-time sheet breakup occurs when both Marangoni and viscous forces are present. In a final section, we discuss our results and give perspectives. Appendix A presents a detailed analysis of the leading-order equation arising in the exponentially thinning film region and contains a complete list of its possible solutions.
2 Long-wavelength equations and simulation
We consider the motion of a free liquid sheet, whose plane of symmetry has been fixed in the
 $z$
-plane (see figure 1). We expect that generically the sheet breaks up along a line, so in describing this singularity, we can assume that fields only depend on the coordinate
 $x$
perpendicular to this line. Thus the shape of the sheet is described uniquely by the half-thickness
 $h(x,t)$
. We assume that the surface tension depends linearly on temperature
 $\unicode[STIX]{x1D703}$
(Craster & Matar Reference Craster and Matar2009) according to
 $$\begin{eqnarray}\unicode[STIX]{x1D6FE}=\unicode[STIX]{x1D6FE}_{0}-k(\unicode[STIX]{x1D703}-\unicode[STIX]{x1D703}_{0}),\end{eqnarray}$$
which is a good approximation away from any critical point (Rowlinson & Widom Reference Rowlinson and Widom1982). Typical values for the coefficient
 $k$
and the reference surface tension
 $\unicode[STIX]{x1D6FE}_{0}$
for water are (Tilley & Bowen Reference Tilley and Bowen2005)
 $0.2~\text{dyn}~\text{cm}^{-1}~\text{K}^{-1}$
and
 $60~\text{dyn}~\text{cm}^{-1}$
, respectively. We will assume that
 $k>0$
as is the case for most systems, but the opposite sign will simply reverse the flow of heat. The average velocity in the sheet is
 $u(x,t)$
, and the temperature
 $\unicode[STIX]{x1D703}(x,t)$
, which is allowed to diffuse.
Bowen & Tilley (Reference Bowen and Tilley2013) derived the equations for a slender sheet of variable surface tension as an extension of the classical long-wave description for a free liquid sheet by Erneux & Davis (Reference Erneux and Davis1993). The dimensionless forms of these equations are
 $$\begin{eqnarray}\displaystyle & \displaystyle h_{t}=-(hu)_{x}, & \displaystyle\end{eqnarray}$$
 $$\begin{eqnarray}\displaystyle & \displaystyle u_{t}+uu_{x}=h_{xxx}+4O\frac{(hu_{x})_{x}}{h}-{\mathcal{M}}\frac{\unicode[STIX]{x1D703}_{x}}{h}, & \displaystyle\end{eqnarray}$$
 $$\begin{eqnarray}\displaystyle & \displaystyle \unicode[STIX]{x1D703}_{t}+u\unicode[STIX]{x1D703}_{x}={\mathcal{D}}\frac{(h\unicode[STIX]{x1D703}_{x})_{x}}{h}, & \displaystyle\end{eqnarray}$$
 $L_{0}=L/\unicode[STIX]{x03C0}$
, where
 $L$
is the width of the computational domain,
 $\unicode[STIX]{x1D70F}=\sqrt{L_{0}^{3}\unicode[STIX]{x1D70C}/(\unicode[STIX]{x1D716}\unicode[STIX]{x1D6FE}_{0})}$
is the time scale, chosen to make the coefficient in front of the surface tension term
 $h_{xxx}$
unity, and
 $\unicode[STIX]{x1D70C}$
is the fluid density; the unit of velocity is
 $L_{0}/\unicode[STIX]{x1D70F}$
. As the unit of temperature
 $\unicode[STIX]{x1D6E5}$
we take half of the variation of the initial temperature across the system. Since the films to be considered are very thin compared to their spatial extension, we choose
 $H=\unicode[STIX]{x1D700}L_{0}$
as a height scale, where
 $\unicode[STIX]{x1D700}\ll 1$
. This means that the sheet can be considered slender throughout its evolution, justifying the use of a long-wavelength description.
Then (2.2a
) describes mass conservation, and (2.2b
) is the momentum balance across the sheet. Inertial forces on the left are balanced by surface tension, viscous stresses and Marangoni forces on the right, respectively. Note the key feature that the Marangoni stresses contain a factor
 $1/h$
, and are thus amplified for thin sheets. The size of the kinematic viscosity
 $\unicode[STIX]{x1D708}$
is measured by the Ohnesorge number
 $O=\unicode[STIX]{x1D708}\sqrt{\unicode[STIX]{x1D70C}/(L_{0}\unicode[STIX]{x1D6FE}_{0}\unicode[STIX]{x1D716})}$
, and a dimensionless measure of surface tension variations is defined by
 ${\mathcal{M}}=k\unicode[STIX]{x1D6E5}/(\unicode[STIX]{x1D6FE}_{0}\unicode[STIX]{x1D716}^{2})$
. We assume that the variation of the surface tension is small (of the order of 1 %), so we can take surface tension as a constant, except in the Marangoni term. Likewise, second-order corrections to the temperature dependence of surface tension can be neglected.
The last equation (2.2c
) describes the diffusion of temperature through the sheet, and
 ${\mathcal{D}}=\unicode[STIX]{x1D705}\sqrt{\unicode[STIX]{x1D70C}/(L_{0}\unicode[STIX]{x1D6FE}_{0}\unicode[STIX]{x1D716})}$
, where
 $\unicode[STIX]{x1D705}$
is the thermal diffusion coefficient;
 ${\mathcal{P}}=O/{\mathcal{D}}$
is known as the Prandtl number. We remark that we are considering a contaminant that diffuses in the bulk, and that the effects of Marangoni elasticity are not considered. Were a surfactant to be present on the surface only (Stone Reference Stone1990), the factor
 $1/h$
on the right-hand side of (2.2c
) would be absent, since it comes from averaging over the sheet. Thus the asymptotic balance would change in that case, which is an issue worth exploring. It is seen from the dependence of
 ${\mathcal{M}}$
on
 $\unicode[STIX]{x1D716}$
that, even for a small relative change of the surface tension
 $k\unicode[STIX]{x1D6E5}/\unicode[STIX]{x1D6FE}_{0}$
,
 ${\mathcal{M}}$
can be of order one if the aspect ratio is small. In the description (2.2), we have neglected heat conduction in the surrounding gas, since the thermal conductivity in the liquid is much greater. We also did not take into account the effect of evaporation into the gas atmosphere, as temperature variation is small, and pinching occurs on a fast time scale. This is confirmed formally with estimates used to find the dominant behaviour in the evaporation of drops (Larson Reference Larson2014).
For simplicity, we consider solutions to (2.2) in a fixed domain
 $[0,\unicode[STIX]{x03C0}]$
(after non-dimensionalization), and assume that
 $$\begin{eqnarray}u=h_{x}=\unicode[STIX]{x1D703}_{x}=0\quad \text{for}~x=0,\unicode[STIX]{x03C0},\end{eqnarray}$$
i.e. no-flux boundary conditions for the velocity and free boundary conditions for the height and the temperature. This choice of boundary conditions is motivated by the fact that, for symmetric initial data, for example those of figure 2, they result in solutions which can be extended to periodic solutions of period
 $2\unicode[STIX]{x03C0}$
. The conditions (2.3) also imply that there is no mass or heat flux out of the system, and thus
 $$\begin{eqnarray}M=\int _{0}^{\unicode[STIX]{x03C0}}h(x,t)\,\text{d}x,\quad Q=\int _{0}^{\unicode[STIX]{x03C0}}\unicode[STIX]{x1D703}(x,t)h(x,t)\,\text{d}x\end{eqnarray}$$
are conserved quantities, set by the initial conditions. We do not expect our choice of boundary conditions to have an effect on the structure of the singularity. The outer film and drop regions will still be described by the same leading-order ordinary differential equations (ODEs), but their solutions may be selected by the particular boundary and initial data. However, with the particular choice of boundary conditions (2.3) we are able to determine the structure of the singularity largely in terms of the two quantities
 $M$
and
 $Q$
alone.
Our main focus will be on pinch-off singularities for which
 $h\rightarrow 0$
at some point
 $x_{0}$
in space. To summarize what is known or widely accepted about pinch-off singularities of the system (2.2), and as stated in the Introduction, for
 $O=0$
finite-time pinch-off can occur for suitable initial conditions. The neighbourhood of the pinch point is described by the similarity solution of Burton & Taborek (Reference Burton and Taborek2007) for any value of
 ${\mathcal{M}}$
, and Marangoni forces are subdominant. If, on the other hand,
 $O$
is finite and
 ${\mathcal{M}}=0$
, breakup can never occur (Eggers & Fontelos Reference Eggers and Fontelos2015) and instead the sheet will eventually relax to a uniform state
 $h(x)=M$
. The present paper deals with the case that both
 ${\mathcal{M}}$
and
 $O$
are non-zero, for which we find a local pinch solution for which the thickness goes to zero exponentially in time (a typical example being presented in figure 2).
To solve the system (2.2) we extended the finite-difference schemes developed previously for the modelling of finite-time rupture under the presence of van der Waals forces by Peschka (Reference Peschka2008) and Peschka, Münch & Niethammer (Reference Peschka, Münch and Niethammer2010) and of coarsening dynamics of droplets in free liquid films by Kitavtsev & Wagner (Reference Kitavtsev and Wagner2010). We incorporated the temperature equation (2.2c
) along with the Marangoni term
 $-{\mathcal{M}}\unicode[STIX]{x1D703}_{x}/h$
, coupled with the boundary conditions (2.3). The resulting fully implicit finite-difference scheme is solved on a general non-uniform mesh in space, with adaptive time step. At every time step the nonlinear system of algebraic equations is solved using Newton’s method. In order to resolve the solution close to the rupture point, we applied the algorithm of Peschka (Reference Peschka2008) for dynamical grid re-meshing to concentrate points near where the film thickness is the smallest.
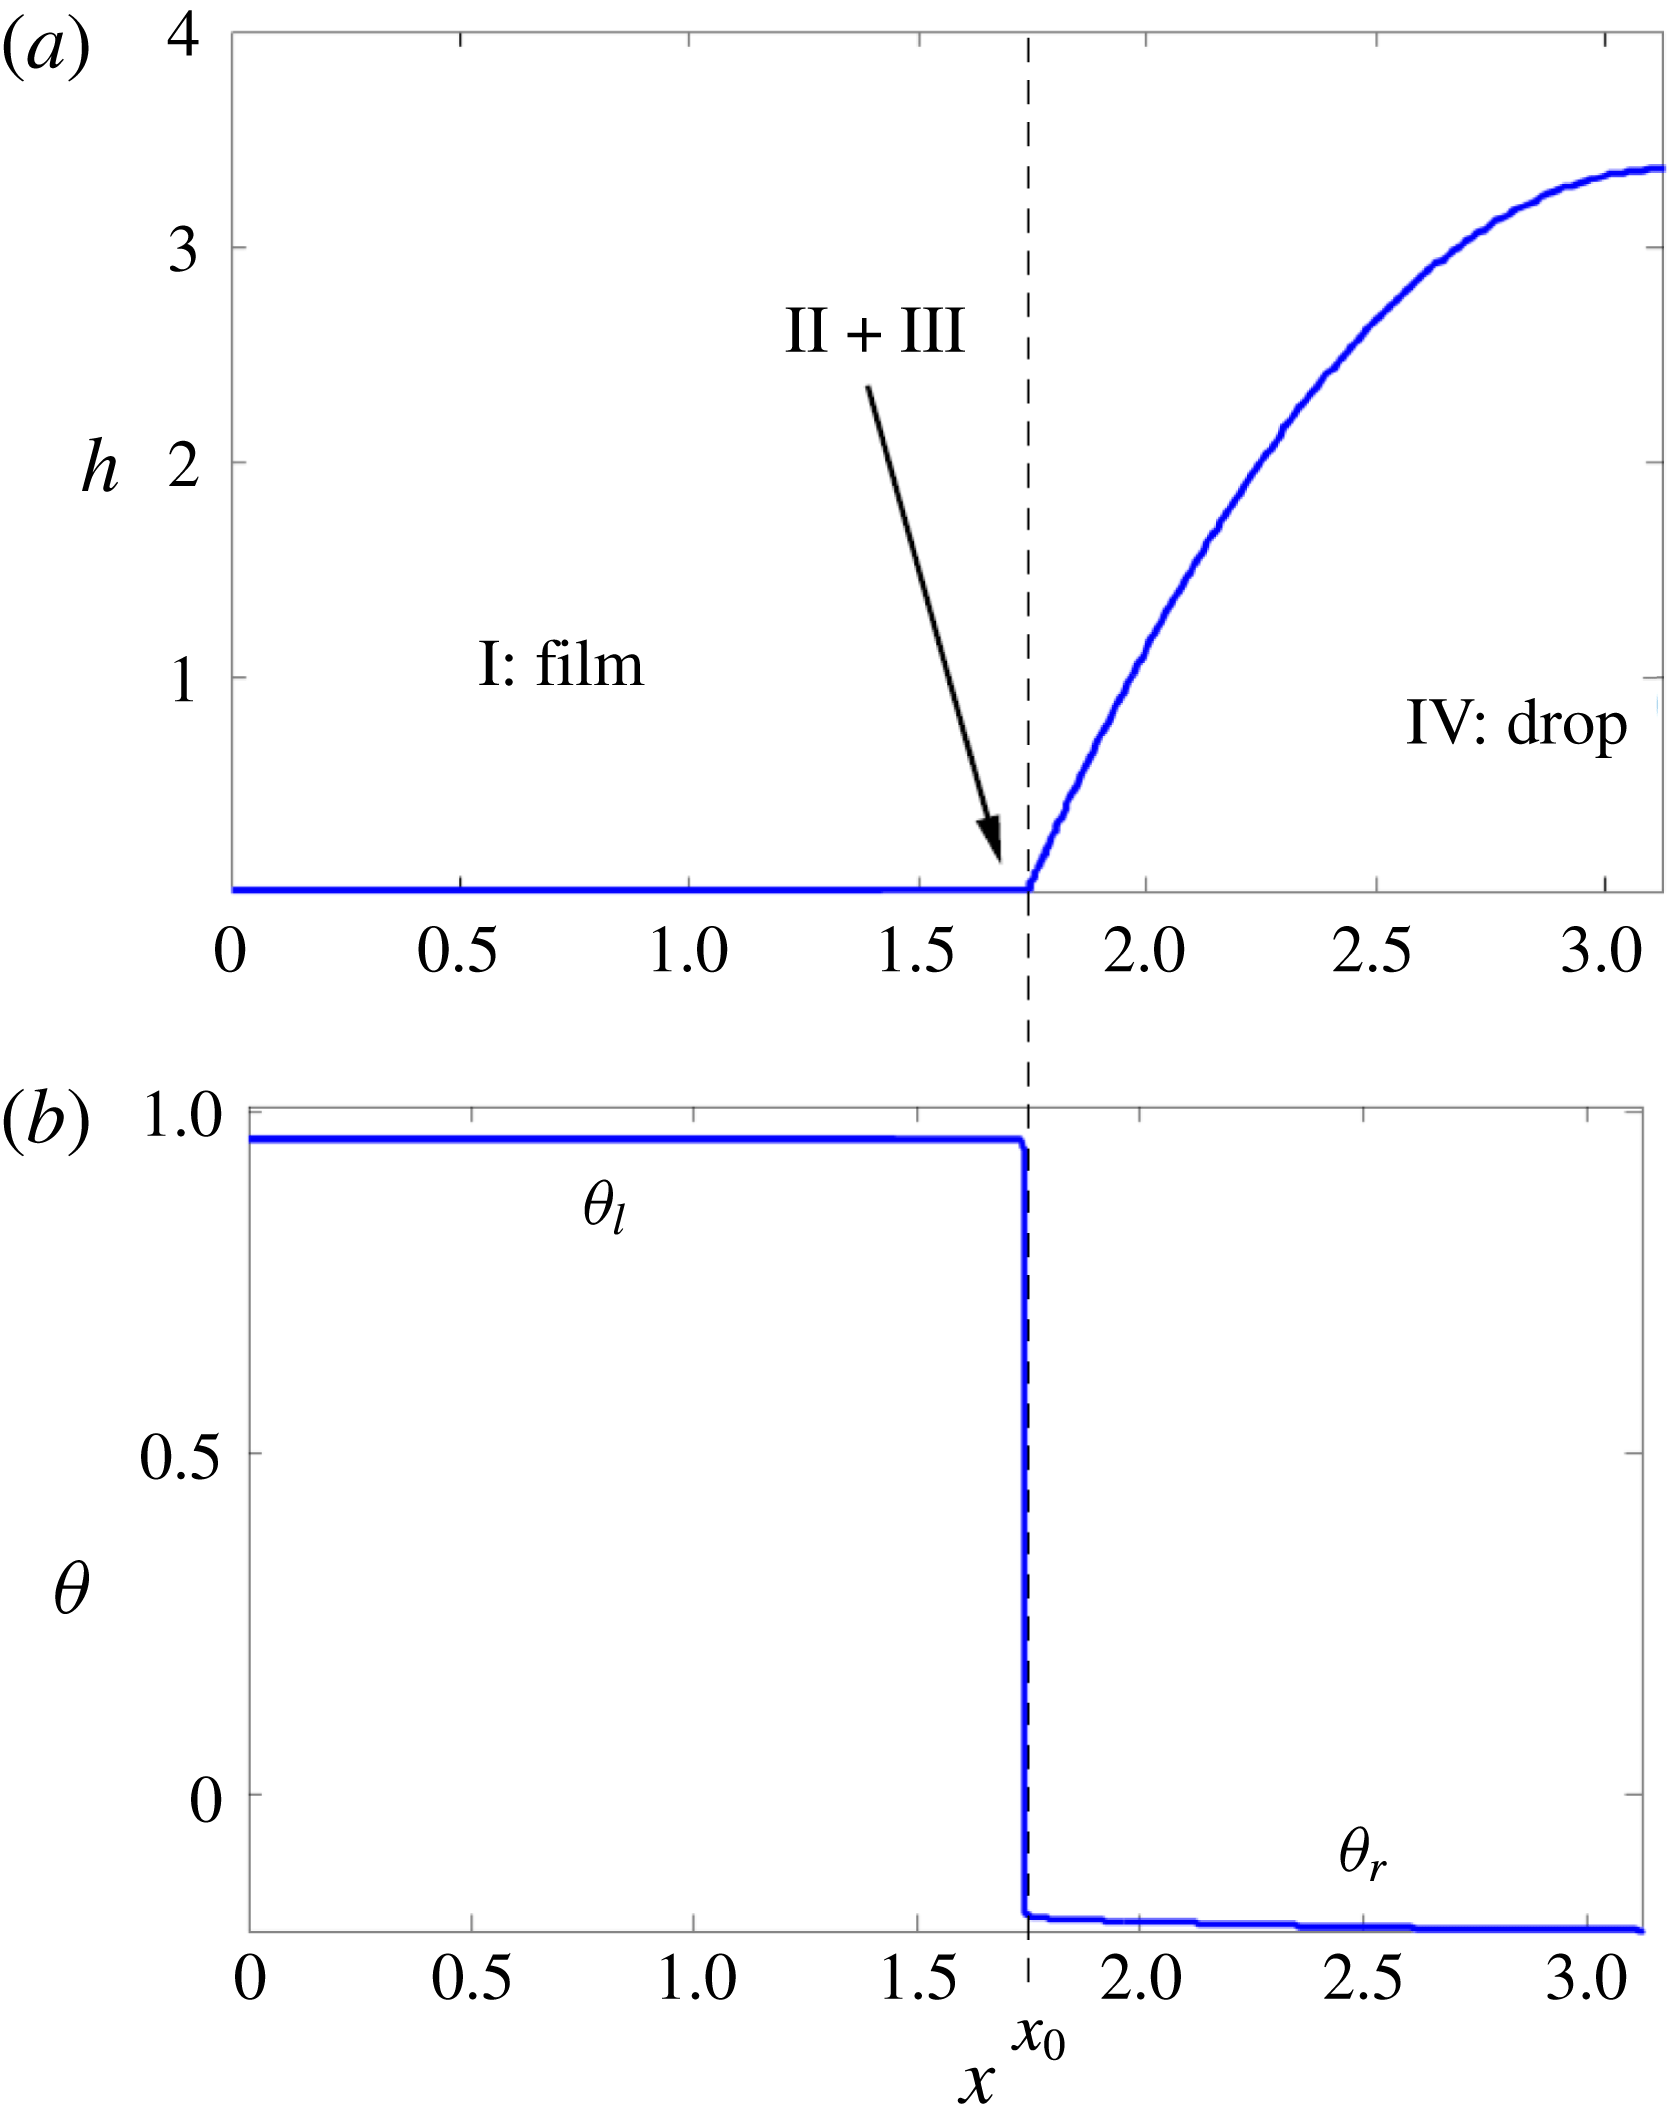
Typical height (a) and temperature (b) profiles near pinch-off. On the left is shown a film (region I) which thins exponentially, and on the right a drop in static equilibrium (region IV). These two outer regions are joined together at
 $x_{0}$
, where pinch-off ultimately occurs. The temperature inside the film has a nearly constant value
 $\unicode[STIX]{x1D703}_{l}$
, in the drop a constant value
 $\unicode[STIX]{x1D703}_{r}$
, with a sudden drop in the pinch region. The inner region at the juncture between film and drop has to split into two subregions (II and III), which have different scalings.

3 Self-similar pinch-off solutions
We begin with an overview of the structure of the solution in the asymptotic region that we hope to describe, guided by the results of a numerical simulation, shown in figure 3 for a late time in the evolution. The outer solution, observed on a macroscopic scale, is split between a thin-film region I on the left, and a drop region IV on the right; the two are joined together at the pinch point
 $x_{0}$
. The film thins exponentially in time, while the drop is in static equilibrium, and has a stationary profile. The temperature is almost constant in the two regions, with a sudden jump near the pinch point. Since the surface tension is lower on the left (higher temperature), this drives a Marangoni flow from the film into the drop, which is responsible for the thinning of the film.
The crucial question is how this strong temperature gradient is maintained, and what stabilizes the sudden jump in temperature. To understand this, one must study the inner region joining the two outer solutions, whose width will turn out to be of the same order as the film thickness, and which is therefore not resolved in figure 3. To achieve matching between regions I and IV, one must subdivide the inner region into two subregions, characterized by similarity solutions with different scalings. The first one, region II, we call the ‘pinch region’, because the film thickness has its minimum there and it is where pinch-off ultimately occurs. This region is characterized by a balance of inertia, viscosity and Marangoni forces. However, this does not match the drop region, where surface tension alone is important. This necessitates another region III, the ‘transition region’, where only surface tension and viscosity are important. In the following we will show by asymptotic matching that the structure composed of regions I–IV is consistent on both the local scale and the macroscale.
The fundamental insight that determines the structure of both similarity solutions is that the flux of liquid across the inner region is set by the flux out of the thin-film region, which is set on a macroscopic scale. Thus the flux
 $j=hu$
across inner regions II and III must be a spatial constant (but does depend on time). We will see that this constraint fixes the scaling exponents, and greatly simplifies the structure of the solution. Curiously, a similar structure was found for Hele-Shaw flow (Bertozzi et al.
Reference Bertozzi, Brenner, Dupont, Kadanoff and Sirovich1994), viscous films in a capillary tube (Lamstaes & Eggers Reference Lamstaes and Eggers2017) and bubble breakup in a low-viscosity fluid (Gordillo et al.
Reference Gordillo, Sevilla, Rodríguez-Rodríguez and Martínez-Bazán2005).
We now present all asymptotic regions systematically, and discuss matching between them.
3.1 Region I: thin-film region
The width of this region is of order one, yet the thickness
 $\unicode[STIX]{x1D70F}(t)$
of the film shrinks to zero, so we use the ansatz
 $$\begin{eqnarray}h(x,t)=\unicode[STIX]{x1D70F}(t)h_{f}(x),\quad u(x,t)=u_{f}(x),\quad \unicode[STIX]{x1D703}(x,t)=\unicode[STIX]{x1D703}_{l},\end{eqnarray}$$
where the temperature is assumed constant, in accordance with our earlier observations. Inserting (3.1) into the equations of motion, (2.2a ) yields
 $$\begin{eqnarray}\dot{\unicode[STIX]{x1D70F}}h_{f}=-\unicode[STIX]{x1D70F}(h_{f}u_{f})^{\prime }\end{eqnarray}$$
and, at leading order
 $\unicode[STIX]{x1D70F}^{0}$
, (2.2b
) results in
 $$\begin{eqnarray}u_{f}u_{f}^{\prime }=4O\frac{(h_{f}u_{f}^{\prime })^{\prime }}{h_{f}},\end{eqnarray}$$
where the surface tension term is of order
 $\unicode[STIX]{x1D70F}$
, and thus drops out in the limit
 $\unicode[STIX]{x1D70F}\rightarrow 0$
. Here and in the remainder of the paper, a dot denotes a derivative with respect to time, and a prime denotes a derivative with respect to the spatial variable. Note that (3.3) represents a balance between inertia and viscosity, while surface tension and Marangoni forces drop out. Dividing (3.2) by
 $\unicode[STIX]{x1D70F}h_{f}u_{f}$
and (3.3) by
 $4Ou_{f}^{\prime }$
, the term
 $h_{f}^{\prime }/h_{f}$
can be eliminated between the two equations, and one obtains an equation for the velocity
 $u_{f}$
alone:
 $$\begin{eqnarray}\bar{u}+\frac{\dot{\unicode[STIX]{x1D70F}}}{\unicode[STIX]{x1D70F}4O\bar{u}}=\frac{\bar{u}^{\prime \prime }}{\bar{u}^{\prime }}-\frac{\bar{u}^{\prime }}{\bar{u}},\end{eqnarray}$$
where we have rescaled the velocity according to
 $u_{f}=4O\bar{u}$
. In (3.4) only the second term on the left-hand side depends on time. Therefore, necessarily one has
 $-\dot{\unicode[STIX]{x1D70F}}/\unicode[STIX]{x1D70F}=4aO$
, where
 $a>0$
is a constant, which depends on initial conditions, as we will see. This implies
 $$\begin{eqnarray}\displaystyle & \displaystyle \unicode[STIX]{x1D70F}(t)=\unicode[STIX]{x1D70F}_{0}\exp \{-4aOt\}, & \displaystyle\end{eqnarray}$$
 $$\begin{eqnarray}\displaystyle & \displaystyle \bar{u}-\frac{a}{\bar{u}}=\frac{\bar{u}^{\prime \prime }}{\bar{u}^{\prime }}-\frac{\bar{u}^{\prime }}{\bar{u}}, & \displaystyle\end{eqnarray}$$
where
 $\unicode[STIX]{x1D70F}_{0}$
is an arbitrary normalization factor, which depends on the choice of origin for the time coordinate.
As shown in appendix A, (3.6) can be integrated and possesses a one-parameter family of ‘blow-up’ solutions of the form
 $$\begin{eqnarray}\bar{u}_{A}(x)=A+\tan \left[(x-\bar{x})\sqrt{a-A^{2}}\right]\sqrt{a-A^{2}},\quad \text{for}~A\in (-\sqrt{a},\sqrt{a}).\end{eqnarray}$$
The boundary conditions
 $\bar{u}(0)=\bar{u}^{\prime \prime }(0)=0$
, which follow from (2.3), together with (3.3), require that
 $A=\bar{x}=0$
, and thus
 $$\begin{eqnarray}u_{f}=4O\sqrt{a}\tan (x\sqrt{a}).\end{eqnarray}$$
The flux
 $j_{f}(x)=h_{f}(x)u_{f}(x)$
is calculated from (3.2) as
 $$\begin{eqnarray}\ln j_{f}=\int \frac{4Oa}{u_{f}}\,\text{d}x,\end{eqnarray}$$
and then it follows from (3.8) that
 $$\begin{eqnarray}j_{f}(x)=j_{0}\sin (\sqrt{a}x),\quad h_{f}(x)=\frac{j_{0}}{4O\sqrt{a}}\cos (\sqrt{a}x),\end{eqnarray}$$
where
 $j_{0}$
is a positive constant. It is clear from the first equation of (3.1) that, by adjusting
 $\unicode[STIX]{x1D70F}_{0}$
, we can make
 $h_{f}(0)=j_{0}/4O\sqrt{a}$
attain any value, which means that
 $j_{0}$
can be chosen arbitrarily. In the numerical results reported below, we will make the particular choice
 $j_{0}=4O\sqrt{a}$
.
The pinch point
 $x_{0}$
is determined by where
 $h_{f}$
goes to zero, which is at
 $$\begin{eqnarray}x_{0}=\unicode[STIX]{x03C0}/(2\sqrt{a});\end{eqnarray}$$
the interval
 $0\leqslant x\leqslant x_{0}$
will be referred to as the ‘thin-film region’. At
 $x_{0}$
, the flux is
 $j_{f}(x_{0})=j_{0}$
, which means that according to (3.1) the mass flux through the pinch point and into the drop is
 $\unicode[STIX]{x1D70F}j_{0}$
. In the neighbourhood of
 $x_{0}$
, the outer (film) profiles are
 $$\begin{eqnarray}h\approx -\frac{j_{0}\unicode[STIX]{x1D70F}(x-x_{0})}{4O},\quad u\approx -\frac{4O}{x-x_{0}}.\end{eqnarray}$$
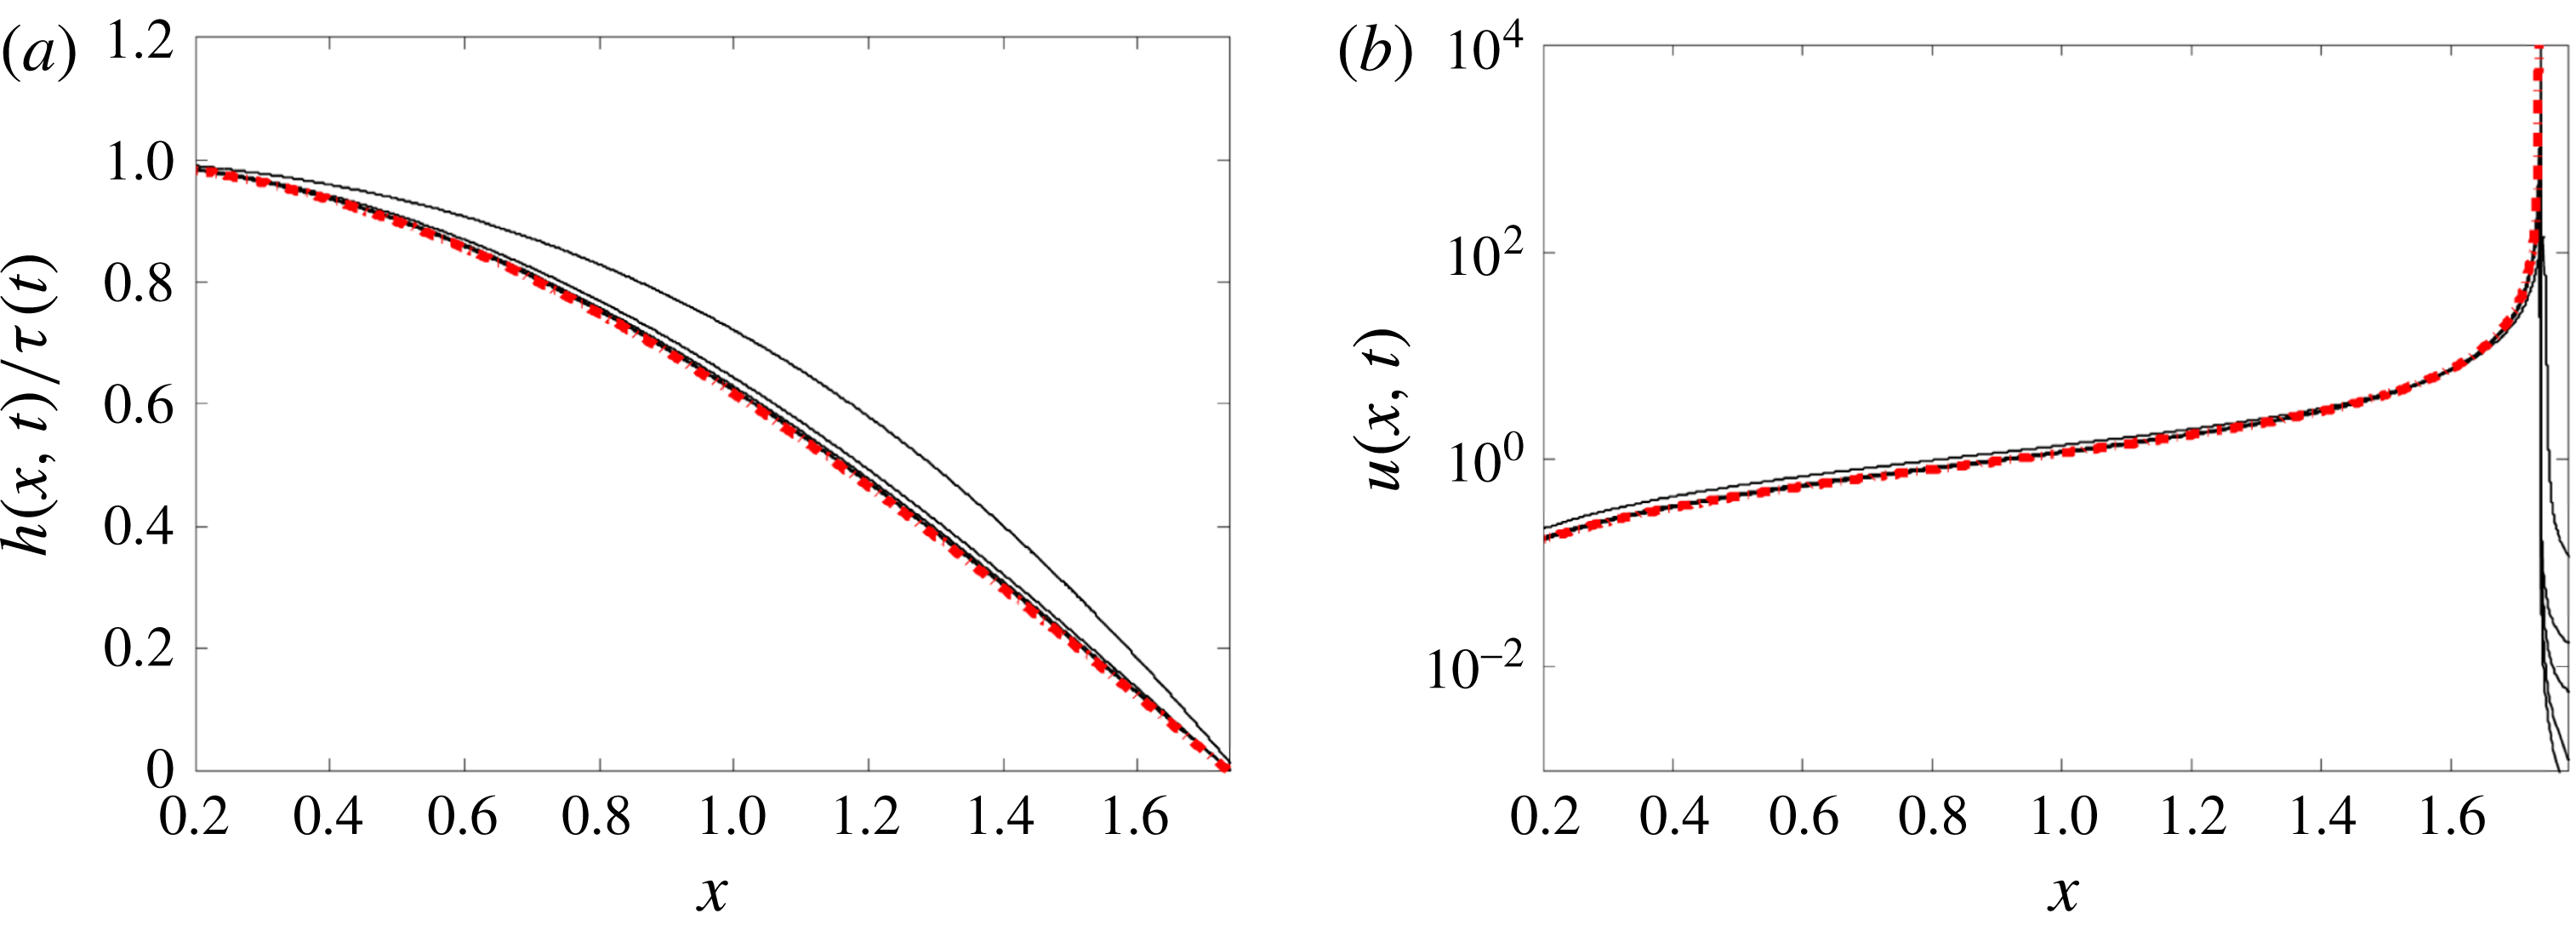
In figure 4 we present the leading-order film solutions (3.8) and (3.10) in the thin-film region (red dash-dotted curves), superimposed with full numerical solutions, rescaled according to (3.1). Even for times of order one, very convincing convergence towards the asymptotic solutions is found.
Comparison of a numerical solution of (2.2) (initial data and parameters as in figure 2), with the leading-order solutions (3.10) and (3.8) (dash-dotted curves), in the thin-film region. Five snapshots of (a) the height (linear plot) and (b) the velocity (log-linear plot) solutions to (2.2) are shown at times
 $t_{1}=2.247,~t_{2}=4.032,~t_{3}=5.138,~t_{4}=5.987,~t_{5}=6.800$
. The thinning rate
 $a=0.819$
was calculated from the numerical solution using (3.6). The pinch point was found to be
 $x_{0}\approx 1.7355$
, in very good agreement with (3.11).

3.2 Region IV: drop region
The total mass in the film region is of order
 $\unicode[STIX]{x1D70F}$
, which means that any change in the volume of the drop region is a subdominant correction. To leading order, the drop volume is constant and the drop thus converges towards a static shape, with no flow, and temperature is constant:
 $h(x,t)=h_{d}(x)$
and
 $\unicode[STIX]{x1D703}(x,t)=\unicode[STIX]{x1D703}_{r}$
, while
 $u(x,t)=0$
. The leading-order solution to (2.2b
) in this region must satisfy
 $h_{d}^{\prime \prime \prime }=0$
, and thus
 $$\begin{eqnarray}h_{d}(x)=C_{0}[(\unicode[STIX]{x03C0}-x_{0})^{2}-(x-\unicode[STIX]{x03C0})^{2}],\end{eqnarray}$$
where
 $x_{0}$
is the pinch point as in (3.11). The constants
 $C_{0}$
and
 $\unicode[STIX]{x1D703}_{r}$
are determined uniquely by conservation of mass and heat (2.4), which yield
 $$\begin{eqnarray}\int _{x_{0}}^{\unicode[STIX]{x03C0}}h_{d}(x)\,\text{d}x=M,\quad \int _{x_{0}}^{\unicode[STIX]{x03C0}}h_{d}(x)\unicode[STIX]{x1D703}_{r}\,\text{d}x=Q.\end{eqnarray}$$
From this the constants can be computed as
 $$\begin{eqnarray}C_{0}=\frac{3M}{2(\unicode[STIX]{x03C0}-x_{0})^{3}},\quad \unicode[STIX]{x1D703}_{r}=\frac{Q}{M}.\end{eqnarray}$$
In particular, we have the following expression for the macroscopic contact angle of the drop:
 $$\begin{eqnarray}h_{d}^{\prime }(x_{0})=\frac{3M}{2(\unicode[STIX]{x03C0}-x_{0})^{2}}\equiv s,\end{eqnarray}$$
which will be used later to match to the pinch region.
3.3 Region II: pinch region
Since this solution lives on an exponentially small scale set by the film thickness
 $\unicode[STIX]{x1D70F}$
, we try the similarity solution
 $$\begin{eqnarray}h(x,t)=\unicode[STIX]{x1D70F}^{\unicode[STIX]{x1D6FC}_{1}}H\left(\unicode[STIX]{x1D709}\right),\quad u(x,t)=\unicode[STIX]{x1D70F}^{\unicode[STIX]{x1D6FC}_{2}}U\left(\unicode[STIX]{x1D709}\right),\quad \unicode[STIX]{x1D703}(x,t)=\unicode[STIX]{x1D70F}^{\unicode[STIX]{x1D6FC}_{3}}\unicode[STIX]{x1D6E9}\left(\unicode[STIX]{x1D709}\right),\quad \unicode[STIX]{x1D709}=\frac{x-x_{0}}{\unicode[STIX]{x1D70F}^{\unicode[STIX]{x1D6FD}}}.\qquad\end{eqnarray}$$
Since the flux through the pinch region is
 $\unicode[STIX]{x1D70F}j_{0}=hu$
, we must have
 $\unicode[STIX]{x1D6FC}_{1}+\unicode[STIX]{x1D6FC}_{2}=1$
. We also expect (3.17) to match to the linear
 $h$
-profile (3.12), which implies that
 $\unicode[STIX]{x1D6FC}_{1}-\unicode[STIX]{x1D6FD}=1$
. Since the temperature changes over a scale of order unity, we have
 $\unicode[STIX]{x1D6FC}_{3}=0$
. Finally, Marangoni forces drive the pinch-off and thus must come in at leading order near the pinch point. We expect them to be balanced by viscous forces, which already come in the thin-film region, and thus should also be important on even smaller scales. Then from a balance of the last two terms of (2.2b
) we obtain
 $\unicode[STIX]{x1D6FC}_{2}-2\unicode[STIX]{x1D6FD}=-\unicode[STIX]{x1D6FD}-\unicode[STIX]{x1D6FC}_{1}$
, and combining all of the above yields
 $\unicode[STIX]{x1D6FD}=1$
,
 $\unicode[STIX]{x1D6FC}_{1}=2$
and
 $\unicode[STIX]{x1D6FC}_{2}=-1$
. Then the leading force balance in (2.2b
) is at
 $O(\unicode[STIX]{x1D70F}^{3})$
, and inertial, viscous and Marangoni forces come in at leading order.
Thus in the pinch region the similarity solution takes the form
 $$\begin{eqnarray}h(x,t)=\unicode[STIX]{x1D70F}^{2}H_{p}\left(\unicode[STIX]{x1D709}\right),\quad u(x,t)=\unicode[STIX]{x1D70F}^{-1}U_{p}\left(\unicode[STIX]{x1D709}\right),\quad \unicode[STIX]{x1D703}(x,t)=\unicode[STIX]{x1D6E9}_{p}\left(\unicode[STIX]{x1D709}\right),\quad \unicode[STIX]{x1D709}=\frac{x-x_{0}}{\unicode[STIX]{x1D70F}},\qquad\end{eqnarray}$$
and the similarity equations are
 $$\begin{eqnarray}\displaystyle & \displaystyle j_{0}=H_{p}U_{p}, & \displaystyle\end{eqnarray}$$
 $$\begin{eqnarray}\displaystyle & \displaystyle U_{p}U_{p}^{\prime }=4O\frac{(H_{p}U_{p}^{\prime })^{\prime }}{H_{p}}-{\mathcal{M}}\frac{\unicode[STIX]{x1D6E9}_{p}^{\prime }}{H_{p}}, & \displaystyle\end{eqnarray}$$
 $$\begin{eqnarray}\displaystyle & \displaystyle U_{p}\unicode[STIX]{x1D6E9}_{p}^{\prime }={\mathcal{D}}\left(\frac{H_{p}\unicode[STIX]{x1D6E9}_{p}^{\prime }}{H_{p}}\right)^{\prime }. & \displaystyle\end{eqnarray}$$
 $$\begin{eqnarray}\min _{x}h(x,t)\propto \unicode[STIX]{x1D70F}^{2}\propto \exp \{-8aOt\},\end{eqnarray}$$
which is confirmed numerically in figure 5.
Log-linear plot of the minimum height as a function of time (symbols) for the solution to (2.2), with parameters and initial data as in figures 2 and 4. The thinning rate
 $a=0.819$
was calculated from the numerical solution using (3.6). The solid line is the theoretical prediction (3.20). Constant
 $C_{4}=\log (\min _{\unicode[STIX]{x1D709}}H(\unicode[STIX]{x1D709})\unicode[STIX]{x1D70F}_{0}^{2})=\log (4^{(8{\mathcal{P}}-1)/(4{\mathcal{P}}-1)}O\sqrt{a})-\log (C_{+})+2\log (\unicode[STIX]{x1D70F}_{0})$
by (3.10b
), (3.19a
) and (3.32).

The flux condition (3.19a
) can be used to eliminate
 $H_{p}$
, and we obtain the two equations
 $$\begin{eqnarray}U_{p}^{\prime }=4O(U_{p}^{\prime }/U_{p})^{\prime }-{\mathcal{M}}\unicode[STIX]{x1D6E9}_{p}^{\prime }/j_{0},\quad \unicode[STIX]{x1D6E9}_{p}^{\prime }={\mathcal{D}}(\unicode[STIX]{x1D6E9}_{p}^{\prime }/U_{p})^{\prime }.\end{eqnarray}$$
Integrating the first equation in (3.21) one expresses the temperature profile dependence on
 $U_{p}$
explicitly as
 $$\begin{eqnarray}\unicode[STIX]{x1D6E9}_{p}=\frac{j_{0}}{{\mathcal{M}}}\left(4O\frac{U_{p}^{\prime }}{U_{p}}-U_{p}\right)+\unicode[STIX]{x1D703}_{l},\end{eqnarray}$$
where we have used the boundary conditions on the similarity profiles, as
 $\unicode[STIX]{x1D709}\rightarrow -\infty$
,
 $$\begin{eqnarray}H_{p}\approx -\frac{j_{0}\unicode[STIX]{x1D709}}{4O},\quad U_{p}\approx -\frac{4O}{\unicode[STIX]{x1D709}},\quad \unicode[STIX]{x1D6E9}_{p}\approx \unicode[STIX]{x1D703}_{l},\end{eqnarray}$$
which follow from comparison to (3.12).
Next, substitution of (3.22) into the second (temperature) equation of (3.21) gives the following ODE for the profile
 $U_{p}$
:
 $$\begin{eqnarray}4{\mathcal{D}}O(U_{p}^{\prime \prime }-U_{p}^{\prime 2}/U_{p})-(4O+{\mathcal{D}})U_{p}^{\prime }U_{p}+U_{p}^{3}+C_{2}U_{p}^{2}=0,\end{eqnarray}$$
with
 $C_{2}$
being a constant of integration. Evaluating the left-hand side of (3.24) for
 $\unicode[STIX]{x1D709}\rightarrow -\infty$
, once more using (3.23), one concludes that
 $C_{2}=0$
.
The second-order equation (3.24) can be turned into a first-order equation by putting
 $U_{p}^{\prime }(\unicode[STIX]{x1D709})=P(U_{p})$
, so that
 $U_{p}^{\prime \prime }=P^{\prime }P$
, and
 $$\begin{eqnarray}\frac{\text{d}P}{\text{d}U_{p}}=\frac{P}{U_{p}}+[{\mathcal{D}}^{-1}+(4O)^{-1}]U_{p}-\frac{U_{p}^{3}}{4{\mathcal{D}}OP}.\end{eqnarray}$$
The observation that (3.25) is invariant under
 $U_{p}\rightarrow C_{+}U_{p}$
and
 $P\rightarrow C_{+}^{2}P$
suggests the substitution
 $$\begin{eqnarray}P=\frac{wU_{p}^{2}}{4\sqrt{{\mathcal{D}}O}},\end{eqnarray}$$
which reduces (3.25) to the separable ODE
 $$\begin{eqnarray}\frac{\text{d}U_{p}}{U_{p}}=\frac{\text{d}w}{4\sqrt{{\mathcal{P}}}+\sqrt{{\mathcal{P}}}^{-1}-4/w-w}.\end{eqnarray}$$
From (3.23) it follows that
 $w$
must satisfy the boundary condition
 $w\approx \sqrt{{\mathcal{P}}}^{-1}$
for
 $U_{p}\rightarrow 0$
. Hence, for each
 ${\mathcal{P}}>0$
, bounded solutions of (3.27) have the form
 $$\begin{eqnarray}\displaystyle U_{p}(w)=\left\{\begin{array}{@{}ll@{}}\left.C_{+}\left(\sqrt{{\mathcal{P}}}^{-1}-w\right)^{1/(4{\mathcal{P}}-1)}\right/\left(4\sqrt{{\mathcal{P}}}-w\right)^{4{\mathcal{P}}/(4{\mathcal{P}}-1)}\quad & \text{for }{\mathcal{P}}\not ={\displaystyle \frac{1}{4}},\\ \left.C_{+}\exp \left\{{\displaystyle \frac{2}{w-2}}\right\}\right/(2-w)\quad & \text{for }{\mathcal{P}}={\displaystyle \frac{1}{4}};\end{array}\right. & & \displaystyle\end{eqnarray}$$
they are parametrized by a positive constant
 $C_{+}$
and are defined in the range
 $w\in (-\infty ,\sqrt{{\mathcal{P}}}^{-1})$
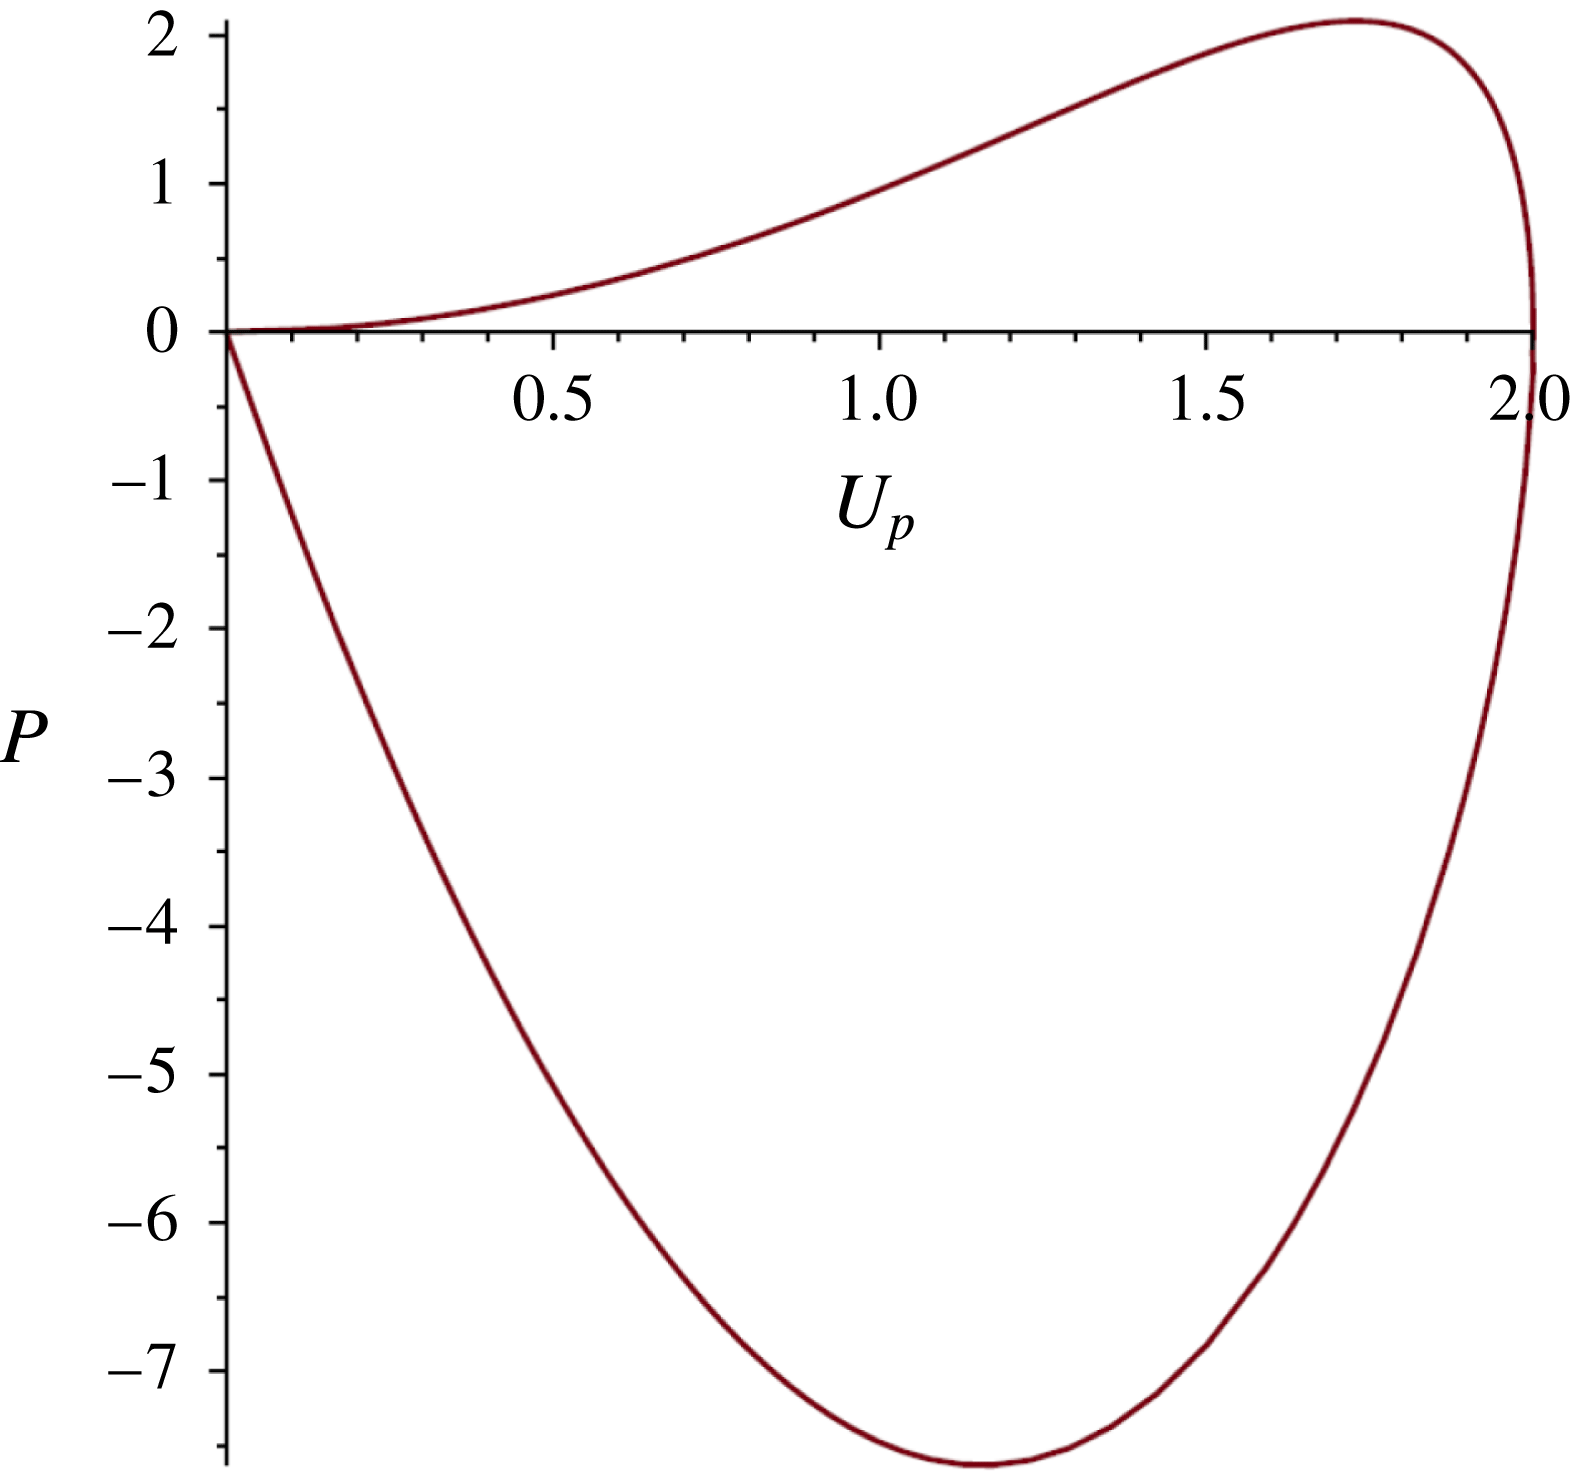
. A typical plot of
 $P(U_{p})$
is shown in figure 6. The behaviour near the origin on the upper lobe is
 $P\approx U_{p}^{2}/(4O)$
, and corresponds to
 $\unicode[STIX]{x1D709}\rightarrow -\infty$
, where
 $U_{p}^{\prime }>0$
. This matches the expected asymptotic behaviour (3.23). The lower lobe near the origin, on the other hand, corresponds to
 $\unicode[STIX]{x1D709}\rightarrow \infty$
, and here
 $U\approx -C_{+}/w$
, so that
 $$\begin{eqnarray}P\approx -\frac{C_{+}U}{4O\sqrt{{\mathcal{P}}}^{-1}},\quad \unicode[STIX]{x1D709}\rightarrow \infty .\end{eqnarray}$$


Differentiating (3.28) with respect to
 $\unicode[STIX]{x1D709}$
yields
 $$\begin{eqnarray}\displaystyle \frac{wU_{p}^{2}}{4\sqrt{{\mathcal{P}}}^{-1}O}=\left\{\begin{array}{@{}ll@{}}\!-C_{+}{\displaystyle \frac{\text{d}w}{\text{d}\unicode[STIX]{x1D709}}}w(\sqrt{{\mathcal{P}}}^{-1}-\,w)^{(2-4{\mathcal{P}})/(4{\mathcal{P}}-1)}(4\sqrt{{\mathcal{P}}}\,-\,w)^{(1-8{\mathcal{P}})/(4{\mathcal{P}}-1)}\!\quad & \text{for }{\mathcal{P}}\not ={\displaystyle \frac{1}{4}},\\ \!-C_{+}{\displaystyle \frac{\text{d}w}{\text{d}\unicode[STIX]{x1D709}}}{\displaystyle \frac{w}{(2-w)^{3}}}\exp \left\{{\displaystyle \frac{2}{w-2}}\right\}\!\quad & \text{for }{\mathcal{P}}={\displaystyle \frac{1}{4}},\end{array}\right. & & \displaystyle \nonumber\\ \displaystyle & & \displaystyle\end{eqnarray}$$
which, upon substituting (3.28) back in, can be integrated to give
 $$\begin{eqnarray}\displaystyle \unicode[STIX]{x1D709}=\left\{\begin{array}{@{}ll@{}}\left.-{\displaystyle \frac{4O\sqrt{{\mathcal{P}}}^{-1}}{C_{+}}}\displaystyle \int _{0}^{w}\left(4\sqrt{{\mathcal{P}}}-s\right)^{1/(4{\mathcal{P}}-1)}\!\right/\!\left(\sqrt{{\mathcal{P}}}^{-1}-s\right)^{4{\mathcal{P}}/(4{\mathcal{P}}-1)}\,\text{d}s\quad & \text{for }{\mathcal{P}}\not ={\displaystyle \frac{1}{4}},\\ \left.-{\displaystyle \frac{8O}{C_{+}}}\displaystyle \int _{0}^{w}\exp \left\{-{\displaystyle \frac{2}{s-2}}\right\}\right/(2-s)\,\text{d}s\quad & \text{for }{\mathcal{P}}={\displaystyle \frac{1}{4}}.\end{array}\right. & & \displaystyle \nonumber\\ \displaystyle & & \displaystyle\end{eqnarray}$$
In (3.31), the origin
 $\unicode[STIX]{x1D709}=0$
has been chosen arbitrarily as the point with
 $U_{p}^{\prime }(0)=0$
and
 $U_{p}(0)=U_{max}$
, with the maximum given by
 $$\begin{eqnarray}U_{max}=\left\{\begin{array}{@{}ll@{}}C_{+}/4^{4{\mathcal{P}}/(4{\mathcal{P}}-1)}\quad & \text{for }{\mathcal{P}}\not =\frac{1}{4},\\ C_{+}/(2e)\quad & \text{for }{\mathcal{P}}=\frac{1}{4}.\end{array}\right.\end{eqnarray}$$
Combining (3.28) with (3.31) yields a parametric representation of the pinch profile
 $U_{p}(\unicode[STIX]{x1D709})$
with respect to the parameter
 $w\in (-\infty ,\sqrt{{\mathcal{P}}}^{-1})$
(for a typical profile, see figure 7). For
 $w\rightarrow -\infty$
, (3.31) implies that
 $$\begin{eqnarray}\unicode[STIX]{x1D709}\approx \frac{4O\sqrt{{\mathcal{P}}}^{-1}}{C_{+}}\ln |w|,\quad \forall ~{\mathcal{P}}>0\end{eqnarray}$$
and since according to (3.28)
 $U_{p}\approx C_{+}/|w|$
in the same limit, we have
 $$\begin{eqnarray}H_{p}\approx \frac{j_{0}}{C_{+}}\text{e}^{(C_{+}\sqrt{{\mathcal{P}}}/4O)\unicode[STIX]{x1D709}},\quad U_{P}\approx C_{+}\text{e}^{-(C_{+}\sqrt{{\mathcal{P}}}/4O)\unicode[STIX]{x1D709}},\quad \forall ~{\mathcal{P}}>0.\end{eqnarray}$$
Note that we can write (3.34) in the original variables as
 $$\begin{eqnarray}\displaystyle u(x,t) & {\approx} & \displaystyle \frac{1}{\unicode[STIX]{x1D70F}(t)}C_{+}\exp \left\{-\frac{C_{+}\sqrt{{\mathcal{P}}}}{4O}\frac{(x-x_{0})}{\unicode[STIX]{x1D70F}(t)}\right\}\nonumber\\ \displaystyle & = & \displaystyle C_{+}\exp \left\{-\frac{(C_{+}\sqrt{{\mathcal{P}}}/4O)(x-x_{0})+\unicode[STIX]{x1D70F}(t)\log [\unicode[STIX]{x1D70F}(t)]}{\unicode[STIX]{x1D70F}(t)}\right\},\end{eqnarray}$$
a representation that will turn out to be useful in the next subsection for matching to the solutions in the transitional region (cf. (3.51)).
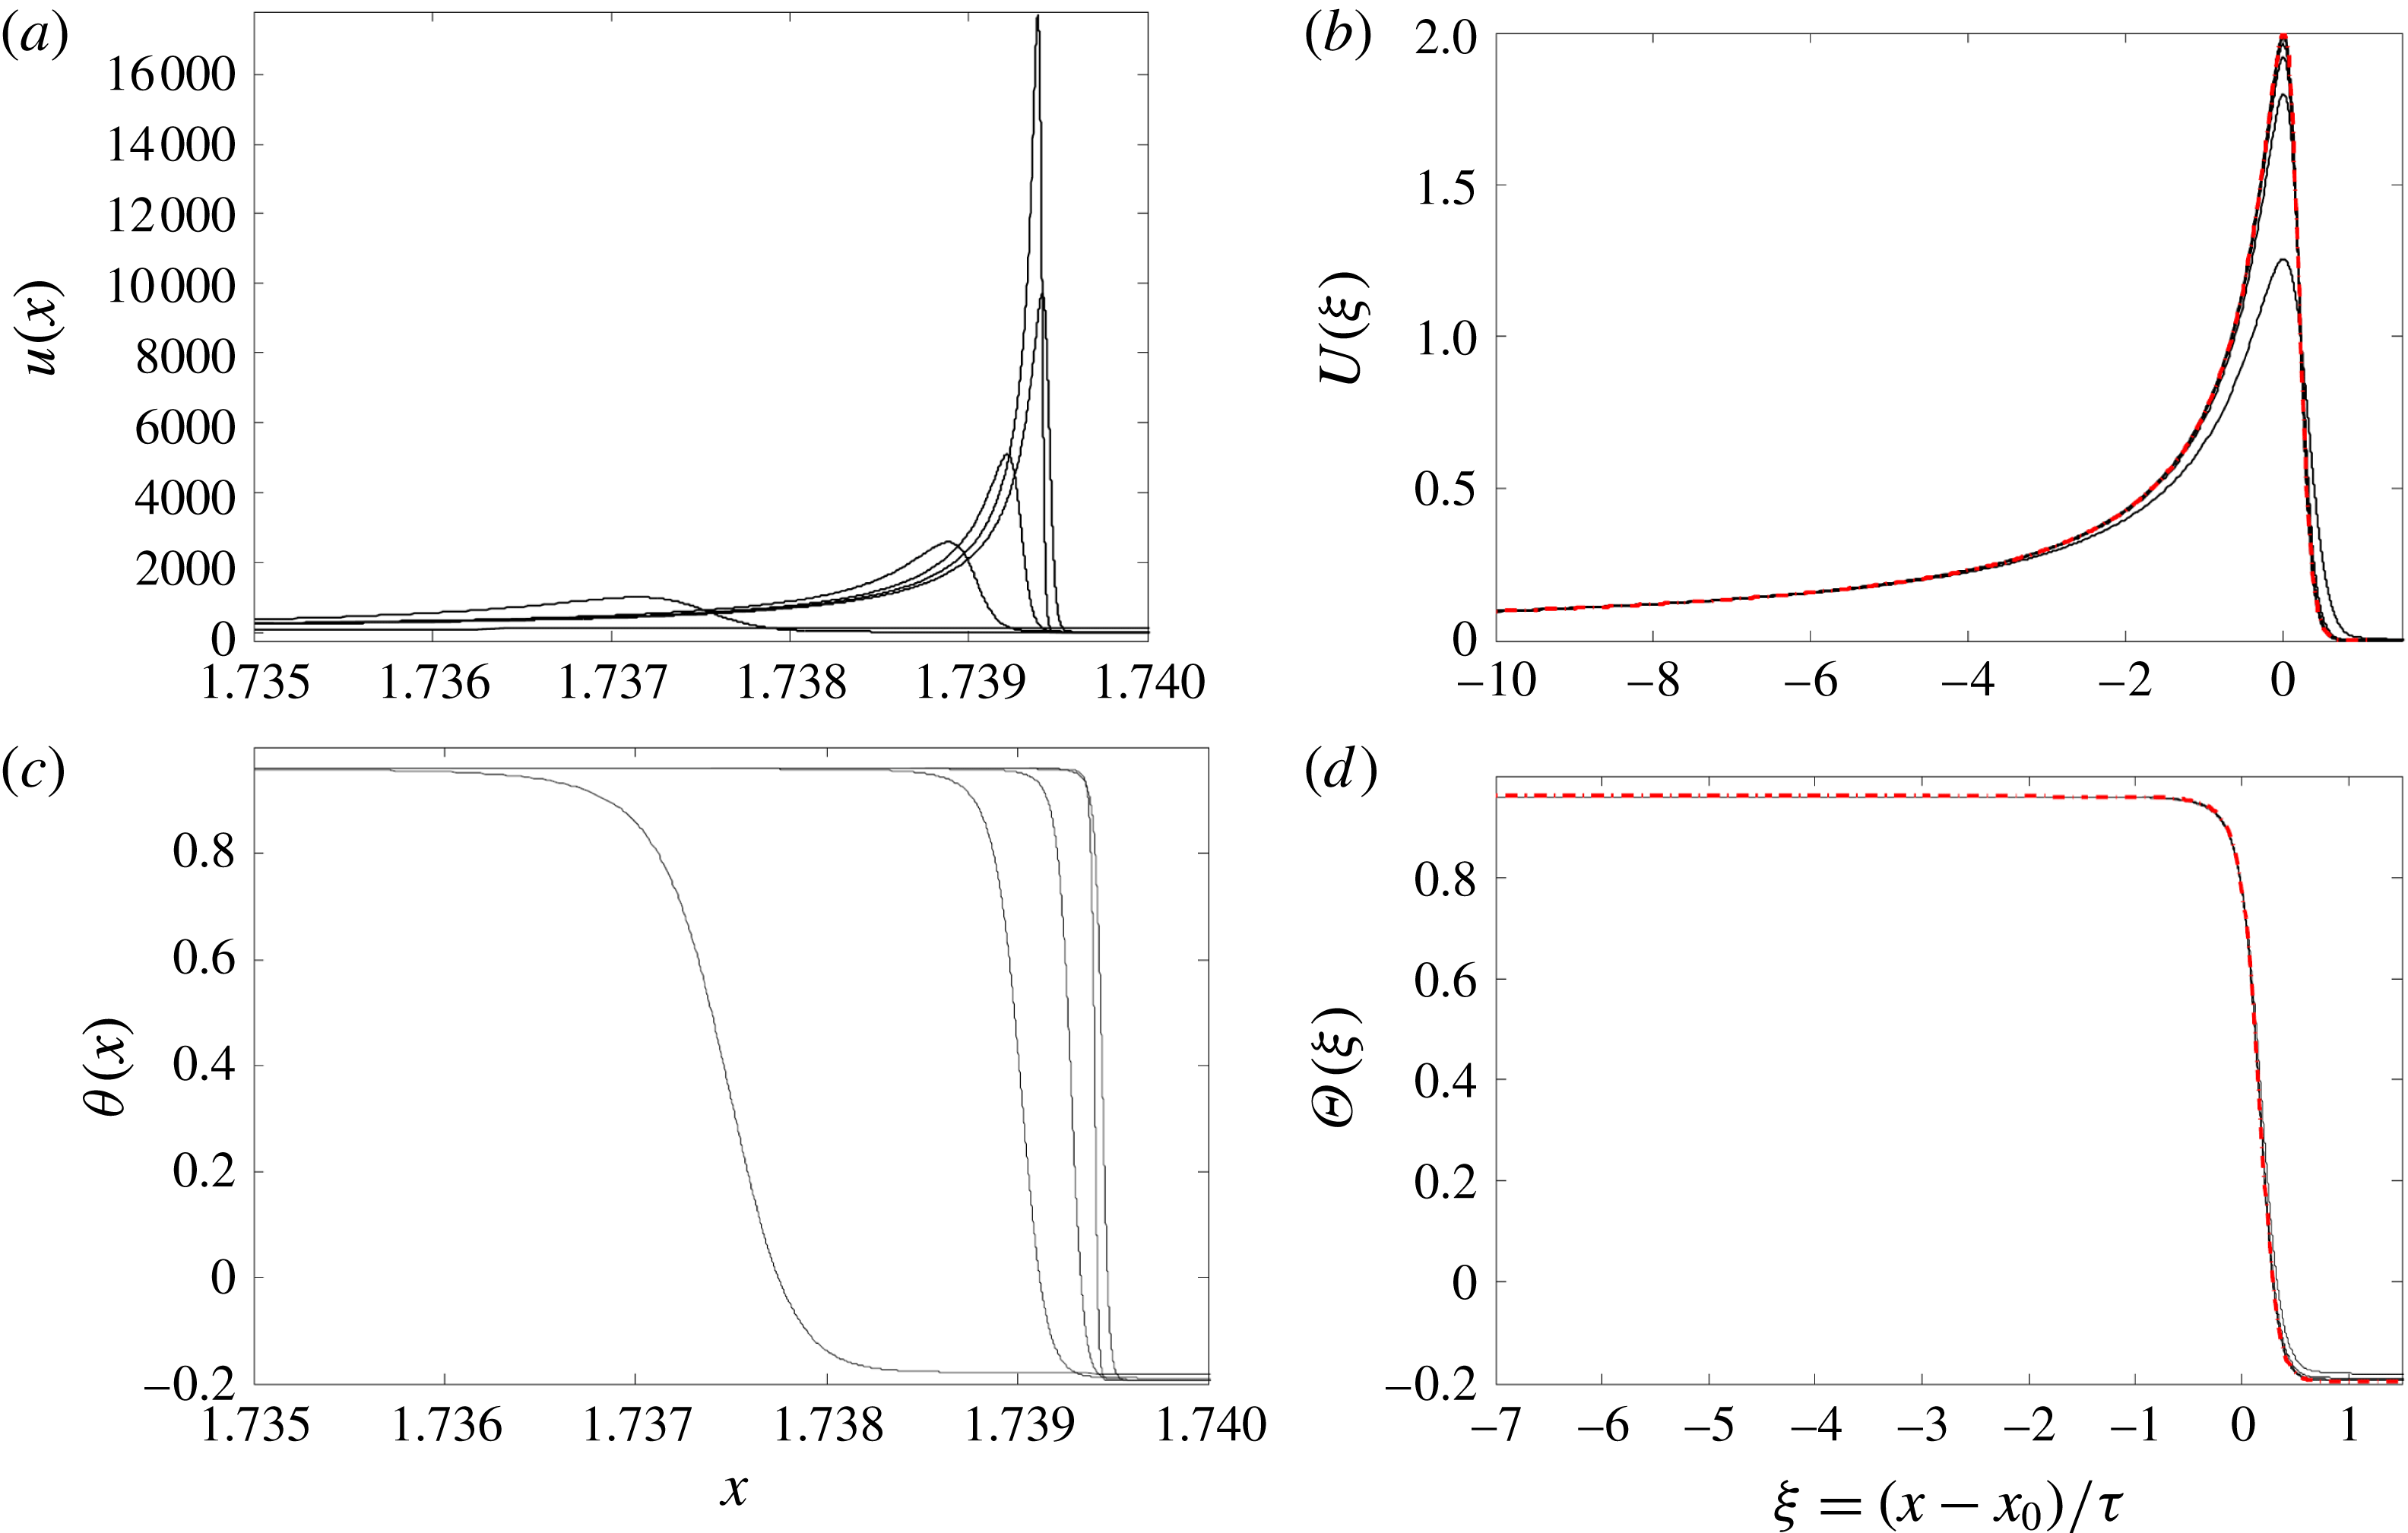
Similarity description of the pinch region. Five snapshots of the velocity (a,b) and temperature (c,d) profiles taken at times
 $t_{1}=4.032,~t_{2}=5.138,~t_{3}=5.987,~t_{4}=6.800,~t_{5}=7.6410$
(solid lines). (a,c) Numerical solution using the same simulation as in figure 2. (b,d) Profiles have been rescaled according to (3.17), with exact solutions (3.28) and (3.36) (dash-dotted lines) superimposed.

The temperature profile is found from (3.22) and (3.28) to be
 $$\begin{eqnarray}\unicode[STIX]{x1D6E9}_{p}=\left\{\begin{array}{@{}ll@{}}\unicode[STIX]{x1D703}_{l}-{\displaystyle \frac{j_{0}C_{+}}{{\mathcal{M}}}}\sqrt{{\mathcal{P}}}\left({\displaystyle \frac{\sqrt{{\mathcal{P}}}^{-1}-w}{4\sqrt{{\mathcal{P}}}-w}}\right)^{4{\mathcal{P}}/(4{\mathcal{P}}-1)}\quad & \text{for }{\mathcal{P}}\not ={\displaystyle \frac{1}{4}},\\ \unicode[STIX]{x1D703}_{l}-{\displaystyle \frac{j_{0}C_{+}}{2{\mathcal{M}}}}\exp \left\{{\displaystyle \frac{2}{w-2}}\right\}\quad & \text{for }{\mathcal{P}}={\displaystyle \frac{1}{4}}.\end{array}\right.\end{eqnarray}$$
In figure 7, the similarity description (3.17) of the pinch region is tested against a typical numerical simulation of the original system (2.2). On the left, we show the raw data close to the pinch point
 $x_{0}$
, while rescaled profiles are shown on the right. One sees very good convergence towards the exact solutions (3.28) and (3.36), which are shown as the red dash-dotted lines. Note that the temperature experiences a finite variation over the pinch region, which is of size
 $\unicode[STIX]{x1D70F}$
. This length is much larger than the thickness of the sheet, which is of order
 $\unicode[STIX]{x1D70F}^{2}$
. Hence information from the boundary diffuses quickly into the bulk, and the temperature can effectively be treated as constant across the sheet, so our long-wavelength theory still applies.
By taking the limit
 $w\rightarrow -\infty$
, which corresponds to
 $\unicode[STIX]{x1D709}\rightarrow \infty$
, we find the following condition on the jump of the temperature across the pinch-off (see figure 3):
 $$\begin{eqnarray}\unicode[STIX]{x1D703}_{r}=\unicode[STIX]{x1D703}_{l}-\frac{j_{0}C_{+}}{{\mathcal{M}}}\sqrt{{\mathcal{P}}}<\unicode[STIX]{x1D703}_{l},\quad \forall ~{\mathcal{P}}>0;\end{eqnarray}$$
in particular, it shows that necessarily
 $\unicode[STIX]{x1D703}_{r}<\unicode[STIX]{x1D703}_{l}$
. It is thus seen from (3.34) that
 $H_{p}$
grows exponentially, which does not match the drop profile, which has a finite slope (3.16). This means we need another region between the pinch region II and the drop IV, which we call the transition region.
3.4 Region III: transition region
Here we use the same similarity form (3.17) as before, but the balance is different. On account of flux conservation, we have
 $\unicode[STIX]{x1D6FC}_{1}+\unicode[STIX]{x1D6FC}_{2}=1$
as before. We also require the transitional solution to match onto the linear drop profile for
 $\unicode[STIX]{x1D709}\rightarrow \infty$
, which implies that
 $\unicode[STIX]{x1D6FC}_{1}=\unicode[STIX]{x1D6FD}$
. Finally, we expect surface tension to enter the force balance (2.2b
), so that from a balance between surface tension and viscous forces we have
 $\unicode[STIX]{x1D6FC}_{1}-3\unicode[STIX]{x1D6FD}=\unicode[STIX]{x1D6FC}_{2}-2\unicode[STIX]{x1D6FD}$
. From these conditions we deduce the exponents
 $\unicode[STIX]{x1D6FC}_{1}=1$
,
 $\unicode[STIX]{x1D6FC}_{2}=0$
and
 $\unicode[STIX]{x1D6FD}=1$
, and the similarity solution becomes
 $$\begin{eqnarray}h(x,t)=\unicode[STIX]{x1D70F}H_{t}\left(\unicode[STIX]{x1D709}\right),\quad u(x,t)=U_{t}\left(\unicode[STIX]{x1D709}\right),\quad \unicode[STIX]{x1D703}(x,t)=\unicode[STIX]{x1D6E9}_{t}\left(\unicode[STIX]{x1D709}\right),\quad \unicode[STIX]{x1D709}=\frac{x-x_{1}(t)}{\unicode[STIX]{x1D70F}},\quad\end{eqnarray}$$
where
 $x_{1}(t)$
denotes the centre of the transition region, which will be shown below to be slightly different from the pinch point
 $x_{0}$
. The similarity equations corresponding to (3.38) are
 $$\begin{eqnarray}\displaystyle & \displaystyle j_{0}=H_{t}U_{t}, & \displaystyle\end{eqnarray}$$
 $$\begin{eqnarray}\displaystyle & \displaystyle 0=H_{t}^{\prime \prime \prime }-4O\frac{(U_{t}^{\prime }H_{t})^{\prime }}{H_{t}}, & \displaystyle\end{eqnarray}$$
 $$\begin{eqnarray}\displaystyle & \displaystyle 0=(H_{t}\unicode[STIX]{x1D6E9}_{t}^{\prime })^{\prime }. & \displaystyle\end{eqnarray}$$
 $O(\unicode[STIX]{x1D70F}^{-2})$
.
Once more, we insert
 $U_{t}^{\prime }=-j_{0}H_{t}^{\prime }/H_{t}^{2}$
into (3.39b
) and integrate once, to obtain
 $$\begin{eqnarray}C_{3}=H_{t}^{\prime \prime }H_{t}-\frac{H_{t}^{\prime 2}}{2}-4Oj_{0}\frac{H_{t}^{\prime }}{H_{t}}.\end{eqnarray}$$
For (3.39c
) to be consistent with a general
 $H_{t}$
-profile,
 $\unicode[STIX]{x1D6E9}=\unicode[STIX]{x1D703}_{r}$
must be a constant, which is consistent with (3.37), where we matched the temperature profile in the pinch region directly to the constant value
 $\unicode[STIX]{x1D703}_{r}$
. In order to match to the constant slope (3.16) for
 $\unicode[STIX]{x1D709}\rightarrow \infty$
, we must have
 $H_{t}\approx s\unicode[STIX]{x1D709}$
for
 $\unicode[STIX]{x1D709}\rightarrow \infty$
, and thus
 $C_{3}=-s^{2}/2$
.
Rescaling (3.40) according to
 $$\begin{eqnarray}H_{t}=\frac{8Oj_{0}}{\sqrt{2}s}f\left(\unicode[STIX]{x1D701}\right),\quad \unicode[STIX]{x1D701}=\frac{s^{2}}{8Oj_{0}}\unicode[STIX]{x1D709},\end{eqnarray}$$
it turns into
 $$\begin{eqnarray}-1=f^{\prime \prime }f-f^{\prime 2}/2-f^{\prime }/f.\end{eqnarray}$$
Putting
 $p(f)=f^{\prime }$
, the phase-plane representation of (3.42) is
 $$\begin{eqnarray}p^{\prime }=\frac{p}{2f}+\frac{1}{f^{2}}-\frac{1}{pf}.\end{eqnarray}$$
In order to match to (3.34),
 $H_{t}$
must behave exponentially for
 $\unicode[STIX]{x1D709}\rightarrow -\infty$
, which means that
 $p\sim f$
near the origin of the
 $p{-}f$
plane. On the other hand, for
 $\unicode[STIX]{x1D709}\rightarrow \infty$
we have seen that
 $H_{t}\approx s\unicode[STIX]{x1D709}$
, and so
 $p\approx \sqrt{2}$
for
 $f\rightarrow \infty$
.
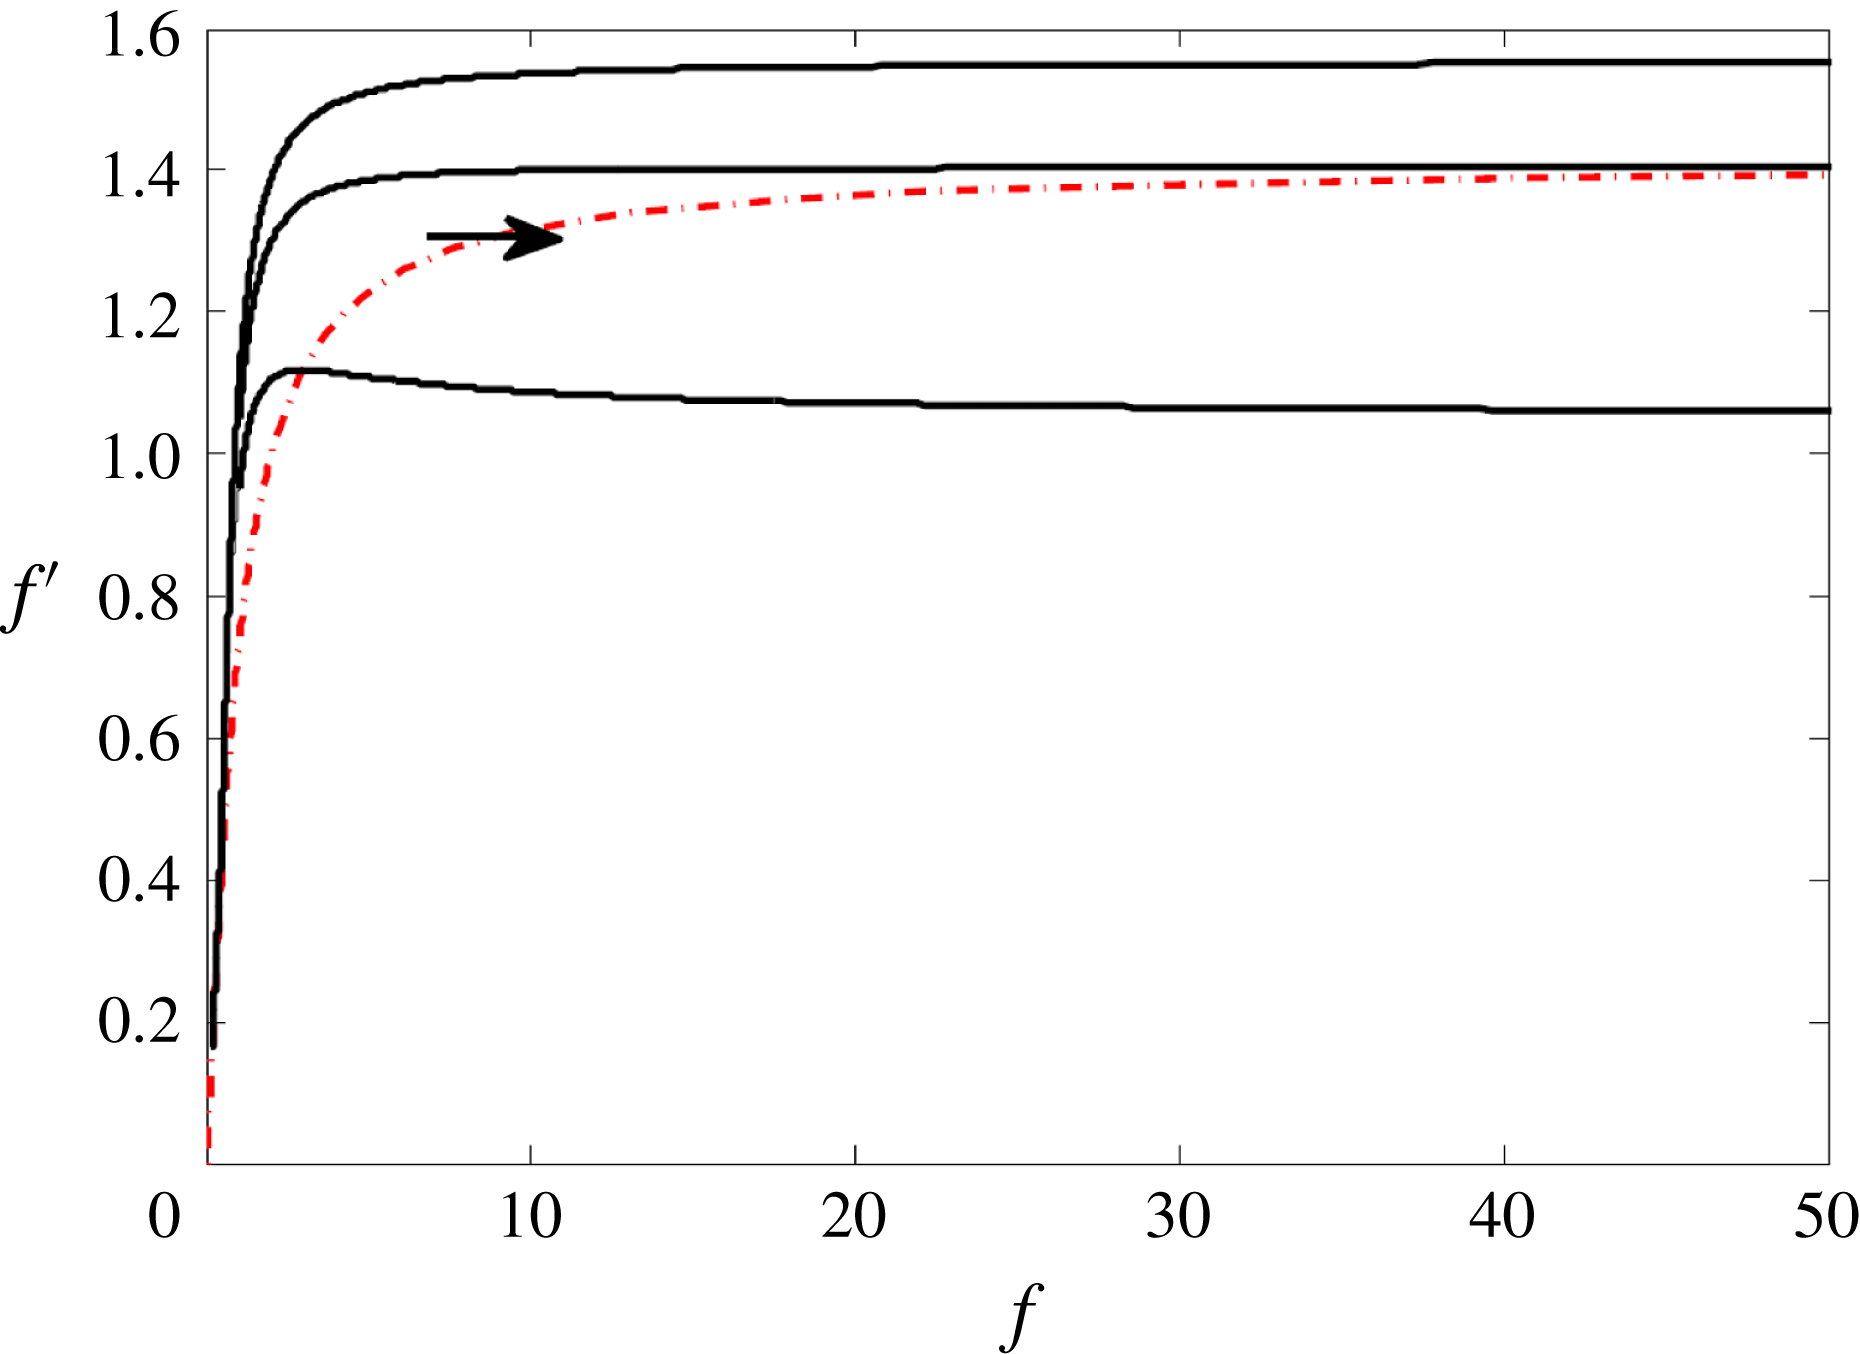
Phase-plane portrait of the ODE (3.43). The solid lines correspond to the orbits and the dash-dotted line is the nullcline
 $p=0$
.

The nullcline
 $p^{\prime }=0$
is the curve
 $$\begin{eqnarray}f=\frac{p}{1-p^{2}/2},\end{eqnarray}$$
which is shown in the phase portrait, figure 8, together with some typical solutions of (3.43). An inspection of the phase plane reveals that there is a unique orbit that approaches the nullcline asymptotically as
 $f\rightarrow \infty$
. As seen from (3.44), this is the solution that has the right asymptotics for
 $f\rightarrow \infty$
.
For the solutions shown in figure 8, a more careful analysis at the origin of the phase plane is necessary. Assuming a regular expansion yields the series
 $$\begin{eqnarray}p=f+\frac{f^{3}}{2}+\cdots \equiv p_{0}(f),\end{eqnarray}$$
which has no free parameters. To find the missing degree of freedom, we put
 $p(f)=p_{0}(f)+\unicode[STIX]{x1D6FF}(f)$
, and linearize in
 $\unicode[STIX]{x1D6FF}$
to find
 $$\begin{eqnarray}\unicode[STIX]{x1D6FF}^{\prime }=\unicode[STIX]{x1D6FF}\left(\frac{2}{f}-\frac{p_{0}^{\prime }}{p_{0}}+\frac{1}{p_{0}f^{2}}\right)\approx \frac{\unicode[STIX]{x1D6FF}}{f^{3}},\end{eqnarray}$$
for small
 $f$
. Making the Wentzel–Kramers–Brillouin (WKB) ansatz
 $$\begin{eqnarray}\unicode[STIX]{x1D6FF}=\unicode[STIX]{x1D6FF}_{0}\text{e}^{-Af^{\unicode[STIX]{x1D6FC}}+\cdots },\end{eqnarray}$$
a leading-order balance as
 $f\rightarrow \infty$
yields
 $\unicode[STIX]{x1D6FC}=-2$
and
 $A=1/2$
. Thus close to the origin, we arrive at the representation
 $$\begin{eqnarray}p=f+\frac{f^{3}}{2}+\cdots +\unicode[STIX]{x1D6FF}_{0}\text{e}^{-1/(2f^{2})},\end{eqnarray}$$
where the degree of freedom is in the parameter
 $\unicode[STIX]{x1D6FF}_{0}$
. Now one can solve (3.43) by shooting from the origin to infinity, as shown in figure 8. The value of
 $\unicode[STIX]{x1D6FF}$
is varied until the solution asymptotes to the correct value
 $p=\sqrt{2}$
.
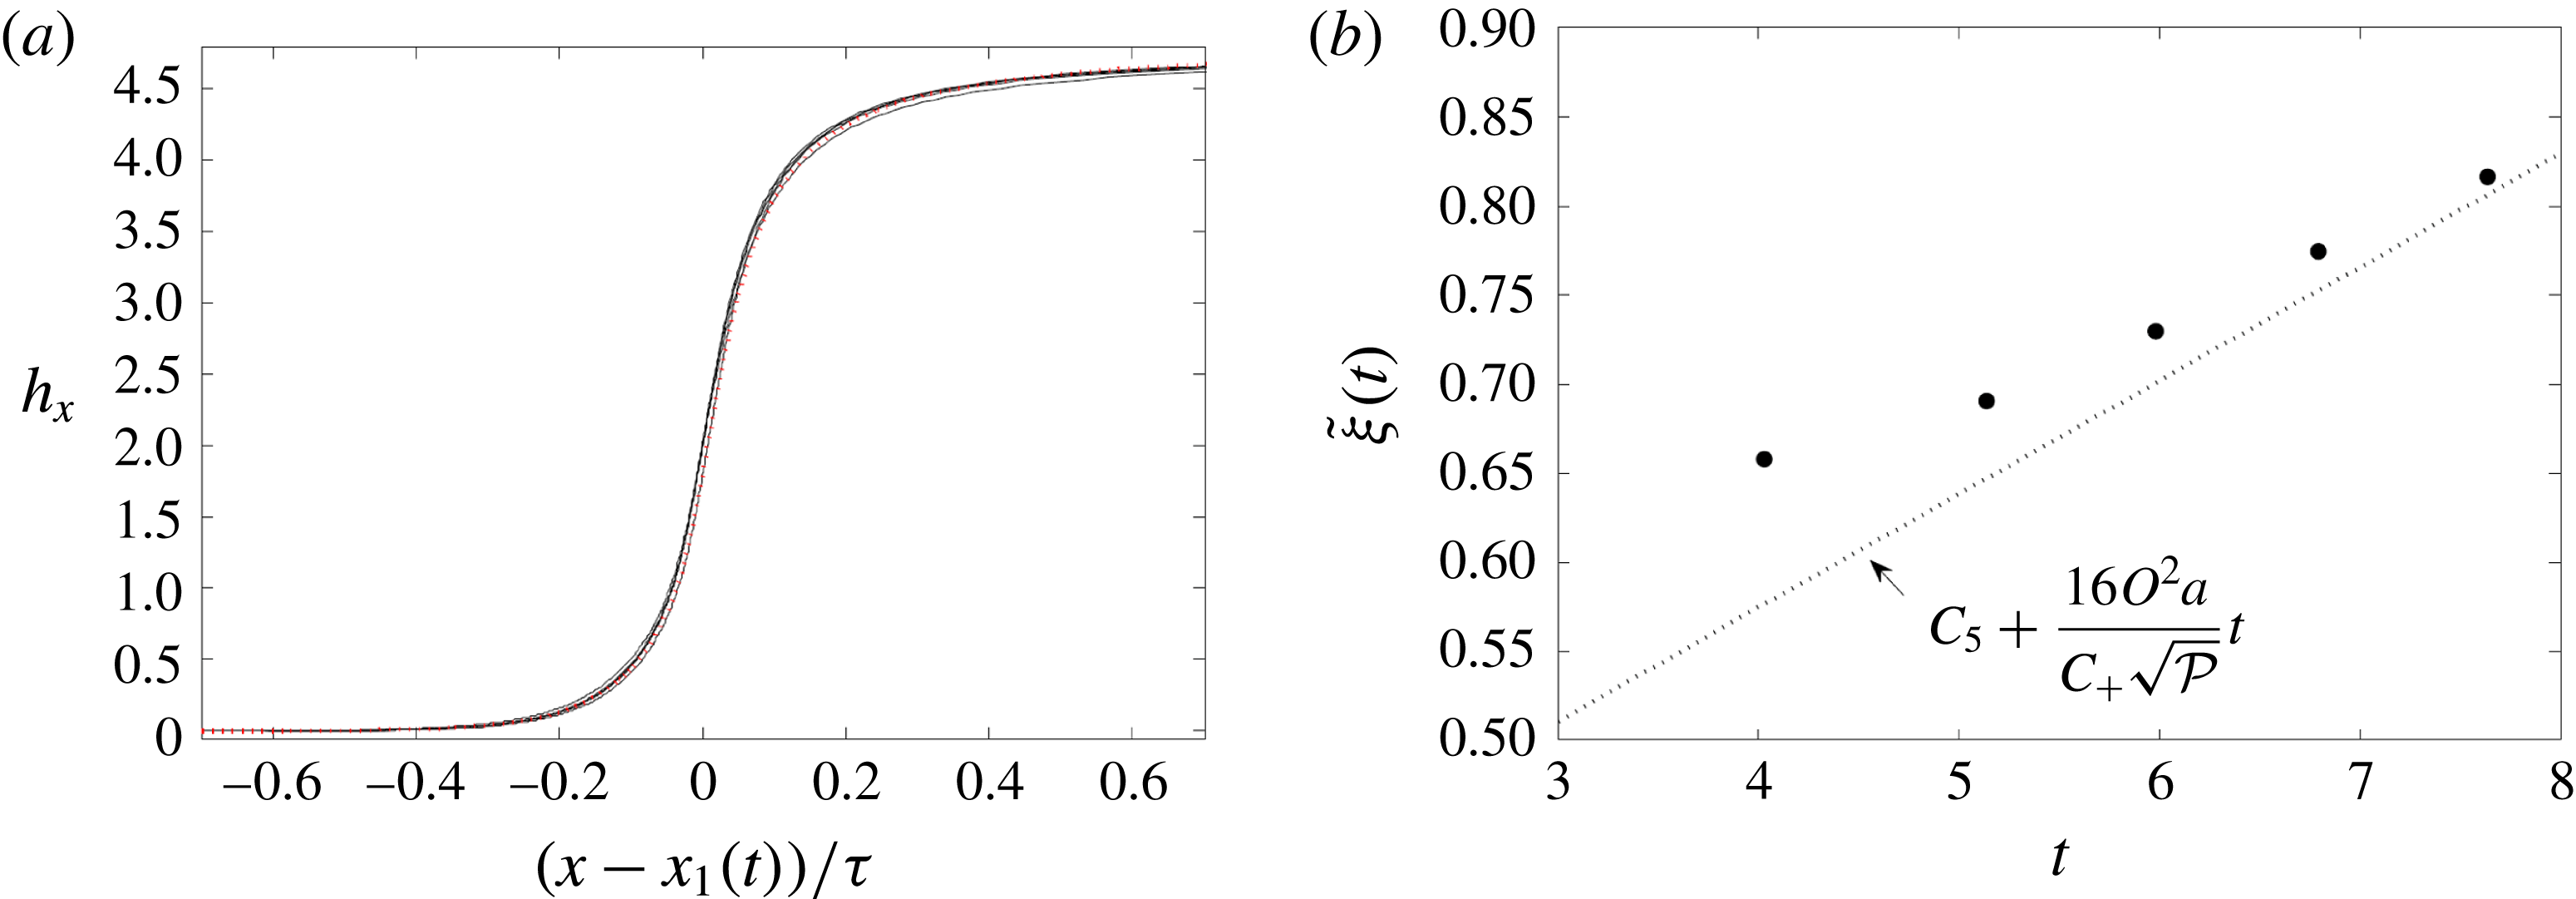
Similarity description of the transition region. (a) Five snapshots of the spatial derivative of the height profile
 $h_{x}(x,t)=H_{t}^{\prime }(\unicode[STIX]{x1D709})$
, using the same simulation as in figure 2, for times
 $t_{1}=4.032$
,
 $t_{2}=5.138$
,
 $t_{3}=5.987$
,
 $t_{4}=6.800$
,
 $t_{5}=7.6410$
(solid lines). Data from the transition region are shown in self-similar variables (3.38). Each curve is shifted such that
 $H_{t}^{\prime }(0)=2$
, which defines
 $x_{1}(t)$
; the collapsed profiles are compared to the solution of (3.40) (dotted line), obtained by the shooting method. (b) The corresponding values of
 $\tilde{\unicode[STIX]{x1D709}}_{i}=(x_{1}(t_{i})-x_{0})/\unicode[STIX]{x1D70F}(t_{i}),~i=1,\ldots ,5$
(dots) compared to the prediction (3.54) (dotted line). The value of
 $a$
is taken from figure 4. Constant
 $C_{5}=-\log (\unicode[STIX]{x1D70F}_{0})4O/(C_{+}{\mathcal{P}})$
by (3.54).

Once we have obtained
 $p(f)=f^{\prime }(\unicode[STIX]{x1D701})$
, we find
 $f(\unicode[STIX]{x1D701})$
by (numerical) integration and thus
 $H_{t}(\unicode[STIX]{x1D709})$
from (3.41). The derivative
 $H_{t}^{\prime }(\unicode[STIX]{x1D709})$
is shown on the left of figure 9 as the red dotted line, and compared to
 $h_{x}$
, as found from a numerical simulation of the full system (2.2). Allowing for a horizontal shift (which determines
 $x_{1}(t)$
, see below), excellent agreement is found.
For small
 $f$
(
 $\unicode[STIX]{x1D709}\rightarrow -\infty$
),
 $f^{\prime }=f$
yields
 $$\begin{eqnarray}f\approx f_{0}\text{e}^{\unicode[STIX]{x1D701}}=f_{0}\text{e}^{(s^{2}/8Oj_{0})\unicode[STIX]{x1D709}};\end{eqnarray}$$
which transforms to the asymptotics
 $$\begin{eqnarray}H_{t}\approx B\text{e}^{(s^{2}/8Oj_{0})\unicode[STIX]{x1D709}}\quad \text{and}\quad U_{t}\approx \frac{j_{0}}{B}\text{e}^{-(s^{2}/8Oj_{0})\unicode[STIX]{x1D709}}\quad \text{as}~\unicode[STIX]{x1D709}\rightarrow -\infty ,\end{eqnarray}$$
as well as
 $$\begin{eqnarray}u(x,t)\approx \frac{j_{0}}{B}\exp \left\{-\frac{s^{2}}{8Oj_{0}}\frac{x-x_{1}(t)}{\unicode[STIX]{x1D70F}(t)}\right\}\end{eqnarray}$$
in the original variables. Comparing to the asymptotics in the pinch-off region (3.35), we find the following matching conditions:
 $$\begin{eqnarray}\displaystyle & \displaystyle C_{+}=\frac{s^{2}}{2j_{0}\sqrt{{\mathcal{P}}}}, & \displaystyle\end{eqnarray}$$
 $$\begin{eqnarray}\displaystyle & \displaystyle B=\frac{j_{0}}{C_{+}}, & \displaystyle\end{eqnarray}$$
 $$\begin{eqnarray}\displaystyle & \displaystyle \tilde{\unicode[STIX]{x1D709}}(t)=\frac{x_{1}(t)-x_{0}}{\unicode[STIX]{x1D70F}(t)}=-\log (\unicode[STIX]{x1D70F}(t))\frac{4O}{C_{+}{\mathcal{P}}}=-\log (\unicode[STIX]{x1D70F}_{0})\frac{4O}{C_{+}{\mathcal{P}}}+\frac{16O^{2}a}{C_{+}\sqrt{{\mathcal{P}}}}t>0, & \displaystyle\end{eqnarray}$$
where in the last equality in (3.54) we have used (3.5). On the right of figure 9 we test (3.54), shown as the dotted line, against the shift
 $x_{1}(t)$
, as obtained from a direct numerical simulation (dots). For large times, the dots are seen to approach the theoretical prediction.
4 Discussion and conclusions
In this study we have derived the leading-order analytical structure of self-similar solutions describing the thermal rupture of a thin viscous liquid sheet, and provided a consistent matching of them to the outer solutions. The leading-order solutions in the film region are given by the velocity and height profiles (3.8) and (3.10), respectively. The film thins exponentially according to (3.5), while the macroscopic drop to its right has a parabolic profile (3.13)–(3.15), with no flow inside. We derived explicit formulae for the self-similar solutions (3.28)–(3.31) and (3.36) in the pinch region, and analysed the solution (3.50) in the transitional layer. Finally, the matching conditions (3.16), (3.37) and (3.52)–(3.53) fix all the parameters of the problem in terms of
 $a$
and
 $j_{0}$
. Since
 $j_{0}$
can be normalized to any value by choosing the origin of the time axis, the thinning rate
 $a$
is really the only unknown parameter. We have checked numerically that
 $a$
indeed depends on the fine details of the initial data and, therefore, can only be inferred from a more refined analysis.
(a) Dimensionless groups and macroscopic properties of three numerical simulations; initial data for all simulations are as in figure 2, with
 $M=\unicode[STIX]{x03C0}$
and
 $Q=-0.2\unicode[STIX]{x03C0}$
. (b) Rupture parameters as calculated from the analytical formulae derived for them. The temperature jump condition (3.37) and the formula for the position of the pinch point (3.11) are satisfied to within an accuracy of
 $5\times 10^{-3}$
.

Table 1 shows the dependence of rupture parameters upon variation of the dimensionless groups of the problem; the initial data are held fixed. The parameter
 $a$
, and thus the pinch position
 $x_{0}$
, varies considerably. In turn, table 2 shows the dependence of parameters upon variation of initial data while keeping dimensionless groups fixed. In both tables the thinning rate
 $a$
was determined numerically from the asymptotic value of the quantity
 $$\begin{eqnarray}\frac{\bar{u}^{2}}{4O}-\frac{\bar{u}^{\prime \prime }\bar{u}}{\bar{u}^{\prime }}+\bar{u}^{\prime },\end{eqnarray}$$
as suggested by (3.6). The parameter
 $\unicode[STIX]{x1D70F}_{0}$
was fixed (similar to figure 4) so that
 $h_{f}(0)=1$
, which fixes
 $j_{0}=4O\sqrt{a}$
. The constant
 $C_{+}$
was calculated by two alternative methods: using (3.52) with the contact angle
 $s$
defined by (3.16), or from (3.32). Here the maximum velocity
 $U_{max}$
in the pinch region was determined from
 $u(x,t)$
, rescaled according to (3.17).
(a) Initial data and macroscopic properties of three numerical simulations, with dimensionless groups fixed at
 $O=1/4,~{\mathcal{D}}=1/4,~{\mathcal{M}}=10$
. The initial data have the same values
 $M=\unicode[STIX]{x03C0}$
and
 $Q=-0.2\unicode[STIX]{x03C0}$
. (b) Rupture parameters as calculated. Both (3.37) and (3.11) are satisfied to within an accuracy of
 $5\times 10^{-3}$
.

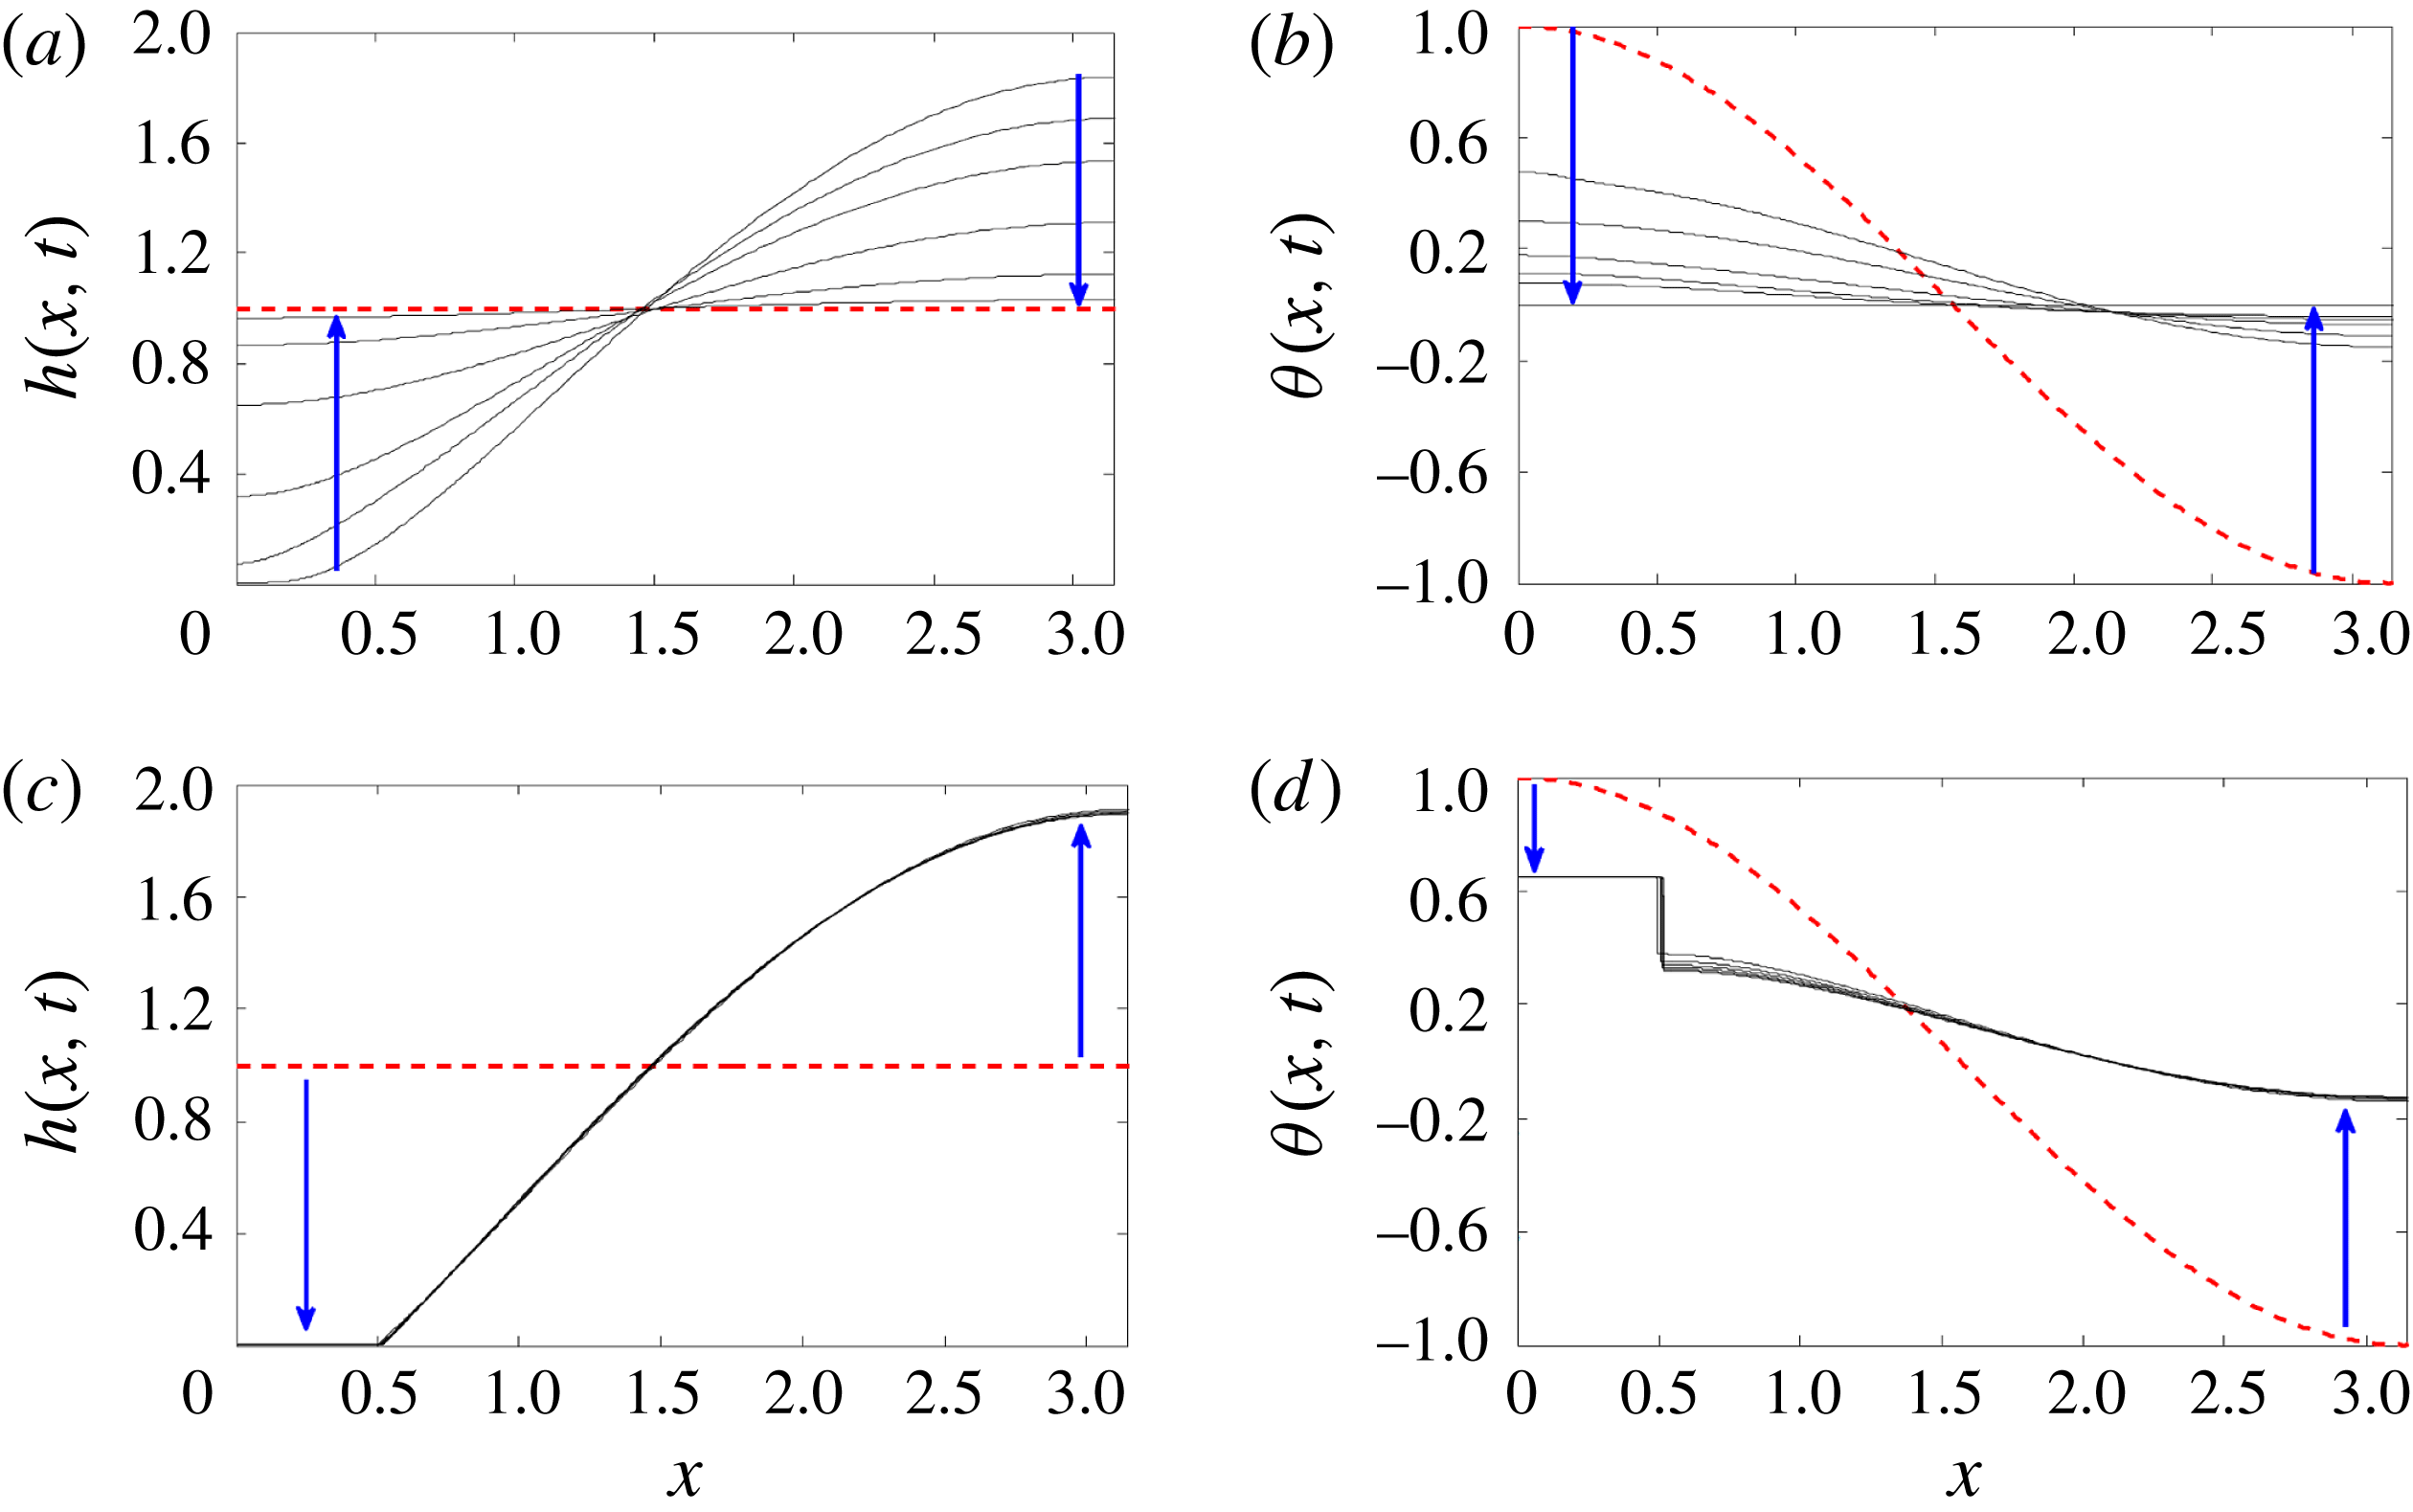
Plots of the height (a,c) and temperature (b,d) for
 ${\mathcal{M}}=1.75>{\mathcal{M}}_{cr}$
(rupture, a,b) and
 ${\mathcal{M}}=1.55<{\mathcal{M}}_{cr}$
(no rupture, c,d). The initial data for both simulations are given by
 $h(x,0)\equiv 1,~u(x,0)\equiv 0$
and
 $\unicode[STIX]{x1D703}(x,0)=\cos (x)$
. The other dimensionless groups are fixed at
 $O=1/4$
and
 ${\mathcal{D}}=1/4$
The initial conditions for the height and temperature profiles are shown as the dashed curves. The direction of motion of these profiles is shown by arrows.

Since in our simulations breakup is driven by temperature gradients, it is to be expected that there exists a critical value of the
 ${\mathcal{M}}$
parameter above which breakup occurs, while there is no breakup below this critical value, as found already by Bowen & Tilley (Reference Bowen and Tilley2013). We tested this idea using constant initial conditions
 $h(x,0)\equiv 1$
and
 $u(x,0)\equiv 0$
for the height and velocity profiles, respectively; the initial temperature profile is
 $\unicode[STIX]{x1D703}(x,0)=\cos (x)$
. Figure 10 confirms that, for
 ${\mathcal{M}}$
smaller than a critical value
 ${\mathcal{M}}_{cr}$
, no breakup occurs, and instead both height and temperature relax towards constant values (second row). If, on the other hand,
 ${\mathcal{M}}>{\mathcal{M}}_{cr}$
, the temperature profile develops a jump, and the height goes to zero (first row). More detailed numerical simulations indicate that for initial conditions as in figure 10, the critical value is
 ${\mathcal{M}}_{cr}\approx 0.16$
.
We find a singular limiting behaviour of solutions to occur when approaching the threshold
 ${\mathcal{M}}_{cr}$
from above. The temperature plots in figure 10(a,b) indicate that convergence towards the self-similar solution happens more slowly as
 ${\mathcal{M}}_{cr}$
is approached, especially inside of the droplet core. Moreover, the amplitude
 $\unicode[STIX]{x1D703}_{l}-\unicode[STIX]{x1D703}_{r}$
of the temperature jump and the width of the film
 $(0,x_{0})$
decrease to zero as
 ${\mathcal{M}}\rightarrow {\mathcal{M}}_{cr}+0$
. This suggests that the nature of the self-similar rupture changes at the critical threshold
 ${\mathcal{M}}_{cr}$
and the rupture, if it still occurs, should happen near the boundary
 $x=0$
of the computational domain.
Finally, in appendix A we classify all solutions to the ODE (3.6), which describes the velocity in the film region. In § 3.1 only the special solution of type
 $\text{I}$
(according to the classification of appendix A and figure 12) with
 $A=0$
was considered. However, our numerics indicate that, for suitably chosen initial conditions (with the same boundary conditions (2.3)), solutions of type I with non-zero
 $A$
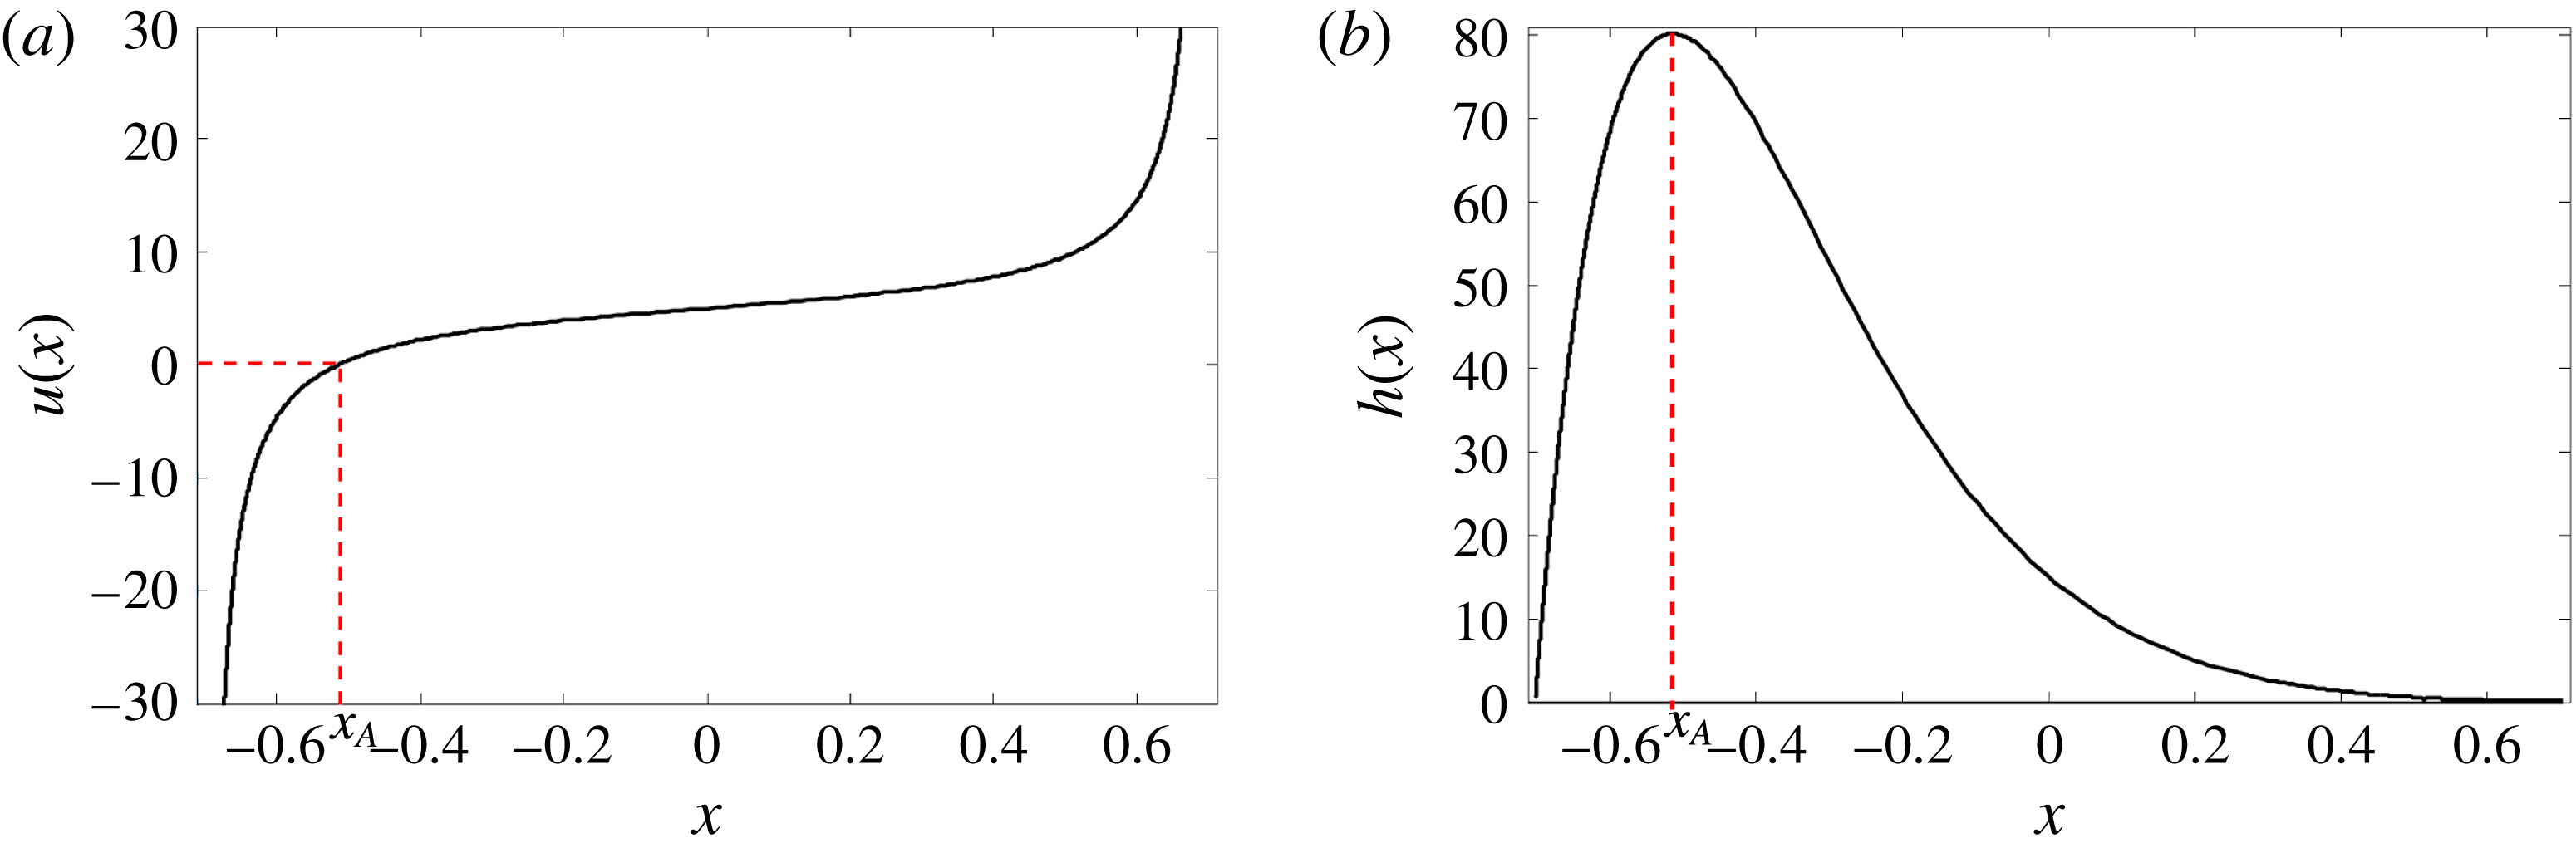
(an example of which is shown in figure 11) can be realized in the thin-film region. Namely, this happens if one evolves solutions to (2.2) from a height profile given by a semicircle, whose maximum is located at either
 $x=0$
or
 $x=\unicode[STIX]{x03C0}$
. This drop is connected to a film region given by the parts of the height profile shown in figure 11, taken in the intervals
 $x\in [-\unicode[STIX]{x03C0}/(2\sqrt{a-A^{2}}),x_{A}]$
or
 $x\in [x_{A},\unicode[STIX]{x03C0}/(2\sqrt{a-A^{2}})]$
, respectively. Here the point
 $x_{A}$
is defined uniquely by the conditions
 $$\begin{eqnarray}u(x_{A})=h^{\prime }(x_{A})=0,\end{eqnarray}$$
and is chosen to be compatible with the boundary conditions (2.3). Correspondingly, the leading-order velocity in the film region is prescribed by the corresponding parts of the type I solution to (A 1) with
 $|A|<\sqrt{a}$
.
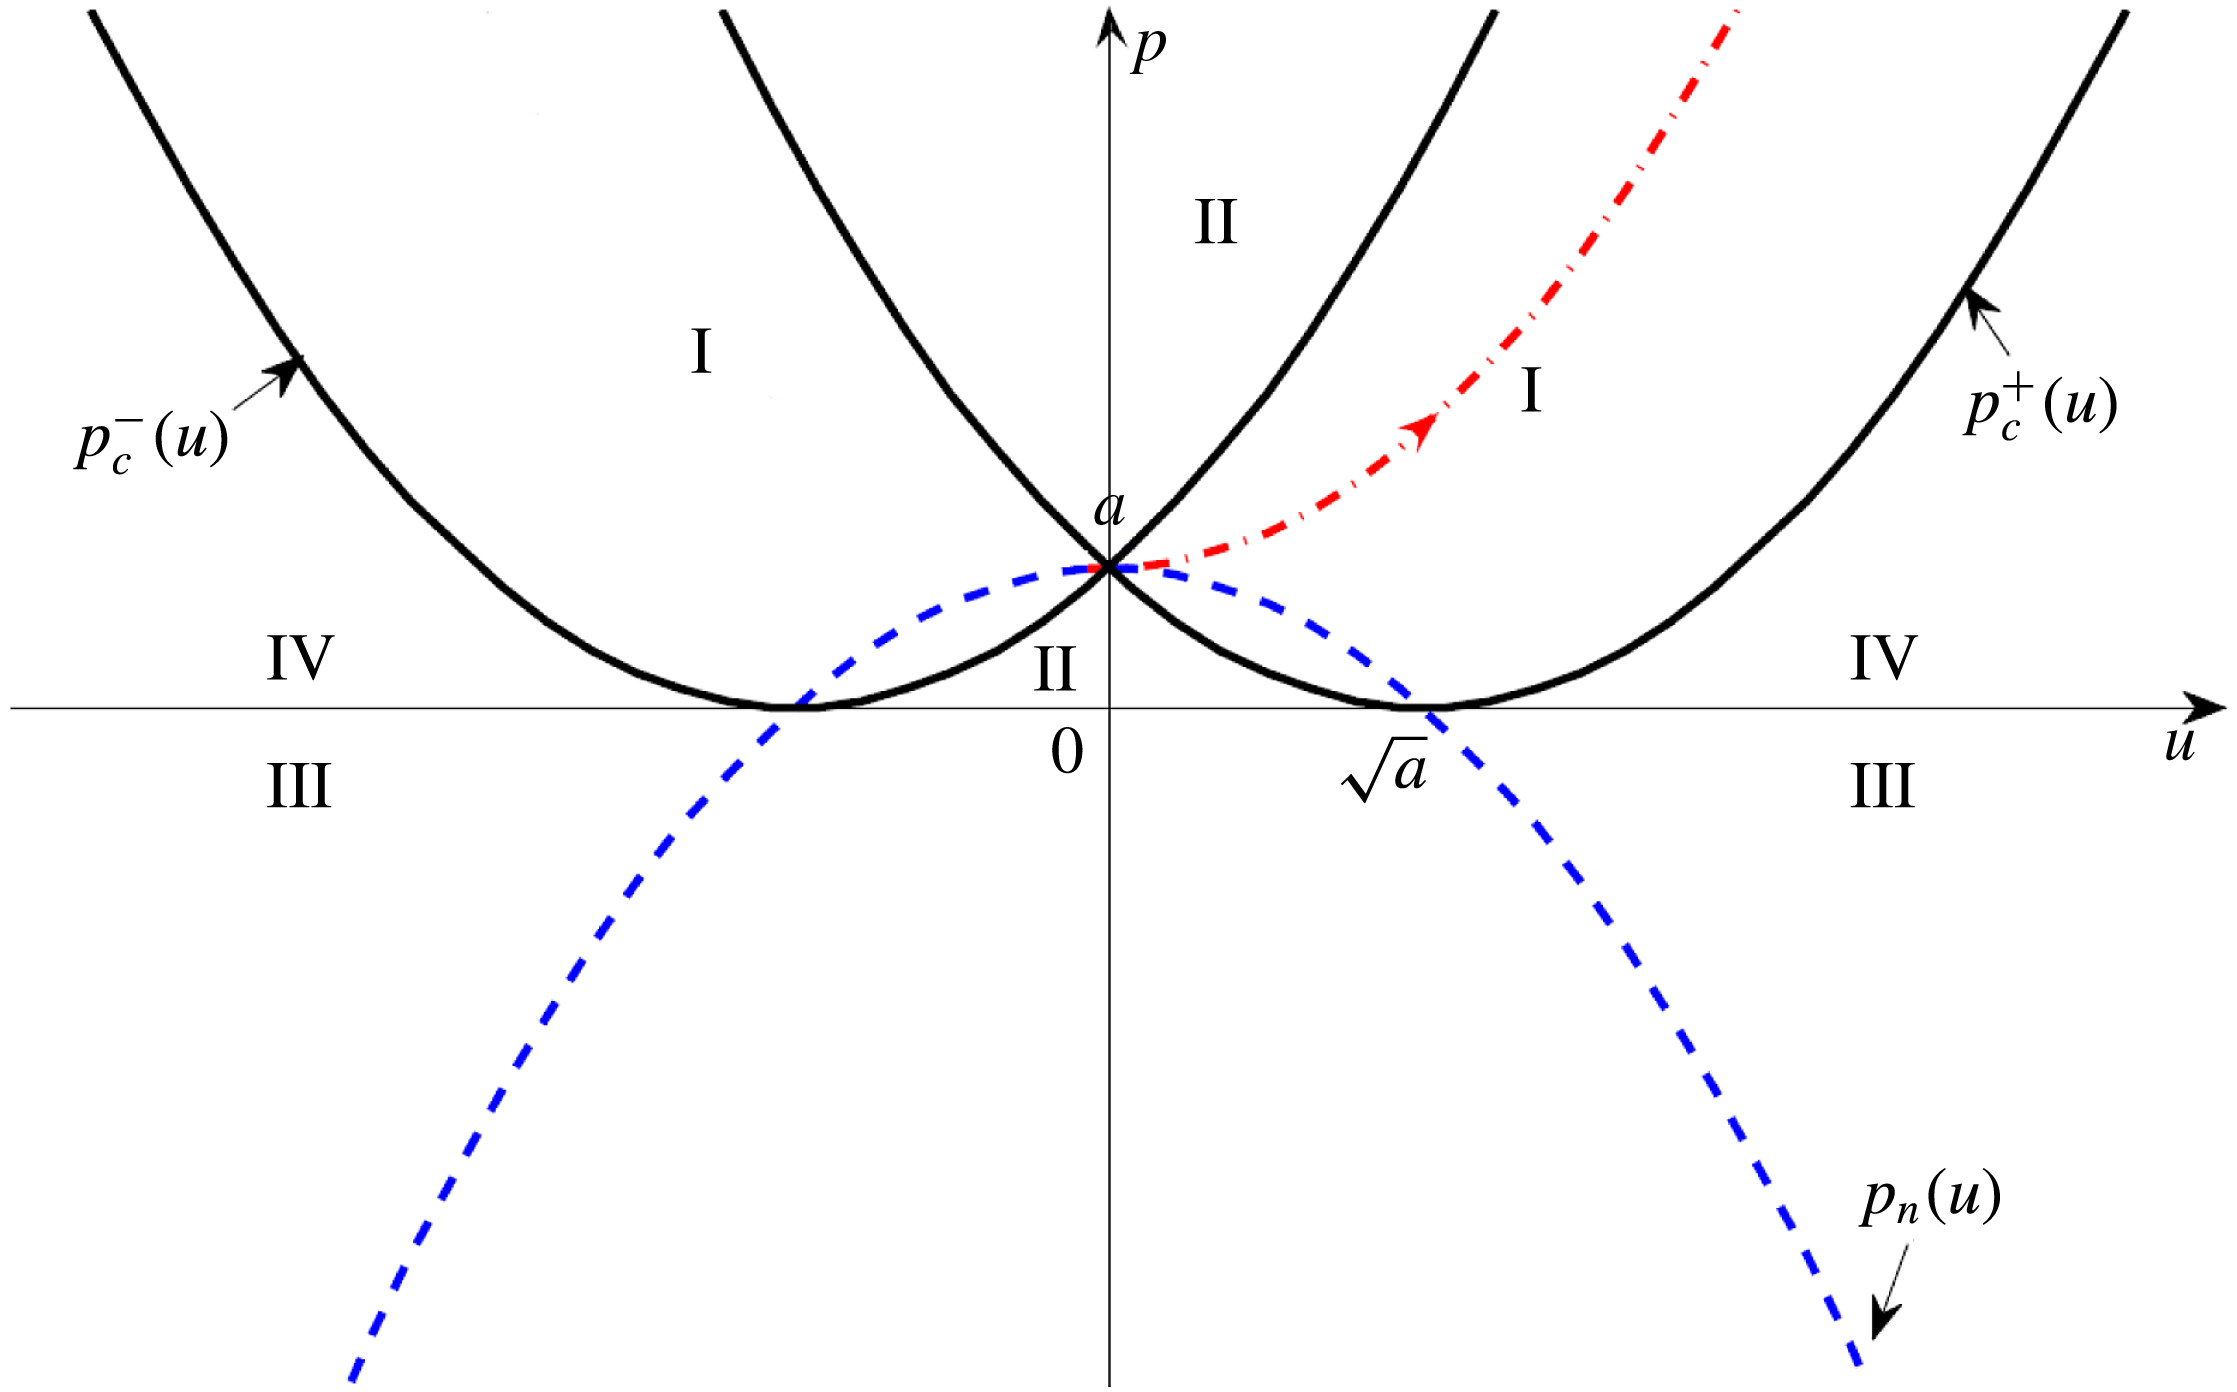
We conjecture that solution of types II–IV, represented in the phase portrait of figure 12, may also be realized in more complicated rupture scenarios, for example in the case of several pinch points separating macroscopic drops of different sizes, which interact by virtue of small fluxes through the film regions. This would be similar to systems considered recently by Clasen et al. (Reference Clasen, Eggers, Fontelos, Li and McKinley2006), Glasner et al. (Reference Glasner, Otto, Rump and Slepjev2008) and Kitavtsev (Reference Kitavtsev2014).
Velocity (a) and the corresponding height profiles (b) for the solutions to (A 1) in region I, defined in figure 12. The velocity profile was calculated using (A 8) for
 $a=30,~A=5$
. The corresponding height profiles was calculated using (3.9) for the flux
 $j_{f}=h_{f}u_{f}$
. The position of the point
 $x_{A}$
is specified uniquely by conditions (4.2), and is shown by the dashed lines.


Acknowledgements
G.K. would like to acknowledge support from Leverhulme grant RPG-2014-226. J.E. and G.K. gratefully acknowledge the hospitality of ICERM at Brown University, where part of this research was performed during their participation at the trimester program ‘Singularities and waves in incompressible fluids’. G.K. gratefully acknowledges the hospitality of ICMAT during a research visit to Madrid. M.A.F. was supported by project MTM2017-89423-P. J.E. acknowledges support from the Leverhulme Trust through International Academic Fellowship IAF-2017-010, as well as stimulating discussions with Howard Stone, Princeton.
Appendix A. Analysis of the velocity equation in the film region
Here we present the solution method and phase-plane analysis of the ODE (3.6):
 $$\begin{eqnarray}u-\frac{a}{u}=\frac{u^{\prime \prime }}{u^{\prime }}-\frac{u^{\prime }}{u},\end{eqnarray}$$
where for convenience we skipped overbars. We first reduce the order of the equation by introducing a new variable
 $p(u)=u^{\prime }(x)$
. The corresponding equation for
 $p(u)$
reads
 $$\begin{eqnarray}u-\frac{a}{u}=p^{\prime }-\frac{p}{u}.\end{eqnarray}$$
By introducing
 $\tilde{p}=p-a$
, (A 2) reduces to the ODE
 $$\begin{eqnarray}u=\tilde{p}^{\prime }-\frac{\tilde{p}}{u},\end{eqnarray}$$
which is invariant under the scaling
 $u\rightarrow Cu$
and
 $p\rightarrow C^{2}p$
. Therefore, similar to our treatment of (3.25), one can apply the substitution
 $\tilde{p}=w(u)u^{2}$
, which results in
 $$\begin{eqnarray}1=w(u)+uw^{\prime }(u).\end{eqnarray}$$
This equation can be integrated to yield
 $$\begin{eqnarray}w(u)=-\frac{2A}{u}+1.\end{eqnarray}$$
This implies that the general solution to (A 2) can be characterized completely by a one-parameter family of functions:
 $$\begin{eqnarray}p(u)=(u-A)^{2}+a-A^{2}\quad \text{with}~A\in (-\infty ,\infty ).\end{eqnarray}$$
The general solution to (A 1) can then be obtained in the form
 $$\begin{eqnarray}x-\bar{x}=\int \frac{\text{d}u}{(u-A)^{2}+a-A^{2}},\end{eqnarray}$$
which yields explicitly:
 $$\begin{eqnarray}x-\bar{x}=\left\{\begin{array}{@{}ll@{}}{\displaystyle \frac{1}{2\sqrt{A^{2}-a}}}\log \left[{\displaystyle \frac{u(x)-A-\sqrt{A^{2}-a}}{u(x)-A+\sqrt{A^{2}-a}}}\right]\quad & \text{for }|A|>\sqrt{a},\\ {\displaystyle \frac{1}{\sqrt{a-A^{2}}}}\arctan \left[{\displaystyle \frac{u(x)-A}{\sqrt{a-A^{2}}}}\right]\quad & \text{for }|A|<\sqrt{a},\\ {\displaystyle \frac{1}{A-u(x)}}\quad & \text{for }|A|=\sqrt{a}.\end{array}\right.\end{eqnarray}$$
In particular, for solutions with
 $A\in (-\sqrt{a},\sqrt{a})$
, (A 8) yields the explicit solution (3.7).
To classify all solutions by phase-plane analysis, and to find their regions of existence, it is useful to write (A 1) as the first-order system
 $$\begin{eqnarray}\displaystyle & \displaystyle \frac{\text{d}u}{\text{d}x}=p, & \displaystyle\end{eqnarray}$$
 $$\begin{eqnarray}\displaystyle & \displaystyle \frac{\text{d}p}{\text{d}x}=p\left(u-\frac{a}{u}\right)+\frac{p^{2}}{u}. & \displaystyle\end{eqnarray}$$
Firstly, owing to the invariance
 $p\rightarrow p$
and
 $u\rightarrow -u$
of (A 10), the phase-plane portrait is symmetric around the axis
 $u=0$
. Moreover, all integral curves (A 6) intersect at the singular point
 $(u=0,p=a)$
. The set of stationary points of (A 10) is given by the axis
 $p=0$
, while the nullcline
 $\text{d}p/\text{d}x=0$
is given by the parabola
 $$\begin{eqnarray}p_{n}(u)=a-u^{2}.\end{eqnarray}$$
Correspondingly, the integral curves (A 6) attain their minima at the nullcline. Moreover, the axis
 $p=0$
, together with the two parabolas
 $$\begin{eqnarray}p_{c}^{\pm }(u)=(u\pm \sqrt{a})^{2},\end{eqnarray}$$
divide the phase plane into four regions shown as I–IV in figure 12. A solution to (A 1) starting in one of the regions I–IV stays in that region for all
 $x$
.
For pinch solutions considered in this article, only those lying in region I, characterized by
 $A\in (-\sqrt{a},\sqrt{a})$
in (A 8) and having the explicit representation (3.7), are relevant. By making the shift
 $\bar{x}=0$
these solutions are defined in the finite interval
 $x\in (-\unicode[STIX]{x03C0}/(2\sqrt{a-A^{2}}),\unicode[STIX]{x03C0}/(2\sqrt{a-A^{2}}))$
. They satisfy
 $$\begin{eqnarray}u_{A}(\bar{x})=u_{A}(0)=A,\end{eqnarray}$$
and tend to infinity as
 $x\rightarrow \pm \unicode[STIX]{x03C0}/(2\sqrt{a-A^{2}})$
. These two points would correspond to pinch-off points of the full solutions to the partial differential equation system (2.2). The special solution (3.8) analysed in § 3.1 corresponds to
 $A=0$
, and is selected by the global boundary conditions (2.3) to system (2.2), consistent with (A 13).
Solutions lying in regions II–IV are parametrized by constants
 $|A|>\sqrt{a}$
. From the explicit representation (A 8) it follows that solutions in region III are defined on the whole real line
 $x\in \mathbb{R}\,$
, while solutions in regions II and IV are defined on the half-lines
 $x\in (0,\infty )$
and
 $x\in (-\infty ,0)$
, respectively. In region III solutions are bounded and approach stationary points
 $u=A\pm \sqrt{A^{2}-a}$
at an exponential rate as
 $x\rightarrow \pm \infty$
. The solutions in regions II (IV) are unbounded in the one-side limit
 $x\rightarrow 0+$
(
 $x\rightarrow 0-$
) and approach the stationary point
 $u=A-\sqrt{A^{2}-a}$
(
 $u=A+\sqrt{A^{2}-a}$
) as
 $x\rightarrow \infty$
(
 $x\rightarrow -\infty$
).