INTRODUCTION
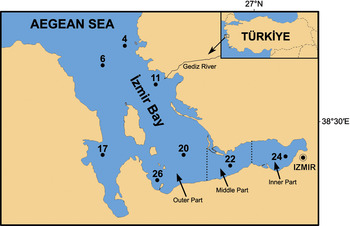
Izmir Bay has suffered from intense pollution due to untreated industrial and domestic waste discharged into the inner region of the bay from the 1970s to early 2000 (Geldiay & Kocataş, Reference Geldiay and Kocataş1979; Kocataş et al., Reference Kocataş, Ergen, Mater, Özel, Katağan, Uçal, Koray and Büyükışık1984; Ergen et al., Reference Ergen, Çinar, Dagli and Kurt2006). From the faunistic and hydrographical points of view, Kocataş (Reference Kocataş1978, Reference Kocataş1980) divided Izmir Bay into 3 regions including the inner, middle and outer parts (Figure 1). The inner part is located in the most populated region of Izmir city, close to the discharge points, which received high levels of sedimentation due to weak circulation and excessive suspended material. The middle part was considered as a transitional area (semi-polluted zone) between polluted and unpolluted sectors. The outer bay, which covers the largest region of the bay, is characterized by having many species sensitive to any kind of pollution, and is therefore regarded as relatively unpolluted. However, the Gediz River is a source of farming and industrial wastes to this part of the bay (Ergen et al., Reference Ergen, Dora and Çinar2002). Due to eutrophication, the primary production of Izmir Bay was estimated to be 6–8 times higher than that of the Aegean Sea (Balci et al., Reference Balci, Kucuksezgin, Kontas and Altay1995). After the compilation of the Grand Canal Project (GCP) in 2000, which aimed to collect, and discharge biologically treated waste to a single deep water location, a recovery in the sediment and water quality was reported. However, Kontaş et al. (Reference Kontaş, Kucuksezgin, Altay and Uluturhan2004) pointed out that although the capacity of the wastewater plant was sufficient for removal of nitrogen from waste, it was inadequate for the removal of phosphate. This finding was also confirmed by Çinar et al. (Reference Çinar, Katagan, Öztürk, Egemen, Ergen, Kocataş, Önen, Kırkım, Bakır, Kurt, Dağlı, Kaymakçi, Açik, Doğan and Özcan2006) who showed that the nitrogen concentration in 2004 was 3-fold lower than that reported prior to the opening of GCP, whereas the phosphate concentration remained fairly constant. Parallel with the increase in the sediment and water quality, soft and hard bottom faunal communities in the inner part of the Bay, where azoic conditions and an intense sulphurous odour had been previously reported (Doğan et al., 2005), became more diverse (Çinar et al., Reference Çinar, Katagan, Öztürk, Egemen, Ergen, Kocataş, Önen, Kırkım, Bakır, Kurt, Dağlı, Kaymakçi, Açik, Doğan and Özcan2006; Reference Çinar, Katagan, Koçak, Öztürk, Ergen, Kocataş, Önen, Kirkim, Bakir, Kurt, Dagli, Açik, Dogan and Özcan2008). Çinar et al. (Reference Çinar, Ergen, Dagli and Petersen2005; 2006) also reported that new invasions of ship-mediated species had increased following the disappearance of azoic conditions; many of which became a dominant component of benthic communities in the bay.
Benthic invertebrates with a variety of feeding and reproduction modes are known to act as a bridge between predators inhabiting benthic and pelagic ecosystems (Wilson, Reference Wilson1991). They constitute food for demersal fish and large invertebrates. As most benthic invertebrates are sessile or sedentary, their spatio-temporal distributional patterns have been used in assessing environmental stress (natural or pollution) and their sources (Pearson & Rosenberg, Reference Pearson and Rosenberg1978). Some species of polychaetes belonging to families such as Capitellidae and Spionidae, which are r-selected (small-sized, population grows fast, reproduces quickly), are often opportunistic and can build up dense populations in polluted environments (Ergen et al., Reference Ergen, Çinar, Dagli and Kurt2006; Van Hoey et al., Reference Van Hoey, Borja, Birchenough, Buhl-Mortensen, Degraer, Fleischer, Kerckhof, Magni, Muxika, Reis, Schröder and Zettler2010). These species have been used as indicators of organically polluted waters worldwide (Pearson & Rosenberg, Reference Pearson and Rosenberg1978; Pocklington & Wells, Reference Pocklington and Wells1992). The ecological quality of an area has also been assessed by using indices based on the presence/absence of benthic invertebrates, and their abundance or biomass.
After the statement of the European Union Water Framework Directive (EU WFD) that all inland and coastal waters must achieve ‘good ecological quality status’ by 2015, a number of different classification methods have been developed and used to assess the ecological status of benthic environments. The best-known index for defining benthic quality status is the Shannon–Weiner diversity index (H′) that is still being widely used for pollution monitoring studies in benthic and pelagic environments. Recently, some biotic indices such as BENTIX (Simboura & Zenetos, Reference Simboura and Zenetos2002), AMBI (Borja et al., Reference Borja, Franco and Pérez2000) and m-AMBI (Borja et al., Reference Borja, Dauer, Díaz, Llansó, Muxika, Rodríquez and Schaffner2008) were evaluated and have been used in the European coastal waters. These indices, except for H′, are mainly based on the classification of species according to their sensitivity to pollution. However, the use of these biotic indices requires a deep knowledge about the life history pattern of each species within benthic communities, but the existing bio-ecological data for the Mediterranean invertebrates are scarce and the taxonomic positions of some so-called cosmopolitan species (i.e. Chaetozone setosa) have still not been clarified in the area (Çinar & Ergen, Reference Çinar and Ergen2007).
The aims of this study were to: (1) determine the species composition, abundance and distribution of the zoobentos in Izmir Bay in order to characterize species assemblages; (2) address the main environmental factors affecting the distribution of the species; (3) assess the contribution of alien species to benthic community structure; and (4) evaluate the ecological quality status of the bay using different biotic indices.
MATERIALS AND METHODS
Sampling
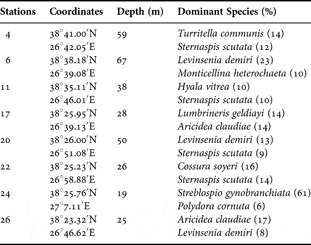
Field sampling for the present study was conducted at 8 stations in Izmir Bay including one station in the polluted inner part of the bay (Station 24), another in the middle part (Station 22), and 6 stations (Stations 4, 6, 11, 17, 20 and 26) in the outer part (Figure 1; Table 1). Samples were collected using a van Veen grab (sampling an area of 0.1 m−2) during four months (February, April, July and November) in 2009 by RV ‘K. Piri Reis’. At each station, three replicates were taken for benthic community analysis and one additional sample for the granulometric and chemical analysis of sediment. Due to bad weather conditions, samples at Station 4 in the summer could not be taken. Benthic samples were sieved with a 0.5-mm mesh on-board the RV ‘K. Piri Reis’, and the retained fauna were transferred to jars containing 10% seawater–formalin solution. Bottom-water samples were also taken with a CTD bottle at each grab station during the sampling period. Temperature, salinity and dissolved oxygen concentration were determined in the field.
Map of the investigated area with the location of sampling sites.

Coordinates, depth and dominant species of each station.

Laboratory procedures
Water samples for analysing nitrite, nitrate, ammonia, phosphate phosphorus and silicate were pre-filtered, frozen and immediately transferred to the laboratory. Nutrients and chlorophyll-a were analysed using spectrophotometer (Parsons et al., Reference Parsons, Matia and Lalli1984). The percentage of carbon in each sediment sample was estimated according to the modified Walkley–Black titration method (Gaudette et al., Reference Gaudette, Flight, Toner and Folger1974). Granulometric analyses were conducted according to Erguvanli (Reference Erguvanli1995). Three particle size fractions were determined including sand (2 mm–0.063 mm), silt (0.063 mm–0.002 mm) and clay (<0.002 mm). The physical–chemical properties of the stations will be presented in detail by Kucuksezgin et al. (in preparation).
Benthic samples were sorted according to major taxonomic groups under a stereomicroscope and preserved in 70% ethanol. Specimens were then identified, counted, and the total wet weight of each systematic group was estimated using a balance of 0.0001 sensitivity. Specimens identified were deposited at the Museum of Faculty of Fisheries, Ege University (ESFM).
Data analysis
The number of species (S), the number of individuals (N), Shannon–Wiener diversity index (log2 base) (H′), Bentix, AMBI, m-AMBI, Pielou's evenness index (J′) and total biomass (wet weight) (B) were calculated for each sample (N = 93). Temporal variation in species composition and abundance at each station was analysed using one-way analysis of variance. Prior to the analysis, data were tested for normality by the Kolmogorov–Smirnov test, whereas homogeneity of variance was tested with Cohran's C test. Pearson correlation analysis was used to determine the correlation between the community and environmental parameters. Canonical correlation analysis (CCA), a canonical extension of principal component analysis (Teer Braak & Smilauer, Reference Teer Braak and Smilauer2002), was performed to analyse the relationship between the zoobenthic assemblages and environmental factors. Prior to the analysis, the raw data (number of individuals) were transformed using the log transformation [y = log(x + 1)]. Monte Carlo permutations were used to test the significance of the ordination axes.
Distance-based permutational multivariate analysis of variance (PERMANOVA: Anderson et al., Reference Anderson, Gorley and Clarke2008) was used to test two null hypotheses of no differences among the zoobenthic assemblages: (i) between the stations; and (ii) among four sampling seasons. The experimental design has two factors: stations (with seven levels) and season (with four levels and crossed with stations). All factors were random. For each pseudo-F test, post-hoc tests for significant effects (pair wise) were also estimated. Prior to analysis, the data were subjected to the log (x + 1) transformation.
The ecological quality status (EcoQ) at each station was determined using different biotic indices such as diversity index (H′) (Shannon & Weaver, Reference Shannon and Weaver1949; Labrune et al., Reference Labrune, Amouroux, Sardá, Dutrieux, Thorin, Rosenberg and Gremare2006), BENTIX (Simboura & Zenetos, Reference Simboura and Zenetos2002), AMBI (Borja et al., Reference Borja, Franco and Pérez2000) and m-AMBI (Muxika et al., Reference Muxika, Borja and Bald2007; Borja et al., Reference Borja, Dauer, Díaz, Llansó, Muxika, Rodríquez and Schaffner2008). Based on their sensivity to an increasing stress gradient, each species was classified into two (tolerant or sensitive for BENTIX) or five categories (AMBI and m-AMBI) (Simboura & Argyrou, Reference Simboura and Argyrou2010; Borja et al., Reference Borja, Franco and Pérez2000; Muxika et al., Reference Muxika, Borja and Bald2007). EcoQ of an area can be classified as ‘high’, ‘good’, ‘moderate’, ‘poor’ and ‘bad’ based on the results of these indices. The ecological quality ratio (EQR) or range of values for each index are presented in Table 2. For AMBI and m-AMBI calculations, the software at http://www.azti.es was used. For BENTIX calculation, the software at http://www.hcmr.gr/listview3.php?id=1195 was used. Diversity index value (H′) of each sample was calculated using the package PRIMER 6. All statistical analyses were performed by using PRIMER 6 & PERMANOVA + , STATISTICA 7.0 and CANOCO 4.5.
The ecological quality ratio (EQR) value of each index in the class boundaries.

RESULTS
Distribution of zoobenthos
A total of 417 zoobenthic species and 15,640 individuals belonging to 11 systematic groups were determined in seasonal samples taken in Izmir Bay (Table 3). Some specimens were identified to genus or family levels. They were specimens that were poorly preserved or belonged to undescribed species. The taxonomic status of these species will be determined in future studies. The majority of species (91%) belonged to three groups, namely Polychaeta (210 species, 50% of total number of species), Mollusca (100 species, 24%) and Crustacea (70 species, 17%). Polychaeta represented the highest number of individuals (75% of total specimens), followed by Mollusca (13%) and Crustacea (6%). Echinodermata, Mollusca and Polychaeta comprised 47%, 35% and 15% of total biomass in the area, respectively. The density of Nemertini, Polychaeta and total fauna differed significantly among seasons (P < 0.05).
List of species collected during the study and their maximum densities (individuals.m−2) at each station. W, winter; Sp, spring; S, summer, F, autumn. Highlighted species in the list are alien species.

Based on all samples, the dominant species in soft substrates of Izmir Bay were Aricidea claudiae (8.7% of total number of specimens), Streblospio gynobranchiata (8.2%), Levinsenia demiri (7.8%), Sternaspis scutata (6.2%) and Lumbrineris geldiayi (5.2%). The percentage total abundance of dominant species varied among seasons. For example, Levinsenia demiri (8.1%), S. scutata (6.5%) and L. geldiayi (6.1%) were more dominant in the winter; A. claudiae (10.6%), L. demiri (6.6%) and L. geldiayi (6.4%) in the spring; L. demiri (10.6%), S. scutata (8.5%) and Cossura soyeri (8%) in the summer; and S. gynobranchiata (21.7%), A. claudiae (10.4%) and L. demiri (6.1%) in the autumn. A different assortment of species also dominated communities in the outer, middle and inner parts of the bay (see Table 1). Streblospio gynobranchiata (61%) and Polydora cornuta (6.3%) were most dominant in the polluted inner bay (Station 24); Cossura soyeri (16.2%) and S. scutata (14.2%) dominated the middle part (Station 22); and Hyala vitrea (10.5%) and S. scutata (9.9%) were especially abundant at Station 11 located near the mouth of Gediz River. Among the dominant species, L. demiri formed dense populations at Stations 20 (610 ind.m−2, summer), 6 (570 ind.m−2, summer) and 17 (450 ind.m−2, autumn); S. scutata at Stations 20 (400 ind.m−2, winter), 4 (270 ind.m−2, spring) and 22 (930 ind.m−2, summer); A. claudiae at Stations 17 (840 ind.m−2, spring) and 26 (680 ind.m−2, spring); S. gynobranchiata at Station 24 (4710 ind.m−2, autumn); Lumbrineris geldiayi at Station 17 (740 ind.m−2, spring); and C. soyeri at Station 22 (820 ind.m−2, summer) (Table 3).
The most common species were Lumbrineris nonatoi (present in 71% of samples), A. claudiae (71%), L. demiri (71%), S. scutata (71%) and T. communis (71%) in winter samples; L. demiri (88%), Monticellina heterochaeta (83%), Prionospio fallax (83%) and A. claudiae (83%) in spring samples; A. claudiae (88%), Lumbrineris geldiayi (88%) and L. demiri (83%) in summer samples; and L. demiri (86%), Prionospio steenstrupi (81%) and A. claudiae (81%) in autumn samples.
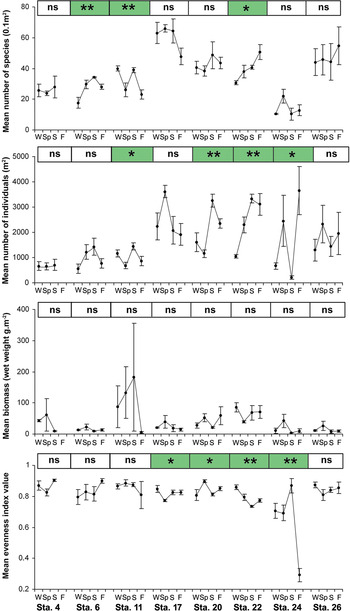
Among samples, the number of species per grab (0.1 m−2) ranged from 3 (Station 24, summer) to 77 (Station 17, summer); the density from 60 ind.m−2 (Station 24, summer) to 5360 ind.m−2 (Station 24, autumn); and biomass from 1 g.m−2 (Station 24, winter) to 530 g.m−2 (Station 11, summer). Stations 11 and 24 had the highest and lowest mean number of species in all seasons, respectively (Figure 2). Seasonality was significant at three stations (6, 11 and 22) (P < 0.05). Stations in the outer bay (in particular Stations 4 and 6) had the lowest mean densities of zoobenthos that were similar among seasons. Relatively high fluctuations in density were noted among samples collected from Stations 24 and 26 (high standard errors), and the seasonality played an important role at Stations 20 and 22 (P < 0.01) (Figure 2). Station 11, located near the mouth of Gediz River, had the highest mean biomass, due to the presence of large individuals of Brissopsis lyrifera, Goneplax rhomboides and Lapidoplax digitata. Mean biomass values were lower than 100 g.m−2 at all stations with the exception of Station 11. Seasonal variability in biomass was not significant among stations (P > 0.05), however, biomass generally reached a maxima in the spring. Mean evenness values were higher than 0.7 at all stations with the exception of Station 24, and significant seasonal variations occurred at Stations 17, 20, 22 and 24. Due to the high population of Streblospio gynobranchiata, evenness values sharply dropped to a mean of 0.29 at Station 24 in the autumn (Figure 2).
Temporal fluctuations of the mean number of species, densities (number of individuals.m−2), biomass (wet weight g.m−2) and evenness index values at stations, with ± standard error. One-way analysis of variance was used to find out if the mean scores are significant or not with regard to seasons at each station (*P < 0.05; **P < 0.01, ns, not significant). W, winter; Sp, spring; S, summer; F, autumn.

Ecological quality status (EcoQ) of stations
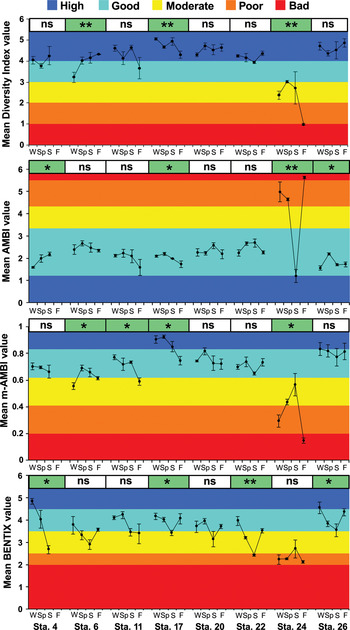
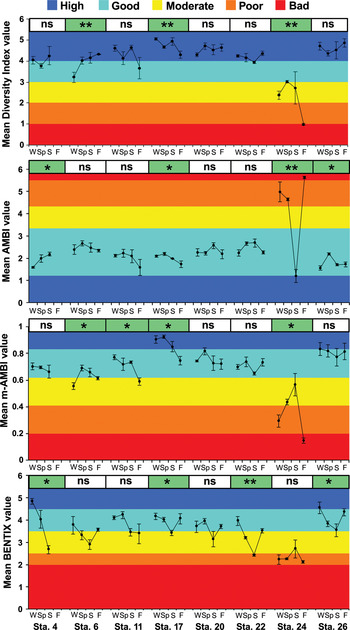
Diversity was highest (H′ = 5.2) at Stations 17 (winter and summer) and 26 (summer), and the lowest (H′ = 0.9) at Station 24. Mean diversity was always higher than 4 at Stations 17, 20 and 26, indicating ‘high’ benthic ecological status (Figure 3). In the polluted inner part of the bay, mean diversity was always lower than 3 in winter, spring and summer, and lower than 1 in autumn, indicating ‘moderate’ and ‘bad’ benthic ecological status. Seasonal variations in diversity were significant at Stations 6, 17 and 24 (P < 0.01). According to the results of AMBI, only samples taken from Station 24 in winter, spring and autumn could be classified as ‘poor’ and ‘bad’, whereas the other stations were classified as ‘good’. No ‘high’ benthic quality status was determined for the bay based on this index and AMBI values at 4 stations (4, 17, 24 and 26) significantly differed with respect to seasons (P < 0.05). M-AMBI detected ‘moderate’ benthic quality at Stations 6 (winter), 11 (autumn) and 24 (spring and summer). Only samples from Station 17 were given a ‘high’ benthic quality status. The remainder of stations (with the exception of Station 24) were classified as ‘moderately’, ‘poorly’ and ‘badly’ disturbed. According to BENTIX, only samples taken from Stations 4 and 26 in the winter contained ‘high’ benthic quality status, and Station 24 had the most impacted benthic environment (Figure 3).
Temporal fluctuations of the diversity index (H′), AMBI, m-AMBI and BENTIX at stations, with ± standard error. One-way analysis of variance was used to find out if the mean scores are significant or not with regard to seasons at each station (*P < 0.05; **P < 0.01, ns, not significant). W, winter; Sp, spring; S, summer; F, autumn.
Correlations between biotic indices and environmental variables
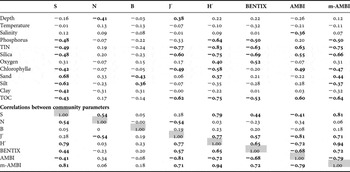
Correlations between the community parameters and environmental variables, as well as correlations among the community parameters are presented in Table 4. The concentration of nutrients (Si, P and N) and TOC were negatively correlated with the community parameters, except for AMBI, the value of which increases with increasing disturbance. The number of species and abundance decreased with depth; however, evenness values indicated that species distribution were relatively uniform. Coarse sandy sediment also favoured high species richness (number of species) and diversity (H′).
Pearson's correlation coefficients between community parameters and environmental variables as well as among community parameters. Bold numbers are statistically significant (P < 0.05).

TIN, total inorganic nitrogen; TOC, total organic carbon.
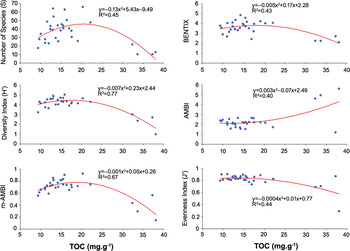
The relationship between sedimentary TOC concentration, and the number of species, H′, J′, AMBI, m-AMBI and BENTIX were found to be parabolic. These parameters increased at low concentrations of TOC in the sediment but when TOC reached 15 mg.g−1, these parameters tended to decrease with the lowest values estimated at concentrations of 30–40 mg.g−1 (Figure 4). Total organic carbon was most strongly correlated with H′ (r = –0.75) and m-AMBI (r = –0.64).
Relationships between the concentrations of total organic carbon (TOC), and S, H′, m-AMBI, BENTIX, AMBI and J′.

Among the biotic indices examined, the strongest correlation (r = 0.94) was between H′ and m-AMBI, whereas the lowest (r = 0.65) was between J′ and BENTIX. The number of species (S) was strongly correlated with H′ (r = 0.79) and m-AMBI (r = 0.81) (Table 4).
Zoobenthic community structure among seasons and stations
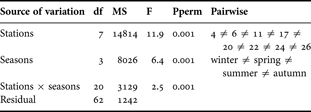
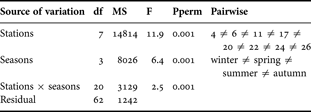
The analysis of two-way PERMANOVA indicated that there were significant differences in the distributions of zoobenthos with stations and seasons (P < 0.001) (Table 5). Pair-wise analysis showed that all comparisons among stations and seasons were significant (P < 0.001).
Results of permutational multivariate analysis of variance. Stations and seasons are fixed.
Species associations and environmental variables
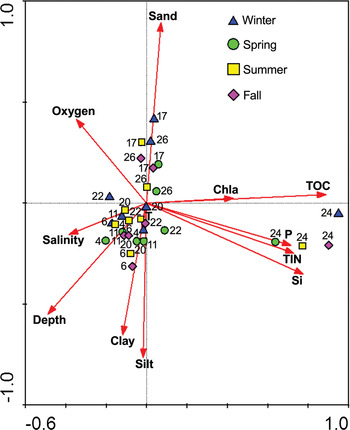
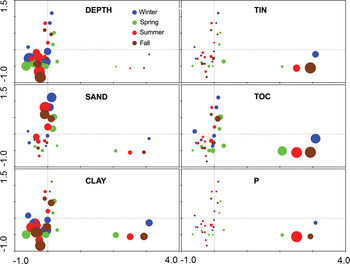
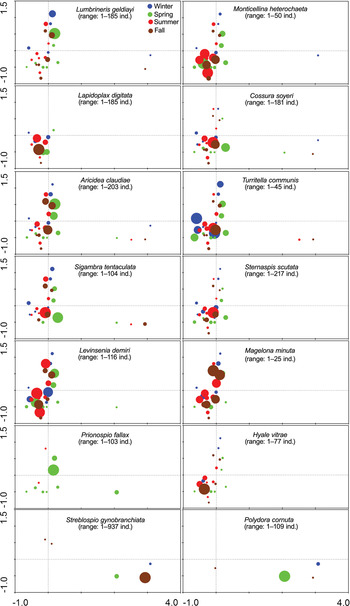
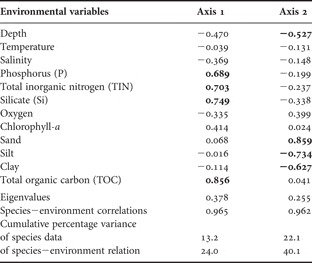
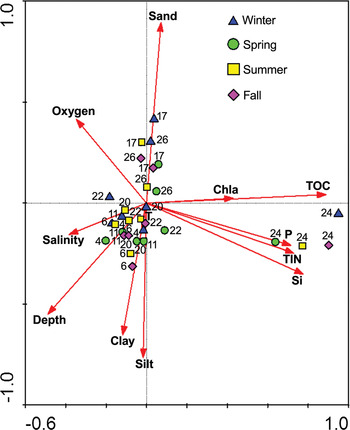
Canonical correspondence analysis detected three main groups of samples/stations (Figure 5). The first group includes seasonal samples collected at Station 24, the second group is composed of seasonal samples collected at Stations 17 and 26, and the last group contains seasonal samples of all other stations. Samples collected at Station 22 are placed in a line between the groups, suggesting that the community at this station may represent a transitional one among the main groups. These groups were influenced by environmental variables such as the concentration of nutrients and TOC, sediment texture, and depth (Figure 5). All four canonical axes together explained 63.7% of the variability, but the first two axes contributed 40.1%. The Monte Carlo test indicated that all canonical axes were statistically significant (F = 1.57, P = 0.002) (Table 6). Nutrient and TOC concentrations had the strongest correlations with the first axis, whereas sediment granulometry and depth were highly correlated with the second axis (Figure 6). Fourteen species were most important in explaining community differences among stations (Figure 7). Monticellina heterochaeta, Levinsenia demiri, Hyala vitrea, Sigambra tentaculata, Sternaspis scutata, Lapidoplax digitata, Cossura soyeri and Turritella communis generally preferred sediments composed of high amounts of silt and clay. Aricidea claudiae, Lumbrineris geldiayi, Magelona minuta and Prionospio fallax were common in sediments with a high percentage of sand. Streblospio gynobranchiata and Poydora cornuta formed dense populations in organically polluted sediment (Station 24). These species attained their maximum abundances in different seasons. For example, P. fallax, with the exception of two samples, only appeared in the spring. Hyala vitrea, S. gynobranchiata, M. minuta and L. digitata had their highest abundances in the autumn, whereas C. soyeri, S. tentaculata and M. heterochaeta were most abundant in the summer.
Biplot of canonical correspondence analysis performed on abundance of species and environmental variables (arrows) of seasonal samples. Chla, chlorophyll-a; TOC, total organic carbon in sediment; P, phosphate phosphorus; TIN, total inorganic nitrogen (nitrite, nitrate and ammonium); Si, silicate.
Biplot of canonical correspondence analysis with some important environmental variables superimposed. Circle diameters related to increasing values. For abbreviations, see Figure 5.

Biplot of canonical correspondence analysis with some dominant species superimposed. Circle diameters related to increasing abundances of species. For abbreviations, see Figure 5.

Summary of statistical measures of zoobenthos and environmental variables for canonical correspondence analysis. Strongest correlations are indicated in bold.

Alien species in Izmir Bay
A total of 13 alien species were recorded in Izmir Bay (see Table 3). Polychaeta had the highest number of species (11 species), followed by Sipuncula (1 species) and Mollusca (1 species). One species (Prionospio depauperata) is being reported for the first time in the Aegean Sea. Four species, namely, Streblospio gynobranchiata, Polydora cornuta, Prionospio pulchra and Pseudopolydora paucibranchiata abundantly occurred in the inner part of Izmir Bay, comprising almost 77% of total number of individuals. Glycinde bonhourei and Fulvia fragilis were represented by only one specimen in the area. A total of 6 alien species were found at deep-water stations (Stations 4 and 6) (Table 3). Correlation analysis showed that Aspidosiphon mexicanus (r = 0.71) and Paraprionospio coora (r = 0.44) were significantly and positively correlated with depth; G. bonhourei (r = 0.77), P. pulchra (r = 0.77), S. gynobranchiata (r = 0.77) and F. fragilis (r = 0.77) with the concentrations of total nitrogen; G. bonhourei (r = 0.50), P. cornuta (r = 0.44), P. pulchra (r = 0.51), P. depauperata (r = 0.43), P. paucibranchiata (r = 0.38), S. gynobranchiata (r = 0.61) and F. fragilis (r = 0.50) with the concentrations of total organic carbon in sediment; Chaetozone corona (r = 0.37), Notomastus aberans (r = 0.55) and Pista unibranchiata (r = 0.44) with the sand percentage in sediment; and P. coora (r = 0.46) with the clay percentage in sediment.
DISCUSSION
The present study indicates that the soft-bottom benthic communities of Izmir Bay are diverse, containing a total of 417 zoobenthic species belonging to 11 systematic groups. Soft substrates in Izmir Bay seem to support a number of microhabitats for zoobenthic species. The number of species found in the present study is higher than that encountered on the coast of Israel (401 species) at depths of 18–80 m (Tom & Galil, Reference Tom and Galil1991); in the central Mediterranean (351 species) at 10–100 m (Zenetos et al., Reference Zenetos, Christianidis, Pancucci, Simboura and Tziavos1997); in the north-east part of the Aegean Sea (139 species) at 1–30 m (Albayrak et al., Reference Albayrak, Balkis and Çinar2007); in the southern Aegean Sea (Rhodos) (382 species) at 30–250 m (Pancucci-Papadopoulou et al., Reference Pancucci-Papadopoulou, Simboura, Zenetos, Thessalou-Legaki and Nicolaidou1999); and in the western Aegean Sea (404 species) at 31–69 m. In their study performed along the coast of Crete between 40 and 190 m depths (99 stations), Karakassis & Eleftheriou (Reference Karakassis and Eleftheriou1997) reported a total of 547 zoobenthic species, 44% of which belonged to Polychaeta.
This present study also depicted that soft substrates in Izmir Bay included more diversified fauna than previously encountered in the area. Doğan et al. (Reference Doğan, Çinar, Önen, Ergen and Katağan2005) listed a total of 298 zoobenthic species collected seasonally at 15 stations in 1995. Ergen et al. (Reference Ergen, Çinar, Dagli and Kurt2006) reported a total of 396 polychaete species collected seasonally at 29 stations in Izmir Bay between 1997 and 2002, whereas we identified 210 polychaete species in the present study. The difference in the species number is attributed to the fact that Ergen et al. (Reference Ergen, Çinar, Dagli and Kurt2006) examined more materials at different stations (including a station with Posidonia oceanica) than we did in this study. Due to pollution, the inner part of Izmir Bay has been periodically monitored. Based on the material collected in 1974, Kocataş (Reference Kocataş1980) found a total of 88 species, and reported that pollution was significantly affecting communities in the inner part. Later, Palaz (Reference Palaz1989) and Doğan et al. (Reference Doğan, Çinar, Önen, Ergen and Katağan2005) encountered 23 species and 9 zoobenthic species, respectively. The fauna were only composed of the species tolerant to heavy pollution such as Capitella telata (cited as C. capitata), Ophiodromus pallidus, Malacoceros fuliginosus and Alitta succinea. Doğan et al. (Reference Doğan, Çinar, Önen, Ergen and Katağan2005) and Ergen et al. (Reference Ergen, Çinar, Dagli and Kurt2006) also reported azoic conditions, especially developing in the polluted inner part during the summer with the release of sulphurous gases. When Grand Canal Project (GCP) went into effect in 2000, the azoic conditions in the inner part of Izmir Bay appeared to disappear after 2001 (Ergen et al. Reference Ergen, Çinar, Dagli and Kurt2006). Based on the material collected in 2004, Çinar et al. (Reference Çinar, Katagan, Öztürk, Egemen, Ergen, Kocataş, Önen, Kırkım, Bakır, Kurt, Dağlı, Kaymakçi, Açik, Doğan and Özcan2006) outlined that the area had diversified (231 species) greatly, and a few species sensitive to pollution were observed. They reported that GCP has been very effective in reducing pollution in the bay. In this study, 77 species were found in the inner bay, but the winter and summer samples indicated a poor faunal component, with the presence of some pollution indicator species such as Capitella telata. However, the population density of this indicator species (C. telata) had greatly diminished since 2002. It had a maximum population density of 6820 ind.m−2 in February 2002 (Ergen et al. Reference Ergen, Çinar, Dagli and Kurt2006), 4940 ind.m−2 in April 2004 (Çinar et al. Reference Çinar, Katagan, Öztürk, Egemen, Ergen, Kocataş, Önen, Kırkım, Bakır, Kurt, Dağlı, Kaymakçi, Açik, Doğan and Özcan2006) and 300 ind.m−2 in February 2009 (present study). Apart from the previous studies (Ergen, Reference Ergen1976; Doğan et al., Reference Doğan, Çinar, Önen, Ergen and Katağan2005; Ergen et al., Reference Ergen, Çinar, Dagli and Kurt2006), Malacoceros fuliginosus, which is a dominant component of the polluted soft bottom of the Mediterranean (Bellan, Reference Bellan1984; Cardell et al., Reference Cardell, Sardá and Romero1999), was not found in the present study. The other pollution indicator species, Corbula gibba, formed relatively a dense population at Station 24 in the winter (150 ind.m−2) and spring (90 ind.m−2). Çinar et al. (Reference Çinar, Katagan, Öztürk, Egemen, Ergen, Kocataş, Önen, Kırkım, Bakır, Kurt, Dağlı, Kaymakçi, Açik, Doğan and Özcan2006) reported its population density as 15,860 ind.m−2 near Alsancak Harbour (located in the inner-most part of Izmir Bay).
The mean density of soft-bottom zoobenthos in Izmir Bay was calculated as 1680 ind.m−2. In the south Aegean Sea, the mean zoobenthic density was determined as 4250 ind.m−2 at 40 m (Karakassis & Eleftheriou, Reference Karakassis and Eleftheriou1997), which is almost four times higher than the density (mean: 1040 ind.m−2 at 38 m (Station 11)) found at the same depth in Izmir Bay. The zoobenthos density in the shallow-water of the western Mediterranean, which has almost three times higher productivity than the eastern part (Moutin & Raimbault, Reference Moutin and Raimbault2002), is much higher than that found in Izmir Bay, reaching up to 40,000–52,000 ind.m−2 (Sardá et al., Reference Sardá, Martín, Pinedo, Dueso, Cardell, Eleftheriou, Ansell and Smith1995; Pinedo et al., Reference Pinedo, Sardá and Martín1996). The zoobenthos density diminishes from the west to the east in the Mediterranean. Zenetos et al. (Reference Zenetos, Christianidis, Pancucci, Simboura and Tziavos1997) reported that the zoobenthos density on the Ionian coast of Greece (middle Mediterranean) between 10 and 104 m depths varied between 500 and 7830 ind.m−2, with the mean density of 1903 ind.m−2. In the Thermaïkos Gulf (north Aegean Sea), the density of zoobenthos ranged fom 540 to 2992 ind.m−2 (Zarkanellas & Kattoulas, Reference Zarkanellas and Kattoulas1982). However, the density greatly increased in the polluted areas of the eastern Mediterranean, reaching up to 81,700 ind.m−2 in Izmir Bay (Çinar et al., Reference Çinar, Katagan, Öztürk, Egemen, Ergen, Kocataş, Önen, Kırkım, Bakır, Kurt, Dağlı, Kaymakçi, Açik, Doğan and Özcan2006).
In most stations, seasonality significantly changed the number of species and abundance, generally having peaks in the spring and summer, decreasing in the winter. Although biomass generally attained their maxima in spring or summer, no significant difference was estimated at stations. It is known that spring is a reproductive period of many species in subtropical regions and recruitment occurs during this time or in summer, therefore an increase in species number and abundance could be expected (Sardá et al., Reference Sardá, Pinedo and Martín1999; Çinar et al., Reference Çinar, Katagan, Öztürk, Egemen, Ergen, Kocataş, Önen, Kırkım, Bakır, Kurt, Dağlı, Kaymakçi, Açik, Doğan and Özcan2006). However, the influence of seasonality seems to be stronger in polluted waters. The highest seasonal fluctuations of abundance and diversity were encountered in the polluted inner part of the Bay.
The ecological quality status (EcoQ) of the inner part of Izmir Bay can be classified as ‘poor’ or ‘bad’. No consistent trends in EcoQ status were determined for the other stations which were classified differently depending on the biotic index used. For example, no ‘high’ EcoQ existed in the area according to AMBI, whereas 75% of seasonal samples had ‘high’ EcoQ according to H′. Due to the low number of species and individuals, m-AMBI categorized only the summer samples collected at Station 24 as ‘high’ EcoQ, whereas this station is highly disturbed based on the results of other biotic indices and species composition. This shows that the interpretations of the results of biotic indices should be made with reservation, and more than one index should be used for classifying an area. The highest, negative correlation was between H′, and the TOC in sediment, and the concentrations of nutrients in ambient waters, indicating that it is well suited for the determination of pollution in sediments with relatively high amounts of silty clay. According to the present data, H′ proved efficient in detecting the effects of organic enrichment on the composition of soft-bottom fauna of Izmir Bay. M-AMBI, partly using H′ scores in the estimation, also seems to be capable of explaining the benthic quality status in the area. Our results support the applicability of H′ and m-AMBI in view of the assessment of habitats in Izmir Bay within the EU WFD. However, Albayrak et al. (Reference Albayrak, Balkis, Zenetos, Kurun and Kubanç2006) indicated that BENTIX was an appropriate tool to classify benthic environments in the Sea of Marmara. The main obstacles in the usage of the biotic indices (other than H′), which are based on the bio-ecological features of species in samples are: (1) the difficulties in identifying specimens to the species level due to the lack of updated studies on the benthic biodiversity of the Mediterranean (i.e. Polychaeta and Nemertini); and (2) the lack of bio-ecological features of all species present in benthic communities. For example, Chaetozone setosa was previously used as a pollution-indicator species in the Mediterranean (i.e. Ergen, Reference Ergen1992; Zenetos et al., Reference Zenetos, Simboura and Panayotidis1994), but we know today that this species does not exist in the Mediterranean and three or four other distinct species (may be more), some of which are pollution-sensitive species, in fact do occur in the region (Çinar & Ergen, Reference Çinar and Ergen2007). In addition, some species such as Paraprionospio coora (as P. pinnata), Prionospio ehlersi, P. banyulensis, P. caspersi, Neanthes irrorata, most species of Chaetozone, Caulleriella, Polydora and Monticellina, and all species of Polycirrus were considered as pollution-tolerant species in BENTIX and AMBI. However, according to our knowledge and the past–present studies in the region, all these species cannot be evaluated under this category. In addition, the species such as Nassarius pygmaeus, N. incrassatus and Malacoceros fuliginosus forming dense populations in organically polluted bottoms (Station 24) were considered as sensitive species in the species lists of BENTIX and AMBI. These findings show us the prerequisite to reconsider the status of these species in the indices and to develop local lists on which indices should be based.
The common and abundant species in the area were Aricidea claudiae, Levinsenia demiri and Sternaspis scutata. These detritivores formed dense populations especially in the outer bay (relatively undisturbed area) and were greatly affected by the concentration of TOC and sediment grain size (Figure 7). Sediments with high concentrations of sedimentary organic matter attracted the settlement of Streblospio gynobranchiata, Polydora cornuta, Prionospio pulchra, P. depauperata and Pseudopolydora paucibranchiata. They are new components of the Mediterranean Sea that were possibly introduced from the west Atlantic (the former two species) or Pacific Ocean (the latter three species) via ballast waters of ships (Çinar et al., Reference Çinar, Bilecenoglu, Öztürk, Katağan, Yokeş, Aysel, Dağlı, Açik, Özcan and Erdoğan2011). The replacement of the opportunistic species (C. capitata and M. fuliginosus) with these invasive species was reported in the area (Çinar et al., Reference Çinar, Ergen, Dagli and Petersen2005), and thus they could be accepted as new pollution indicator species in the eastern Mediterranean. The former two species were also reported as dominant species in the polluted soft-bottom of the Golden Horn (Sea of Marmara) (Çinar et al., Reference Çinar, Balkis, Albayrak, Dagli and Karhan2009).
Canonical correspondence analysis showed that the distribution of the zoobenthos was spatial rather than seasonal in the area. Samples/stations grouped seperately along the ordination axes and were mainly affected by the concentrations of TOC and nutrients, sediment grain size and depth. Diversity decreased with increasing TOC and nutrients. In contrast, increasing sand percentage in substratum (at Stations 17 and 26) caused a significant increase in species number and diversity index values, possibly due to providing them with more microhabitats and dimensions for settlement. In addition, organic enrichment can influence the composition of bottom sediment (Papageorgiou et al., Reference Papageorgiou, Kalantzi and Karakassis2010), by becoming a more fine-grained structure (Hyland et al, Reference Hyland, Balthis, Karakassis, Magni, Petrov, Shine, Vestergaard and Warwick2005), which may explain the higher diversity observed at Stations 17 and 26 compared to other stations with similar depth. Pancucci-Papadopoulou et al. (Reference Pancucci-Papadopoulou, Simboura, Zenetos, Thessalou-Legaki and Nicolaidou1999) also found that coarser substrata had high diversity values. However, Covazzi Harriague & Albertelli (Reference Covazzi Harriague and Albertelli2007) indicated that the increase in particle diameter of sediment negatively affected the number of species but abundance of species were more or less constant in all particle sizes, which was only related to the food quality. Ellingsen (Reference Ellingsen2002) regarded depth, median grain size and silt–clay content as the major environmental variables influencing the faunal patterns. Hoey et al. (Reference Hoey, Degraer and Vincx2004) found that fine and medium sandy sediments supported high species richness at the Belgian Continental Shelf. Station 11, which is under the influence of the Gediz River and has high silt and clay percentages in sediment, had more or less a different community from other stations, with the high abundances of Laonice spp., Hyala vitrea and Lapidoplax digitata. The community near this station was previously termed as a ‘Lapidoplax digitata-community’ (Doğan et al., Reference Doğan, Çinar, Önen, Ergen and Katağan2005). The present study showed that L. digitata also became a dominant component (maximum 240 ind.m−2) of the middle part of the bay (Station 22) where this species was previously represented by 1 or 2 specimens per grap (0.1 m−2) (Doğan et al., Reference Doğan, Çinar, Önen, Ergen and Katağan2005). CCA also detected a faunal affinity between Stations 11 and 22. The deep-water stations (Stations 4, 6 and 20) somewhat represented a high community similarity, mainly characterized by relatively high abundances of Scoletoma emandibulata mabiti, Levinsenia demiri, Paraprionospio coora and Anobothrus gracilis. However, PERMANOVA indicated that community structures at stations and seasons were significantly different. The effect of TOC in sediment on the diversity of zoobenthos is depicted in Figure 4. The general pattern is parabolic. TOC increased the diversity to a certain point but was adversely affected when it reached 15–20 mg.g−1. Hyland et al. (Reference Hyland, Balthis, Karakassis, Magni, Petrov, Shine, Vestergaard and Warwick2005) found that the species richness peaked at TOC concentrations between 2.5 and 5 mg.g−1, began declining between 5 and 10 mg.g−1, and then reached a minimum of around 35 to 40 mg.g−1. Our result is also parallel with his finding. The correlation between TOC and AMBI was moderate (r = 0.60) in this study, whereas higher correlations were reported by Muniz et al. (Reference Muniz, Venturini, Pires-Vanin, Tommasi and Borja2005) (r = 0.71) and Albayrak et al. (Reference Albayrak, Balkis, Zenetos, Kurun and Kubanç2006) (r = 0.75). At high TOC concentrations (Station 24 in this study), the percentage of detritivores or suspensivores in the community tended to increase. However, not all of the benthic community patterns observed could be solely expained by the abiotic factors examined in the present study since the biotic factors such as the availability of food, larval recruitment and predation also likely played a role in influencing the benthic community structure in the bay (Woodin, Reference Woodin1978; Ambrose, Reference Ambrose1991; Wilson, Reference Wilson1991).
The inner part of Izmir Bay with its large international harbour is known to have been invaded by ship-mediated species such as Streblospio gynobranchiata, Polydora cornuta, Pseudopolydora paucibranchiata and Prionospio pulchra (Çinar et al., Reference Çinar, Ergen, Dagli and Petersen2005; 2006; Dagli & Çinar, Reference Dagli and Çinar2008; Dagli et al., Reference Dagli, Çinar and Ergen2011). This area also contains many lessepsian species (i.e. species that had migrated from the Red Sea to the Mediterranean via the Suez Canal) such as Leonnates persicus and Pseudonereis anomala (Çinar et al., Reference Çinar, Ergen and Dağlı2002; Çinar & Ergen, Reference Çinar and Ergen2005). The present study added one species (Prionospio depauperata) to the alien species list for the Aegean Sea which was previously reported only from the Levantine coast of Turkey (Dagli & Çinar, Reference Dagli and Çinar2009). Around Alsancak Harbour (inner-most part of Izmir Bay), Çinar et al. (Reference Çinar, Katagan, Öztürk, Egemen, Ergen, Kocataş, Önen, Kırkım, Bakır, Kurt, Dağlı, Kaymakçi, Açik, Doğan and Özcan2006) and Dagli & Çinar (Reference Dagli and Çinar2008) found higher densities of S. gynobranchiata (60,480 ind.m−2), P. cornuta (3170 ind.m−2), P. paucibranchiata (6180 ind.m−2) and P. pulchra (as P. multibranchiata) (4300 ind.m−2) than those (as 4710, 730, 810 and 260 ind.m−2, respectively) we found at Station 24, relatively far from Alsancak Harbour. The majority of alien species (12 species) found in the present study belonged to Polychaeta, and two species to Mollusca and Sipuncula. In previous studies, 9 alien polychaetes, 1 mollusc (Fulvia fragilis), 4 crustaceans (Paradella dianae (Menzies, 1962), Stenothoe gallensis Walker, 1904, Hamimaera hamigera (Haswell, 1879) and Metapenaeus affinis (H. Milne Edwards, 1837)) and 1 sipunculan (Aspidosiphon mexicanus) were reported from Izmir Bay (Çinar et al., Reference Çinar, Bilecenoglu, Öztürk, Katağan, Yokeş, Aysel, Dağlı, Açik, Özcan and Erdoğan2011). The distribution of alien species in the area seems to be mainly controlled by pollution, depth and sediment structure. Çinar et al. (Reference Çinar, Katagan, Öztürk, Egemen, Ergen, Kocataş, Önen, Kırkım, Bakır, Kurt, Dağlı, Kaymakçi, Açik, Doğan and Özcan2006) also indicated the importance of TOC and nutrient concentrations on the distribution and densities of S. gynobranchiata and P. cornuta.
The present study presents the recent status of the zoobenthic communities in Izmir Bay and major factors influencing community structure. Alien species were found to be main components of benthic ecosystems in polluted waters of the bay.
ACKNOWLEDGEMENTS
We are much indebted to Dr Filiz Kucuksezgin and her collaborators (Dokuz Eylül University, Turkey) for physico-chemical analysis of water and sediment, and to two anonymous referees for their constructive comments. This work has been financially supported by TUBITAK Project (SINHA 107G066).