


Introduction
The Echinococcus granulosus sensu lato species complex comprises a group of genetically distinct cestodes responsible for cystic echinococcosis, a globally important zoonotic disease affecting both human and animal health. Based primarily on mitochondrial DNA analyses, the E. granulosus s.l. complex is currently divided into several species, including E. granulosus sensu stricto (G1/G3), E. equinus (G4), E. ortleppi (G5), E. canadensis (G6-G10), and E. felidis. Among these, E. canadensis is characterised by considerable genetic heterogeneity and a broad host range, encompassing genotypes G6/G7 (camel and pig strains), G8, and G10 (cervid strains), which circulate in diverse domestic and sylvatic transmission cycles across multiple continents (Vuitton et al., Reference Vuitton, McManus, Rogan, Romig, Gottstein, Naidich, Tuxun, Wen and da Silva2020).
Understanding the genetic structure of E. canadensis is of particular importance because its genotypes differ in host associations, geographic distribution, and epidemiological relevance. Genotypes G6/G7 are commonly associated with domestic cycles involving camels, pigs, and dogs and have been increasingly reported in human infections, whereas G8 and G10 are primarily maintained in wildlife cycles involving cervids and wild canids, particularly in the Northern Hemisphere (Carmena and Cardona, Reference Carmena and Cardona2014; Romig et al., Reference Romig, Ebi and Wassermann2015). These ecological differences suggest that both host species and geographic context may influence genetic divergence within E. canadensis, in addition to genotype-specific evolutionary histories.
Mitochondrial DNA markers have been widely used to investigate genetic diversity, population structure, and phylogeographic relationships within Echinococcus species because of their maternal inheritance, lack of recombination, and relatively high mutation rates. Among these markers, the cytochrome c oxidase subunit 1 (CO1) gene remains the most widely used for genotype identification and phylogenetic inference within the E. granulosus s.l. complex and continues to serve as a standard mitochondrial barcode in molecular epidemiological studies (Kim et al., Reference Kim, Yong, Shin, Lee, Park, Suvonkulov, Kovalenko and Yu2020; Mehmood et al., Reference Mehmood, Simsek, Celik, Kesik, Kilinc and Ahmed2020; Khan et al., Reference Khan, Ahmed, Simsek, Shahzad, Celik, Afzal, Khan, Liu, Shen and Cao2021; Anvari et al., Reference Anvari, Gholami, Spotin, Hosseini, Daryani, Sarvi, Narouei, Hosseini and Siyadatpanah2024). In contrast, NADH dehydrogenase subunit genes, including NADH1, have been less frequently used but may provide complementary information, potentially capturing finer-scale variation related to host adaptation or geographic structuring (Nakao et al., Reference Nakao, Yanagida, Konyaev, Lavikainen, Odnokurtsev, Zaikov and Ito2013; Laurimäe et al., Reference Laurimäe, Kinkar, Moks, Romig, Omer, Casulli, Umhang, Bagrade, Irshadullah, Sharbatkhori, Mirhendi, Porce-Gordo, Soriano, Varcasia, Rostami-Nejad, Andresiuk and Saarma2018).
Despite the increasing number of mitochondrial sequences available in public databases, most studies on E. canadensis have focused on restricted geographic areas, single host species, or individual genetic markers, and have relied largely on descriptive or phylogenetic approaches (Romig et al., Reference Romig, Ebi and Wassermann2015; Laurimäe et al., Reference Laurimäe, Kinkar, Moks, Romig, Omer, Casulli, Umhang, Bagrade, Irshadullah, Sharbatkhori, Mirhendi, Porce-Gordo, Soriano, Varcasia, Rostami-Nejad, Andresiuk and Saarma2018). Consequently, the relative contributions of genotype, host species, and geographic origin, as well as their potential interactions, to observed patterns of mitochondrial genetic divergence remain insufficiently quantified at a broader, comparative scale. Moreover, it remains unclear whether different mitochondrial markers reflect these factors in a similar manner or whether marker-specific sensitivities exist (Khan et al., Reference Khan, Ahmed, Simsek, Shahzad, Celik, Afzal, Khan, Liu, Shen and Cao2021; Wassermann et al., Reference Wassermann, Addy, Kokolova, Okhlopkov, Leibrock, Oberle, Oksanen and Romig2024; Biedermann et al., Reference Biedermann, Laurimäe, Anijalg, Kamenetzky, Soriano, Pierangeli, Lazzarini, Umhang, Bold, Bayasgalan, Karamon, Samorek-Pieróg, Simsek, Celik, Harandi, Nasibi, Mehmood, Chihai, Casulli and Saarma2025).
The growing availability of publicly accessible mitochondrial sequence data provides an opportunity to address these knowledge gaps through integrative, large-scale comparative analyses. By applying a unified statistical framework that simultaneously evaluates genotype, host association, and geographic origin, it becomes possible to disentangle their relative roles in shaping genetic distance patterns and to assess differences between mitochondrial gene regions (Saarma et al., Reference Saarma, Jõgisalu, Moks, Varcasia, Lavikainen, Oksanen, Simsek, Andresıuk, Denegri, Gonzalez, Ferrer, Garete, Rinaldi and Maravilla2009). In addition, the spatial organisation of genetic distance patterns has rarely been explored in a quantitative framework, despite its potential to reveal geographically localised structuring beyond conventional genotype- or host-based comparisons.
The aim of this study was to quantify the relative effects of genotype, host species, and geographic origin on mitochondrial genetic distance patterns in E. canadensis using publicly available CO1 and NADH1 sequences, and to evaluate whether these drivers and their interactions shape genetic structuring differently across the two mitochondrial markers within a spatial framework.
Materials and methods
Data collection and sequence alignment
This study was based exclusively on previously published mitochondrial DNA sequences of E. canadensis retrieved from public databases. No new biological samples were collected, and no experimental or field-based procedures were conducted as part of this work. A general search for E. canadensis was conducted in the National Center for Biotechnology Information (NCBI) database. Among the retrieved records, mitochondrial CO1 and NADH1 gene sequences longer than 400 bp were individually examined, and eligible sequences were downloaded in FASTA format. For each sequence, information on genotype, host species, and country of origin was recorded. Only sequences with clearly reported genotype designation (G6/G7, G8, or G10) and complete metadata on host species and geographic origin were included. Sequences lacking unambiguous metadata, showing incomplete gene coverage, or containing excessive ambiguous nucleotides were excluded to ensure data consistency and analytical robustness. Sequences for each gene region were aligned separately in MEGA X using the complete mitochondrial reference genome (NC_011121), followed by end trimming to obtain uniform sequence lengths. Alignments were visually inspected to confirm positional homology and minimise alignment artifacts.
Sequence alignment and genetic distance estimation
Pairwise genetic distances between each aligned sequence and the corresponding reference gene sequence were calculated in MEGA X using the Kimura two-parameter (K2P) model (Kumar et al., Reference Kumar, Stecher, Li, Knyaz and Tamura2018). Genetic distance was defined as the proportion of nucleotide differences relative to the reference sequence, with lower values indicating greater sequence similarity and higher values indicating greater mitochondrial divergence. The resulting genetic distance values were treated as continuous quantitative response variables in all subsequent statistical analyses to evaluate the effects of genotype, host species, and geographic origin on mitochondrial genetic differentiation. Because all sequences were compared with a single reference mitochondrial genome, the calculated genetic distances should be interpreted as comparative measures of sequence divergence rather than absolute evolutionary distances. Consequently, more distantly related genotypes, such as G8 and G10, may exhibit greater divergence relative to the reference sequence.
Statistical analyses
Genetic distance values were calculated based on sequences from the CO1 and NADH1 gene regions and compared according to genotype, host species, and country. For this purpose, factorial univariate analysis of variance (univariate ANOVA) was performed separately for each gene region. The model included the main effects of genotype (Genotype), host (Host), and country (Country), as well as all two-way and three-way interaction terms (Genotype × Host, Genotype × Country, Host × Country, and Genotype × Host × Country).
For statistically significant main effects and interaction terms, pairwise comparisons were performed using the Bonferroni adjustment implemented in SPSS, which automatically adjusts the p values according to the number of comparisons within each analysis. The overall significance level was set at α = 0.05. All statistical analyses were conducted using SPSS software (Version 25, IBM Corp., Armonk, NY, USA).
Factorial univariate ANOVA model

where Yijk represents the genetic distance value of the ith genotype, jth host, and kth country; μ\muμ is the overall mean; Gi denotes the main effect of genotype; Hj denotes the main effect of host; Ck denotes the main effect of country; (GH)ij represents the Genotype × Host interaction; (GC)ik represents the Genotype × Country interaction; (HC)jk represents the Host × Country interaction; (GHC)ijk represents the three-way interaction; and εijk is the residual error term.
Spatial mapping and Local Indicators Spatial Autocorrelation (LISA)
In this study, spatial analyses were conducted to evaluate the geographical distribution of genetic distance values derived from the CO1 and NADH1 gene regions of E. canadensis isolates. Country-level mean genetic distance values were mapped to identify spatial patterns and were subsequently subjected to local spatial clustering tests. Genetic distance values were grouped by country and projected onto world maps using QGIS software (version 3.44). Countries were classified according to their mean genetic distance levels, allowing a visual assessment of spatial variation for both the CO1 and NADH1 markers.
To test whether the observed geographical structure was random or clustered, Local Indicators of Spatial Association (LISA) were calculated using the GeoDa software. LISA analysis identifies local clustering structures by revealing the similarity or dissimilarity between the genetic distance value of a given country and those of its neighbouring countries (Camelo et al., Reference Camelo, Silva, Gomes, Maggi, Geiger, Barbosa and Negrão-Corrêa2025). The spatial weights matrix was constructed based on boundary-based contiguity relationships among countries, and statistical significance was assessed using 999 permutations (p ≤ 0.05). Four fundamental spatial patterns were defined in the LISA cluster maps: High-High (HH), indicating clustering of high values surrounded by high-value neighbours; Low-Low (LL), indicating clustering of low values surrounded by low-value neighbours; High-Low (HL), representing a spatial outlier with a high value surrounded by low-value neighbours; and Low-High (LH), representing a spatial outlier with a low value surrounded by high-value neighbours. This approach has been widely applied in previous spatial epidemiology studies (Li et al., Reference Li, Luo, Hao, Zhang, Yang, Li, Zhou and Li2022). To assess whether country-level genetic distance values were spatially randomly distributed, Moran’s I-based spatial autocorrelation analyses were performed. Accordingly, both the overall level of spatial dependence (Global Moran’s I) and local clustering patterns (Local Moran’s I-LISA) were calculated using the GeoDa software (Li et al., Reference Li, Luo, Hao, Zhang, Yang, Li, Zhou and Li2022).
Moran’s I statistic is expressed by the following formula:
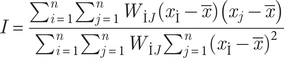
Here, n denotes the number of countries, xi represents the genetic distance of country i, x̄ indicates the overall mean, and Wij refers to the spatial weights matrix. In this context, I denotes Moran’s I spatial autocorrelation statistic, which ranges from −1 (complete spatial dispersion) to +1 (complete spatial correlation or clustering). Negative values indicate spatial dissimilarity, positive values indicate spatial clustering, and values close to zero indicate the absence of spatial dependence (Blazquez et al., Reference Blazquez, Picarte, Calderón and Losada2018). As this statistic approaches positive values, it indicates an increasing tendency towards spatial clustering of genetic distances, whereas values approaching zero suggest a random spatial distribution. A contiguity-based spatial weights matrix was selected to reflect direct geographic adjacency among countries; alternative distance-based or ecological weighting schemes were not explored due to the absence of harmonised data on host movement or transmission connectivity at a global scale.
Results
Following alignment against the reference gene sequence, a total of 329 mt-CO1 sequences were initially obtained; however, sequences containing non-overlapping or poorly aligned regions were excluded from further analyses. As a result, 252 mt-CO1 sequences with a uniform length of 613 bp were retained for the final alignment. Similarly, although 325 mt-NADH1 sequences were initially retrieved, sequences exhibiting non-matching regions were excluded, yielding a final dataset of 267 mt-NADH1 sequences aligned over 445 bp. These complete filtered datasets were used for the spatial analyses (Global Moran’s I and LISA).
Dataset composition
For the factorial ANOVA, a reduced dataset was used after excluding genotype-host-country combinations with insufficient observations for reliable statistical estimation. Consequently, 232 CO1 and 247 NADH1 isolates were included in the final statistical analyses. A total of 232 E. canadensis CO1 isolates were included in this study. The majority of the isolates belonged to the G6/G7 genotype (n = 173, 74.6%), followed by G10 (n = 41, 17.7%) and G8 (n = 18, 7.7%). The isolates were obtained from a range of host species, with the highest numbers derived from camels (n = 45, 19.4%) and dogs (n = 44, 19.0%). Geographically, the isolates originated from 20 different countries, with the largest numbers collected from Mongolia (n = 67, 28.9%) and Russia (n = 28, 12.1%). The distribution of CO1 isolates according to genotype, host species, and country is summarised in Supplementary Table 1.
Effects of genotype, host, and geography on CO1 genetic distances
A statistically significant effect of genotype on CO1 genetic distance values was detected (F = 1471.42, p < 0.001, ηp2 = 0.943). The applied factorial ANOVA model explained a substantial proportion of the variance in genetic distances, indicating a very high explanatory power (R2 = 0.988). The country factor also resulted in significant differentiation of genetic distance values (F = 3.41, p < 0.001, ηp2 = 0.267), suggesting the presence of geographic structuring within E. canadensis populations. In contrast, the effect of host species on genetic distance values was not statistically significant (p = 0.101). In addition, a significant Genotype × Country interaction was observed (F = 11.09, p < 0.001, ηp2 = 0.157), indicating that genotype-specific genetic distance levels varied across different geographic regions. Although the main effects of host species and several interaction terms were not significant in the overall model (p > 0.05), Bonferroni-adjusted pairwise comparisons suggested that differences may exist among certain host groups or genotype-host sub-combinations. However, as the corresponding global interaction tests were not statistically significant, these differences were not interpreted as representing a systematic pattern and were therefore treated with caution. Although the three-way interaction (Genotype × Host × Country) was not statistically significant in the overall model, Bonferroni-adjusted pairwise comparisons among countries within specific Genotype-Host subgroups were conducted to further explore the significant geographic component. These analyses revealed pronounced country-specific differences in certain subgroups; for example, a significant difference was detected between Russia and Mongolia in dog-derived isolates of the G10 genotype (p < 0.05). Similar country-level differences were observed in the G10-human and G10/G8-moose subgroups, as well as in the G6/G7-human and G6/G7-camel subgroups (Bonferroni-adjusted, p < 0.05). Bonferroni-adjusted pairwise comparisons revealed significant country-specific differences within selected genotype-host subgroups, which are summarised in Supplementary Table 2. Importantly, because the overall Genotype × Host × Country interaction was not statistically significant (p = 0.665), these subgroup-level Bonferroni contrasts are presented only for descriptive and exploratory purposes and should not be interpreted as evidence of systematic host-associated or country-specific structuring.
Effects of genotype, host, and geography on NADH1 genetic distances
A total of 247 E. canadensis isolates from the NADH1 gene region were analysed in this study. The vast majority of the isolates belonged to the G6/G7 genotype (n = 197, 79.8%), followed by G10 (n = 25, 10.1%) and G8 (n = 25, 10.1%). The samples were obtained from 12 different host species, with the highest numbers derived from humans (n = 66, 26.7%) and camels (n = 63, 25.5%). Pig-derived isolates also constituted a substantial proportion of the dataset, accounting for 18.6% of the total samples (n = 46). Geographically, the isolates originated from 20 different countries, with the largest numbers collected from Poland (n = 81, 32.8%) and Egypt (n = 31, 12.6%). The distribution of NADH1 isolates according to genotype, host species, and country is summarised in Supplementary Table 1.
A statistically significant effect of genotype on NADH1 genetic distance values was detected (F = 300.81, p < 0.001, ηp2 = 0.747). The applied factorial ANOVA model explained a large proportion of the variance in genetic distances, indicating a very high explanatory power (R2 = 0.986). Host species also had a significant effect on genetic distance values (F = 3.18, p = 0.001, ηp2 = 0.135). Similarly, the country factor exerted a significant influence on genetic distances (F = 2.92, p < 0.001, ηp2 = 0.214), indicating that geographic structuring is also evident in the NADH1 gene region.
A statistically significant Genotype × Country interaction was observed (F = 4.26, p = 0.040, ηp2 = 0.020), suggesting that genetic distances may vary across geographic regions in a genotype-dependent manner. In addition, a significant Host × Country interaction was detected (F = 3.35, p = 0.004, ηp2 = 0.090). In contrast, the Genotype × Host interaction was not statistically significant (p = 0.442). Due to the unbalanced distribution of samples across factor combinations in the NADH1 dataset, the Genotype × Host × Country three-way interaction could not be reliably estimated; therefore, interpretations focused on statistically supported main effects and estimable two-way interactions. Detailed Bonferroni-adjusted pairwise comparisons of NADH1 genetic distance values within genotype × host subgroups are summarised in Supplementary Table 3. These comparisons revealed country-specific differences in selected subgroups, most notably within G6/G7 lineages across several host categories and within G8 moose-derived isolates, where significant differences among countries were detected (p < 0.05). No consistent differences were observed across all genotype-host combinations, indicating that these effects were restricted to specific geographic contexts.
Comparative evaluation of factorial ANOVA results for CO1 and NADH1
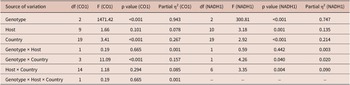
The factorial univariate ANOVA results summarised in Table 1 demonstrated that a large proportion of the variance in genetic distance values was explained for both the CO1 and NADH1 gene regions (R2 = 0.988 and 0.986, respectively). This finding indicates that genetic distances are strongly associated with genotype, host, and geographic origin. In both gene regions, the main effect of genotype was highly pronounced, with a substantially stronger effect size observed for CO1 (CO1: F = 1471.42, p < 0.001, ηp2 = 0.943; NADH1: F = 300.81, p < 0.001, ηp2 = 0.747). This result supports the conclusion that the primary differentiation in genetic distances occurs predominantly at the genotype level.
Factorial univariate ANOVA results for genetic distance values in the CO1 and NADH1 gene regions
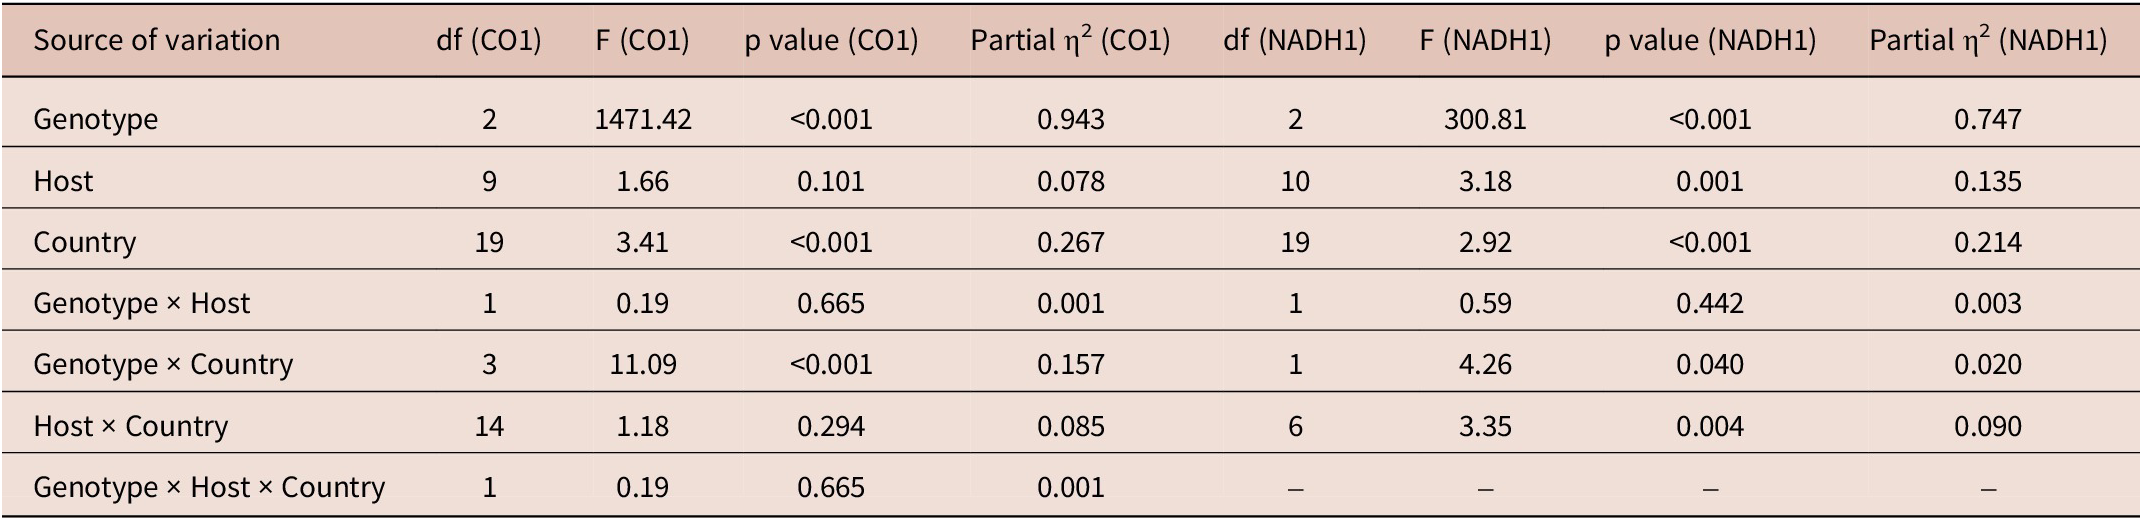
Table 1. Long description
The table contains nine columns. The first column lists the Source of variation, followed by four columns for CO1 (d f, F, p value, and Partial eta square) and four identical columns for NADH1.
* Genotype: CO1 (d f = 2, F = 1471.42, p less than 0.001, eta square = 0.943); NADH1 (d f = 2, F = 300.81, p less than 0.001, eta square = 0.747).
* Host: CO1 (d f = 9, F = 1.66, p = 0.101, eta square = 0.078); NADH1 (d f = 10, F = 3.18, p = 0.001, eta squared = 0.135).
* Country: CO1 (d f = 19, F = 3.41, p less than 0.001, eta square = 0.267); NADH1 (d f = 19, F = 2.92, p less than 0.001, eta square = 0.214).
* Genotype x Host: CO1 (d f = 1, F = 0.19, p = 0.665, eta square = 0.001); NADH1 (d f = 1, F = 0.59, p = 0.442, eta square = 0.003).
* Genotype x Country: CO1 (d f = 3, F = 11.09, p less than 0.001, eta square= 0.157); NADH1 (d f 1, F 4.26, p 0.040, eta square = 0.020).
* Host xCountry: CO1 (d f = 14, F = 1.18, p = 0.294, eta square = 0.085); NADH1 (d f = 6, F = 3.35, p = 0.004, eta square = 0.090).
* Genotype x Host x Country: CO1 (d f = 1, F = 0.19, p = 0.665, eta square = 0.001); NADH1 values are not estimated.
Note: df, degrees of freedom; η2, partial eta squared. Statistical significance was set at p < 0.05. The three-way interaction (Genotype × Host × Country) could not be estimated for the NADH1 dataset due to an unbalanced distribution of observations across factor combinations.
Geographic origin (country) was significant for both gene regions (CO1: p < 0.001, ηp2 = 0.267; NADH1: p < 0.001, ηp2 = 0.214), indicating the presence of geographic structuring within E. canadensis populations. Moreover, the Genotype × Country interaction was significant in both regions (CO1: p < 0.001; NADH1: p = 0.040), suggesting that genotype-specific genetic distance patterns vary across geographic regions.
The effect of host species differed between the two gene regions. While the main effect of host was not statistically significant for CO1 (p = 0.101), host species had a significant influence on genetic distances in the NADH1 region (F = 3.18, p = 0.001, ηp2 = 0.135). This finding suggests that the NADH1 gene may reflect host-associated variation more sensitively than CO1. Examination of interaction terms revealed that neither the Host × Country nor the Genotype × Host interactions were significant for CO1, and the three-way interaction was also not statistically supported. In contrast, the Host × Country interaction was significant in the NADH1 dataset (p = 0.004); however, due to the uneven distribution of samples across factor combinations and the presence of empty cells, the Genotype × Host × Country three-way interaction could not be reliably estimated. Consequently, interpretations for the NADH1 region focused on main effects and estimable two-way interactions.
Overall, these results indicate that genetic distance variation in both gene regions is shaped predominantly by genotype and geographic origin, while host- and geography-associated interactions appear to be more pronounced in the NADH1 gene region. A summary of the factorial univariate ANOVA results for CO1 and NADH1 genetic distance values is provided in Table 1.
Geographical distribution of genetic distances
The spatial distribution of country-level mean genetic distance values derived from the CO1 and NADH1 gene regions revealed pronounced geographical heterogeneity among E. canadensis populations. The spatial distribution of country-level mean genetic distance values revealed marked geographic heterogeneity for both mitochondrial markers (Figure 1). For CO1, higher mean genetic distance classes were predominantly observed across northern Eurasia, whereas NADH1 exhibited elevated distance classes mainly in North America and northern Eurasia. Several countries showed genetic distance values identical or very close to the reference sequence, whereas others displayed substantially greater divergence, indicating marker-specific geographic variation. For CO1, elevated mean genetic distances were predominantly observed across northern Eurasia, whereas NADH1 displayed higher distance classes in parts of North America and Eurasia, indicating marker-specific geographic patterns.
Spatial distribution of country-level mean genetic distance values relative to the reference mitochondrial genome for the CO1 and NADH1 gene regions. Countries are classified according to mean genetic distance categories, illustrating broad-scale geographic heterogeneity in mitochondrial divergence across E. canadensis populations. Higher genetic distance classes are predominantly observed in northern Eurasia and parts of North America, suggesting geographically structured patterns rather than random global variation.
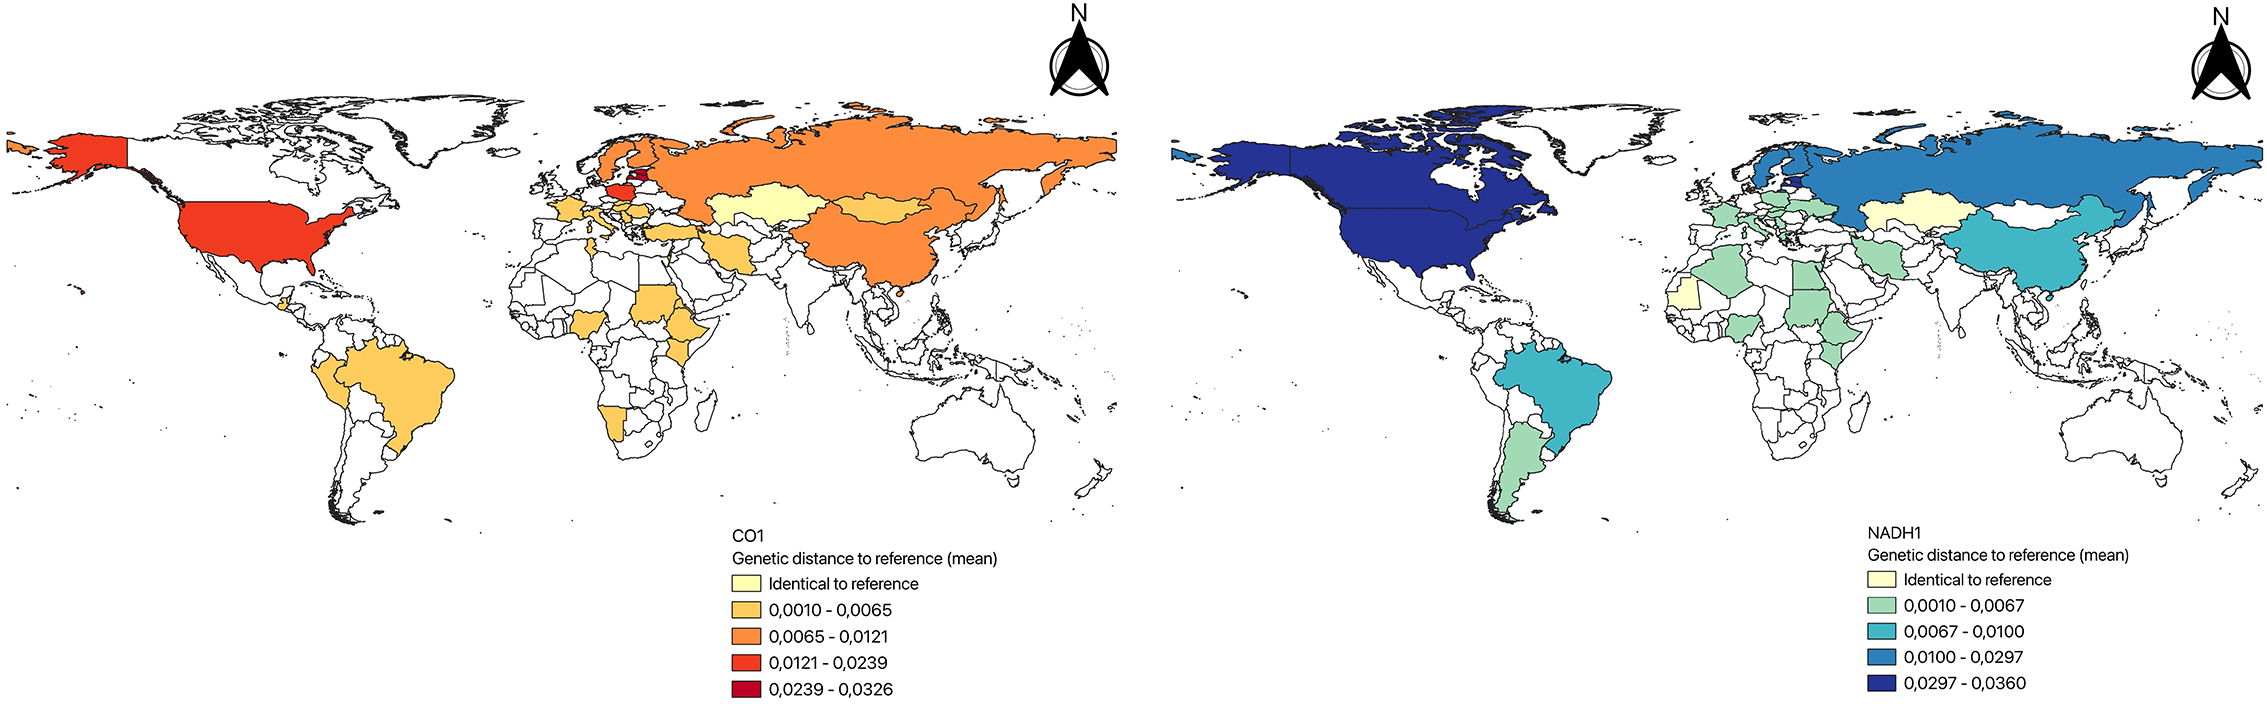
Figure 1. Long description
Two side-by-side world maps display genetic distance data.
Left Panel: CO1 gene region. The map uses a warm color scale from pale yellow to dark red. High genetic distance values (0.0121 to 0.0326) are concentrated in the North, specifically Alaska and the contiguous United States. Moderate values (0.0065 to 0.0121) are seen in Russia, China, and parts of Northern Europe. Lower values are scattered across South America, Africa, and Central Asia.
Right Panel: NAD H1 gene region. The map uses a cool color scale from pale yellow to dark blue. The highest genetic distance values (0.0297 to 0.0360) are located in North America, specifically Canada and the United States. Moderate blue shades are visible in Russia and China. Lower green and light blue values are distributed across South America, Africa, and parts of Europe.
Both maps include numerical labels within colored countries representing sample sizes or specific data points. A North arrow is positioned at the top right of each panel. Legends at the bottom right of each map define five categories of mean genetic distance, ranging from Identical to reference to the highest divergence class.
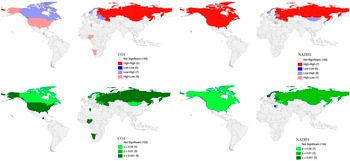
LISA analysis identified significant local spatial clustering for both mitochondrial markers (Figure 2). High-High clusters were detected for CO1 and were more extensive for NADH1, whereas High-Low and Low-High configurations represented spatial outliers. Significance maps confirmed that these clusters were confined to specific geographic regions, indicating localised hotspots of mitochondrial genetic divergence.
Local Moran’s I (LISA) cluster and significance maps for the CO1 and NADH1 gene regions based on country-level mean genetic distance values. High-High (red) clusters indicate countries with elevated genetic distances surrounded by similarly high-value neighbours, highlighting geographically localised hotspots of mitochondrial divergence. Low-High and High-Low categories represent spatial outliers deviating from surrounding regional trends, while significance maps identify clusters supported at different permutation-based probability levels.
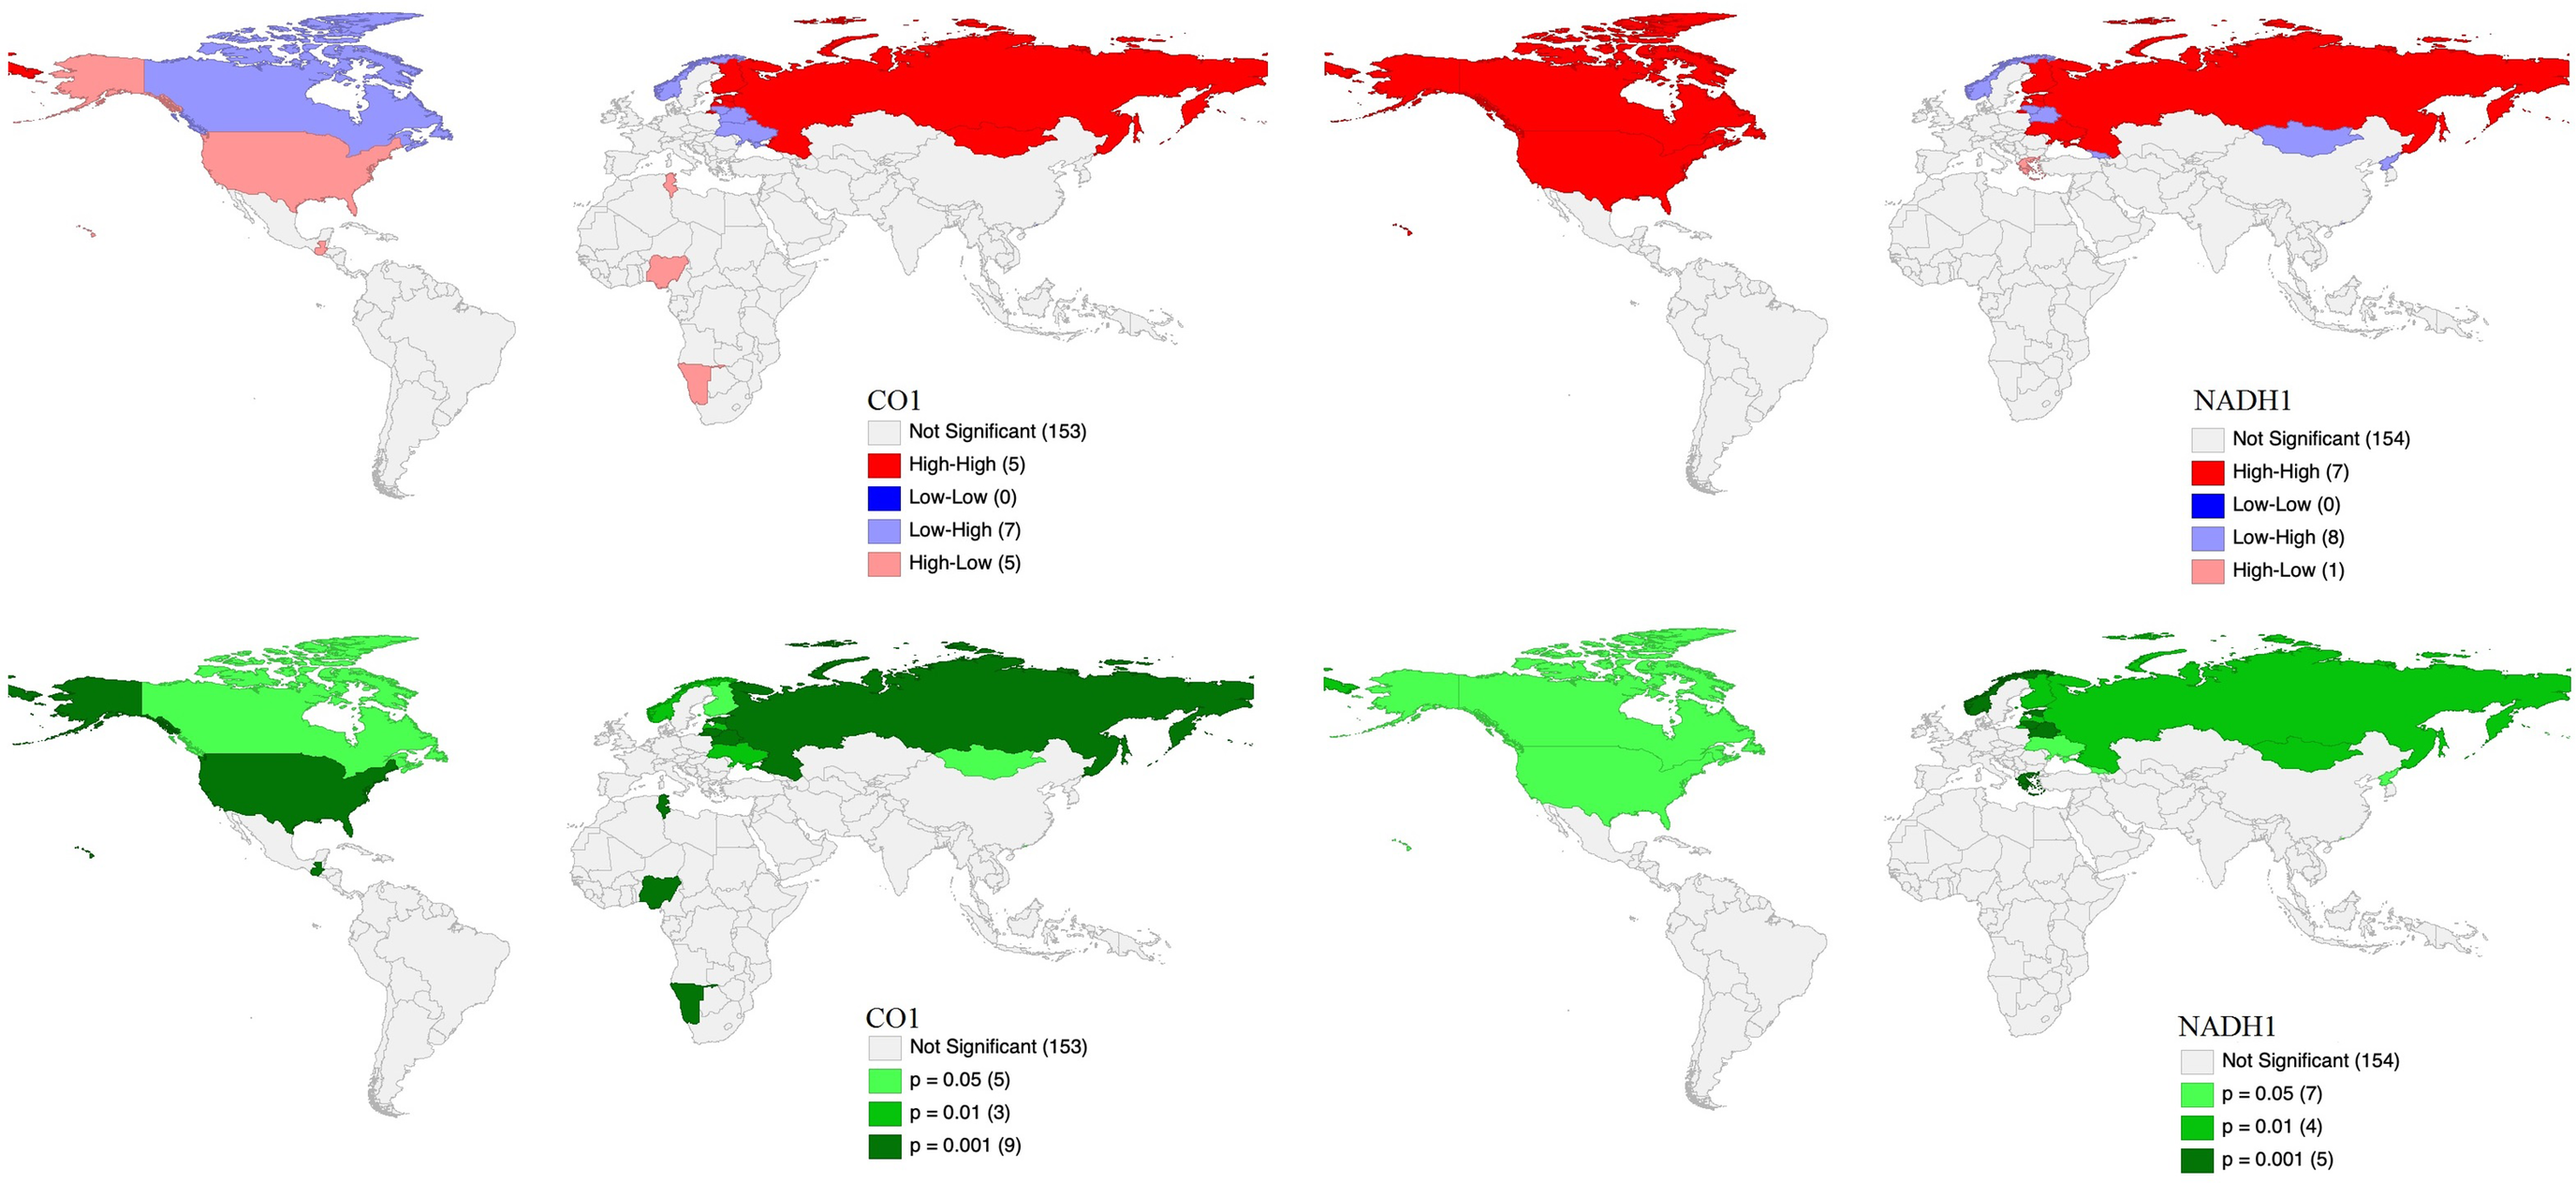
Figure 2. Long description
A multi-panel display consisting of eight world maps arranged in a two-by-four grid.
Top Row: Local Moran’s I cluster maps.
* The first two maps represent CO1. The first map shows North America with light red High-Low outliers in the United States and light blue Low-High outliers in Canada. The second map shows a large red High-High cluster across Russia and parts of Northern Europe, with scattered High-Low outliers in Africa (Nigeria and Namibia).
* The next two maps represent NADH1. The third map shows a large red High-High cluster covering all of North America. The fourth map shows a red High-High cluster across Russia, with light blue Low-High outliers in Mongolia and parts of Northern Europe.
* Legend for top row: Not Significant (grey), High-High (red), Low-Low (dark blue), Low-High (light blue), and High-Low (light red).
Bottom Row: Significance maps corresponding to the clusters above.
* The first two maps for CO1 show significance levels. The United States, Canada, Russia, and parts of Africa are shaded in varying greens. Dark green indicates p = 0.001, medium green p = 0.01, and light green p = 0.05.
* The final two maps for NADH1 show significance levels. North America is primarily light green (p = 0.05). Russia is dark green (p = 0.001), while Northern Europe and Mongolia show medium to light green significance levels.
* Legend for bottom row: Not Significant (grey), p = 0.05 (light green), p = 0.01 (medium green), and p = 0.001 (dark green).
To evaluate whether country-level genotype distance values exhibited spatial dependence, the Global Moran’s I statistic was calculated, and Moran scatterplots were generated. Global Moran’s I analysis demonstrated significant positive spatial autocorrelation for both markers (Figure 3). CO1 showed moderate spatial clustering (Moran’s I = 0.300, p = 0.005), whereas NADH1 exhibited stronger clustering (Moran’s I = 0.547, p = 0.001). The Moran scatterplots displayed positive regression slopes consistent with these findings, with the steeper slope for NADH1 indicating stronger spatial dependence.
Moran scatterplots illustrating global spatial autocorrelation of country-level mean genetic distance values for the CO1 and NADH1 gene regions. The positive slope of the regression lines indicates positive spatial autocorrelation, whereby countries with high genetic distance values tend to be surrounded by countries with similarly high values, and vice versa. The stronger slope observed for NADH1 reflects a higher degree of spatial clustering compared with CO1.
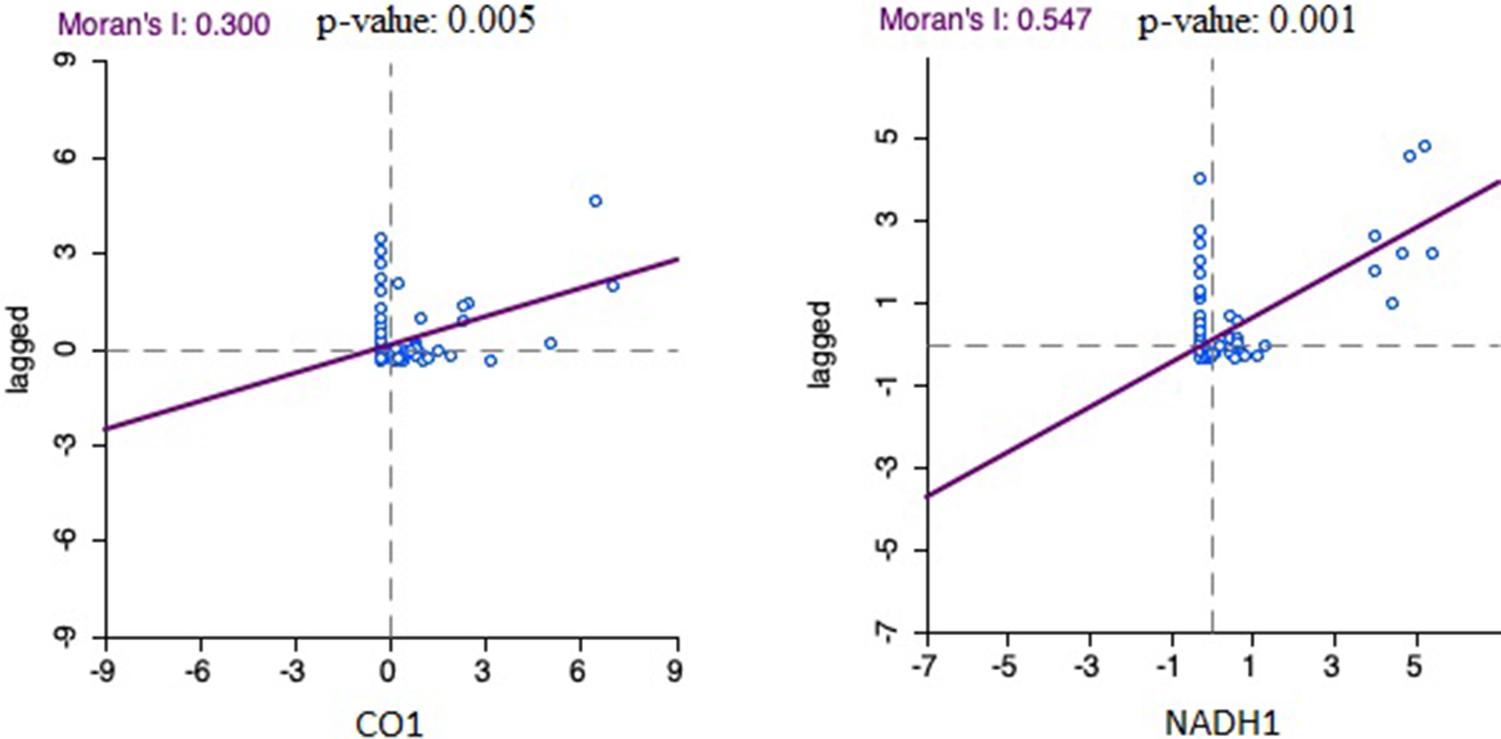
Figure 3. Long description
Two scatterplots are arranged side-by-side.
Left Panel: CO1
- Top: Moran’s I 0.300 and p-value 0.005.
- X-axis: CO1 ranging from minus 9 to 9.
- Y-axis: lagged ranging from minus 9 to 9.
- Data: A cluster of blue circular points is concentrated near the origin 0,0. A purple regression line shows a moderate positive linear slope starting from the bottom-left quadrant and extending into the top-right quadrant.
Right Panel: NADH1
- Top: Moran’s I 0.547 and p-value 0.001.
- X-axis: NADH1 ranging from minus 7 to 5.
- Y-axis: lagged ranging from minus 7 to 5.
- Data: Points are clustered at the origin with several outliers in the top-right quadrant. The purple regression line has a steeper positive slope compared to the CO1 plot, indicating stronger spatial clustering.
Discussion
This study provides a comprehensive comparative and spatial evaluation of mitochondrial genetic distance patterns in E. canadensis by jointly assessing the effects of genotype, host species, and geographic origin across two widely used mitochondrial markers, CO1 and NADH1. By integrating factorial univariate ANOVA with spatial autocorrelation analyses, our results extend previous descriptive and phylogenetic studies and offer a quantitative framework for disentangling the drivers of genetic structuring in this genetically heterogeneous parasite. In the context of this study, mitochondrial genetic distance should not be interpreted solely as a measure of overall genetic diversity, but rather as an integrative proxy reflecting the cumulative effects of historical divergence, lineage-specific evolutionary trajectories, and long-term geographic isolation. In particular, elevated genetic distance values observed in G8 and G10 lineages are consistent with their maintenance in sylvatic transmission cycles, where reduced gene flow and host-specific ecological constraints may promote deeper mitochondrial divergence compared with predominantly domestic G6/G7 cycles. The extremely high effect sizes observed for genotype, particularly for CO1, should be interpreted with caution, as genotypes within the E. granulosus s.l. complex are themselves defined based on mitochondrial divergence. Consequently, the strong explanatory power of genotype partly reflects the inherent structure of the mitochondrial data rather than independent ecological or demographic effects. Nevertheless, the persistence of significant geographic and interaction effects beyond genotype alone indicates that mitochondrial divergence in E. canadensis is further shaped by spatially structured processes.
Across both gene regions, genotype emerged as the dominant determinant of genetic distance variation, with a markedly stronger effect observed for CO1 than for NADH1. This finding is consistent with the established role of CO1 as a primary marker for genotype discrimination within the E. granulosus s.l. complex (Thompson, Reference Thompson2008). More recent mitochondrial genome studies have further confirmed the robustness of CO1 and other mitochondrial markers for resolving phylogenetic relationships and genetic diversity within the E. canadensis cluster, particularly among the G6/G7, G8, and G10 genotypes (Laurimäe et al., Reference Laurimäe, Kinkar, Moks, Bagrade and Saarma2023; Wassermann et al., Reference Wassermann, Addy, Kokolova, Okhlopkov, Leibrock, Oberle, Oksanen and Romig2024; Biedermann et al., Reference Biedermann, Laurimäe, Anijalg, Kamenetzky, Soriano, Pierangeli, Lazzarini, Umhang, Bold, Bayasgalan, Karamon, Samorek-Pieróg, Simsek, Celik, Harandi, Nasibi, Mehmood, Chihai, Casulli and Saarma2025). The very high effect size associated with genotype for CO1 supports the notion that much of the mitochondrial divergence in E. canadensis reflects deep evolutionary differentiation among genotypes G6/G7, G8, and G10, as previously suggested by mitochondrial and nuclear phylogenetic studies (Addy et al., Reference Addy, Wassermann, Kagendo, Ebi, Zeyhle, Elmahdi, Umhang, Casulli, Harandi, Aschenborn, Kern, Mackenstedt and Romig2017; Laurimäe et al., Reference Laurimäe, Kinkar, Moks, Bagrade and Saarma2023). In contrast, although genotype also significantly influenced NADH1 genetic distances, the comparatively lower effect size indicates that this marker may capture additional sources of variation beyond strict genotype boundaries.
Geographic origin was identified as a significant contributor to genetic distance variation for both mitochondrial markers, highlighting the importance of spatial processes in shaping the genetic structure of E. canadensis. The observed spatial pattern suggests that CO1-based genetic diversity exhibits regional differentiation across a broad geographic area. The significant Genotype × Country interactions observed for both CO1 and NADH1 further indicate that genotype-specific divergence patterns are not uniform across geographic regions. Comparisons involving genotype-host-country combinations represented by very small sample sizes (n ≤ 2) should be considered descriptive and interpreted cautiously, as they primarily reflect available sequence coverage rather than population-level estimates. Such geography-dependent genotype structuring is consistent with earlier reports describing regionally distinct lineages within E. canadensis, particularly in northern Eurasia and North America, where sylvatic transmission cycles involving cervids and wild canids predominate (Schurer et al., Reference Schurer, Shury, Leighton and Jenkins2013; Oksanen and Lavikainen, Reference Oksanen and Lavikainen2015; Schurer et al., Reference Schurer, Bouchard, Bryant, Revell, Chavis, Lichtenwalner and Jenkins2018; Priest et al., Reference Priest, McRuer, Stewart, Boudreau, Power, Conboy, Jenkins, Kolapo and Shutler2021). These findings suggest that historical biogeography, host migration patterns, and regional transmission dynamics jointly contribute to shaping mitochondrial diversity within genotypes.
The role of host species differed markedly between the two mitochondrial markers. While host species did not exert a significant main effect on CO1 genetic distances, a significant host effect was detected for NADH1, along with a significant Host × Country interaction. This pattern suggests that NADH1 may be more sensitive to host-associated or locally adaptive processes than CO1. Similar marker-specific differences have been reported in other helminth systems, where certain mitochondrial regions appear to capture finer-scale ecological or demographic signals, whereas others primarily reflect deeper phylogenetic divergence (Yanagida et al., Reference Yanagida, Lavikainen, Hoberg, Konyaev, Ito, Sato, Zaikov, Beckmen and Nakao2017; Wu et al., Reference Wu, Li, Zhu, Li, Zhang, Li, Yao, Tian, Fu, Yin, Zhu, Yan and Jia2018). In E. canadensis, this may reflect differences in transmission ecology between domestic and sylvatic cycles, particularly for G6/G7 lineages that circulate across a broader range of host species and geographic settings (Carmena and Cardona, Reference Carmena and Cardona2014).
An important aspect of the present study is the integration of spatial analyses with conventional statistical approaches to better characterise geographic patterns of mitochondrial genetic diversity. Both Global Moran’s I and LISA demonstrated significant positive spatial autocorrelation for CO1 and, more strongly, for NADH1. The identification of localised High-High clusters, particularly for NADH1, supports the existence of spatially structured evolutionary processes and suggests that this marker captures geographically restricted diversification more effectively than CO1. Comparable applications of spatial autocorrelation methods in parasitology and molecular epidemiology have shown that such approaches can reveal geographic structuring that is not readily apparent from conventional statistical or phylogenetic analyses alone (Rinaldi et al., Reference Rinaldi, Musella, Biggeri and Cringoli2006; Poulin et al., Reference Poulin, Krasnov, Mouillot and Thieltges2011; Pullan et al., Reference Pullan, Sturrock, Magalhaes, Clements and Brooker2012). It should be noted that country-level spatial units represent a pragmatic but coarse approximation of geographic structure and may mask substantial within-country heterogeneity, particularly in large and ecologically diverse regions such as Russia, China, or Canada. Therefore, the detected spatial clusters likely reflect broad-scale structuring rather than fine-scale population boundaries. Several ecological and epidemiological factors may contribute to the observed spatial clustering. In northern Eurasia, the persistence of well-established sylvatic transmission cycles involving wolves, cervids, and other wildlife hosts may promote long-term geographic isolation and lineage diversification. In contrast, the widespread distribution of G6/G7 within domestic transmission cycles is likely influenced by livestock movements, historical animal trade, and regional husbandry practices. Differences in host community composition, environmental barriers, and the intensity of parasite surveillance may further contribute to the heterogeneous spatial distribution of mitochondrial genetic diversity. Consequently, the identified High-High clusters probably reflect the combined effects of historical evolutionary processes, host ecology, and regional transmission dynamics rather than a single underlying mechanism (Romig et al., Reference Romig, Ebi and Wassermann2015; Laurimäe et al., Reference Laurimäe, Kinkar, Moks, Bagrade and Saarma2023; Wassermann et al., Reference Wassermann, Addy, Kokolova, Okhlopkov, Leibrock, Oberle, Oksanen and Romig2024; Biedermann et al., Reference Biedermann, Laurimäe, Anijalg, Kamenetzky, Soriano, Pierangeli, Lazzarini, Umhang, Bold, Bayasgalan, Karamon, Samorek-Pieróg, Simsek, Celik, Harandi, Nasibi, Mehmood, Chihai, Casulli and Saarma2025).
Taken together, the combined factorial and spatial analyses indicate that mitochondrial genetic diversity in E. canadensis is shaped by a hierarchy of interacting factors. Genotype represents the primary axis of differentiation, while geographic origin introduces an additional layer of structuring that varies across mitochondrial markers. Host-associated effects appear to be marker-dependent and more pronounced for NADH1, suggesting differential sensitivities of mitochondrial regions to ecological and evolutionary processes. These findings underscore the importance of integrating multiple analytical approaches and genetic markers when investigating the population structure and evolutionary dynamics of complex parasitic systems.
Despite the comprehensive scope of the present analysis, several limitations should be acknowledged. First, this study relied exclusively on publicly available mitochondrial sequences, and the distribution of isolates across genotypes, host species, and countries was inherently unbalanced. As a result, some genotype-host-country combinations were represented by limited sample sizes, restricting the reliable estimation of higher-order interaction terms, particularly for the NADH1 dataset. Second, mitochondrial markers reflect only the maternal lineage and do not capture recombination or biparental inheritance, which may obscure more complex population-level processes detectable using nuclear markers (Laurimäe et al., Reference Laurimäe, Kinkar, Moks, Romig, Omer, Casulli, Umhang, Bagrade, Irshadullah, Sharbatkhori, Mirhendi, Porce-Gordo, Soriano, Varcasia, Rostami-Nejad, Andresiuk and Saarma2018; Saarma et al., Reference Saarma, Jõgisalu, Moks, Varcasia, Lavikainen, Oksanen, Simsek, Andresıuk, Denegri, Gonzalez, Ferrer, Garete, Rinaldi and Maravilla2009). Third, country-level spatial analyses, while informative at a broad scale, may mask finer-scale heterogeneity within countries, especially in regions characterised by diverse transmission cycles and host assemblages. An additional limitation of this study is the reliance on publicly available GenBank sequences, which may introduce sampling bias because sequence availability largely reflects research effort and sequencing capacity rather than the actual epidemiological distribution of E. canadensis. Consequently, some endemic regions may be underrepresented, whereas countries with well-established molecular surveillance programs may contribute disproportionately to the available data. Although objective inclusion criteria were uniformly applied to all retrieved sequences, the observed geographic patterns should therefore be interpreted as reflecting the current publicly available molecular evidence rather than the complete global distribution of genetic diversity.
Future studies integrating balanced sampling designs, nuclear genomic data, and higher-resolution spatial units are therefore warranted to further disentangle the relative roles of host adaptation, geographic isolation, and transmission ecology in shaping genetic diversity within E. canadensis. The increasing availability of whole mitochondrial genomes and genome-wide nuclear datasets offers particular promise for refining marker-specific interpretations and for linking spatial genetic patterns to epidemiological and ecological processes (Nakao et al., Reference Nakao, Yanagida, Konyaev, Lavikainen, Odnokurtsev, Zaikov and Ito2013; Romig et al., Reference Romig, Ebi and Wassermann2015).
In conclusion, this study demonstrates that mitochondrial genetic distance patterns in E. canadensis cannot be fully explained by genotype alone but are also influenced by geography and, to a lesser extent, host species in a marker-specific manner. The combined application of factorial statistical analyses and spatial autocorrelation methods enabled a comprehensive evaluation of the relative contributions of genotype, host species, and geographic origin to mitochondrial genetic differentiation in E. canadensis. This analytical framework may also be useful for future comparative studies using publicly available molecular datasets.
Supplementary material
The supplementary material for this article can be found at http://doi.org/10.1017/S0022149X26102004.
Data availability statement
The data supporting the findings of this study are based exclusively on publicly available mitochondrial DNA sequences retrieved from the National Center for Biotechnology Information (NCBI) GenBank database. No new sequence data were generated as part of this study.
Acknowledgements
N/A.
Author contribution
Conceptualisation: Sami Simsek; Data curation: Muhammed Ahmed Selcuk; Formal analysis: Tuba Bayir and Muhammed Ahmed Selcuk; Methodology: Tuba Bayir, Muhammed Ahmed Selcuk, and Sami Simsek; Statistical analysis: Tuba Bayir; Supervision: Sami Simsek; Writing – original draft: Tuba Bayir, Muhammed Ahmed Selcuk, and Sami Simsek; Writing – review and editing: Sami Simsek and Tuba Bayir.
Financial support
This research did not receive any specific grant from funding agencies in the public, commercial, or not-for-profit sectors.
Competing interests
The authors declare that there are no conflicts of interest.
Ethical standard
This study was conducted exclusively using publicly available sequence data retrieved from online databases. No new biological samples were collected, and no experiments involving humans or animals were performed. Therefore, ethical approval was not required.



 Open access

