


Introduction
The introduction of glyphosate-resistant (GR) crops changed herbicide use patterns in U.S. agriculture. Young (Reference Young2006) reported a decline in the number of herbicidal active ingredients used from 11 to only glyphosate after 7 yr of GR soybean introduction in the United States. Heavy reliance on glyphosate in GR crops across wide geographies in the United States increased the selection pressure for the evolution of GR weeds (Chahal et al. Reference Chahal, Varanasi, Jugulam and Jhala2017; Green et al. Reference Green, Hazel, Forney and Pugh2008; Owen and Zelaya Reference Owen and Zelaya2005; Young Reference Young2006). Out of 81 herbicide-resistant (HR) weed species in the United States, there are 17 weed species that have been reported with resistance to glyphosate alone (Heap Reference Heap2017). To address herbicide-resistance issues and weed problems in general, chemical and seed companies invested in the development of third-generation HR crops with stacked multiple-resistance traits (Feng et al. Reference Feng, CaJacob, Martino-Catt, Cerny, Elmore, Heck, Huang, Kruger, Malven and Miklos2010; Green and Castle Reference Green and Castle2010). The recent introduction of glyphosate- and dicamba-resistant (GDr) soybean with such traits provides a new option of using glyphosate and dicamba POST for weed control in soybean.
The adoption of this technology will increase the use of glyphosate and dicamba, which will increase selection pressure on weed populations in the agroecosystem and may lead to weed population shifts. To be proactive, the impact of this technology on the crop–weed dynamics in U.S. cropping systems needs to be understood. Previous research shows that dicamba or glyphosate plus dicamba applied PRE or POST or PRE fb POST can be effectively used to control a variety of GR weeds (Johnson et al. Reference Johnson, Young, Matthews, Marquardt, Slack, Bradley, York, Culpepper, Hager, Al-Khatib, Steckel, Moechnig, Loux, Bernards and Smeda2010; Meyer et al. Reference Meyer, Norsworthy, Young, Steckel, Bradley, Johnson, Loux, Davis, Kruger, Bararpour, Ikley, Spaunhorst and Butts2015; Soltani et al. Reference Soltani, Shropshire and Sikkema2011; Spaunhorst and Bradley Reference Spaunhorst and Bradley2013; Vink et al. Reference Vink, Soltani, Robinson, Tardif, Lawton and Sikkema2012). Inadequate GR waterhemp control with a sequential glyphosate program has been previously reported in GR and glufosinate-resistant maize (Zea mays L.) by Legleiter and Bradley (Reference Legleiter and Bradley2009). Spaunhorst and Bradley (Reference Spaunhorst and Bradley2013) reported greater control and biomass reduction of GR waterhemp with sequential applications of glyphosate plus dicamba compared with a single application of dicamba in the absence of crop competition. Greater control of waterhemp was also observed with a tank mixture of glyphosate and 2,4-D compared with 2,4-D alone (Robinson et al. Reference Robinson, Simpson and Johnson2012). Vink et al. (Reference Vink, Soltani, Robinson, Tardif, Lawton and Sikkema2012) also reported 100% GR giant ragweed control with the sequential application of glyphosate plus dicamba. The results of a long-term study conducted by Inman et al. (Reference Inman, Jordan, York, Jennings, Monks, Everman, Bollman, Fowler, Cole and Soteres2016) suggested dicamba can be used as a tool to control GR Palmer amaranth. Several other studies have also been conducted to evaluate the influence of herbicide programs on weed management in HR soybean (Bell et al. Reference Bell, Norsworthy and Scott2016; Bradley et al. Reference Bradley, Monnig, Legleiter and Wait2007; Craigmyle et al. Reference Craigmyle, Ellis and Bradley2013; Johnson et al. Reference Johnson, Young, Matthews, Marquardt, Slack, Bradley, York, Culpepper, Hager, Al-Khatib, Steckel, Moechnig, Loux, Bernards and Smeda2010; Miller and Norsworthy Reference Miller and Norsworthy2016; Schultz et al. Reference Schultz, Weber, Allen and Bradley2015b). However, there is little information on the long-term impact of different herbicide use strategies that include glyphosate and dicamba on weed populations in HR soybean.
Therefore, this study was conducted to evaluate the influence of different herbicide use strategies on weed populations in a continuous GDr-soybean cropping system over a 5-yr time period. This study provides insight into the evolution of herbicide resistance in weeds under selection pressure of different herbicide use strategies in GDr soybean, and simultaneously provides alternative herbicide strategies for weed control in such situations.
Materials and Methods
Field Study
A 5-yr field study was established in 2011 in a field infested with a variety of summer annual grass and broadleaf weeds at the University of Missouri Bradford Research Center near Columbia, MO (38.88°N, 92.20°W). The soil at the field site was a Mexico silt loam (fine, smectitic, mesic Aeric Vertic Epiaqualfs) with organic matter content of 2.2 % and a pH of 7.1.
GDr soybean provided by Monsanto (St. Louis, MO) was seeded at a depth of 2.5 cm in rows 76 cm apart with an average of 364,300 seeds ha−1 in a no-till seedbed. Before seeding of GDr soybean in 2011, a mix of GR (0.9 kg) and glyphosate-susceptible (1.4 kg) waterhemp seed were uniformly broadcast over the experimental area. Individual plots were 15-m long and 6-m wide and were arranged in a randomized complete block design with four replications.
Herbicide treatments were applied three times (one PRE and two POST applications) each season: (1) PRE, indicating that herbicide treatments were applied before soybean emergence; (2) early POST (EPOST), when average weed height was 10 to 15 cm; and (3) late POST (LPOST), when weeds or weed regrowth averaged 5 to 10 cm. Nine herbicide use strategies were evaluated, which included sequential applications of glyphosate only, glyphosate plus dicamba with or without acetochlor, PRE application of residual herbicides with POST glyphosate or non-glyphosate herbicides, and their biennial rotation with one another. A detailed list of the sources of materials and herbicide use strategies evaluated is presented in Tables 1 and 2, respectively.
Sources and rates of materials used in the experiments.

Herbicide treatments in each herbicide use strategy and their time of application and cropping season.
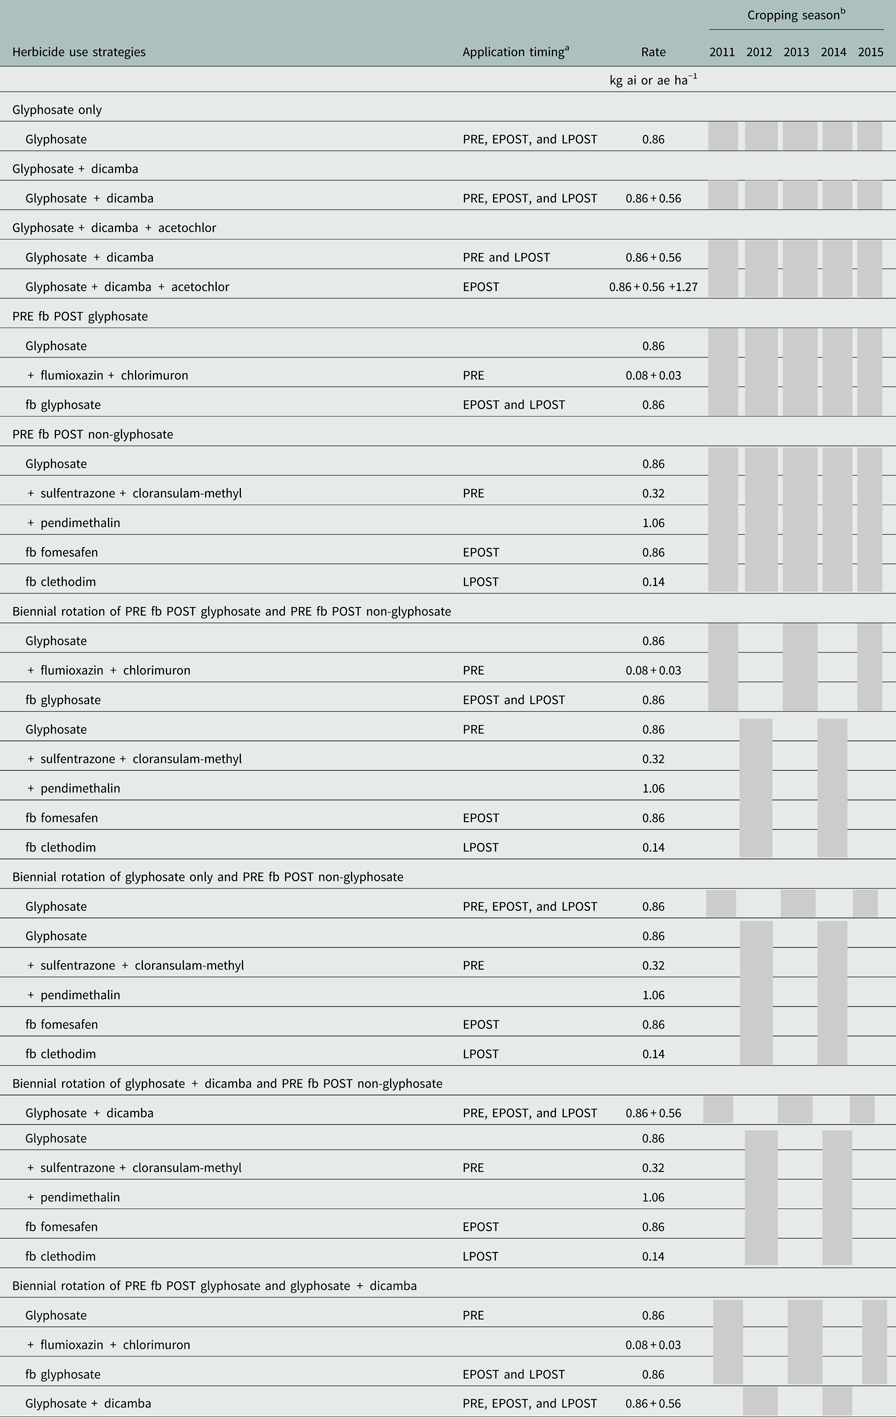
a Abbreviations: EPOST, early POST at 10- to15-cm weeds; fb, followed by; LPOST, late POST at 10- to 15-cm weed regrowth; PRE, before soybean emergence.
b The shaded area indicates the cropping season in which the herbicides were applied.
Ammonium sulfate (N-Pak® AMS Liquid, Winfield Solutions, St Paul, MN) at 2.9 kg ha−1 was added to all POST treatments, except clethodim. Crop oil concentrate at 1% v/v (Relay®, MFA, Columbia, MO) was used as an adjuvant for clethodim, whereas ammonium sulfate at 2.9 kg ha−1 plus crop oil concentrate at 1% v/v were added to fomesafen. Treatments were applied with a 3-m-wide spray boom equipped with eight nozzles and XR8002 flat-fan nozzle tips (during 2011 and 2012) or TTI11002 flat-spray nozzle tips (from 2013 to 2015) (TeeJet®, Glendale Heights, IL) spaced 38 cm apart and delivering a spray volume of 140 L ha−1 at a pressure of 117 to 124 kPa and sprayed at a speed of 1.3 m s−1.
Visual weed control ratings for each species and soybean injury ratings were taken at regular intervals after treatment on a scale of 0% (no injury) to 100% (complete control or total plant death). Weed population density was determined at harvest in 0.5-m2 quadrats randomly placed at four locations in each plot. Weeds evaluated during the five growing seasons included giant foxtail, waterhemp, giant ragweed, common ragweed (Ambrosia artemisiifolia L.), ivyleaf red morningglory (Ipomoea hederifolia L.), large crabgrass [Digitaria sanguinalis (L.) Scop.], horseweed, and annual fleabane [Erigeron annuus (L.) Pers.]. Only weed species that were most prevalent during the experimental period have been presented. Soybean grain yield at maturity was determined by harvesting the center four rows in each plot with a plot harvester, and adjusting it to 13% moisture content. To prevent movement of seed from one plot to another, the weed seed heads were cut and left in the plot before the harvesting of soybean. The crop response and weed control data for 2011 and 2015 are only presented to demonstrate the transition in weed management over 4 yr.
Greenhouse Study
In each growing season, before PRE herbicide applications, 10 soil cores (5-cm diameter and 5- to 7-cm deep) were collected from each plot and combined, and the entire soil sample was spread as a thin layer across three plastic greenhouse flats (25 by 50 cm) that had been partially filled (approximately 1.5-cm thick) with vermiculite. When emerged weed seedlings reached an average plant height of 15 cm, they were counted and sprayed with a commercial formulation of glyphosate at 1.7 kg ae ha−1 plus ammonium sulfate at 2.9 kg ha−1 using a compressed-air laboratory spray chamber equipped with a flat-fan spray nozzle delivering 220 L ha−1 of spray volume at 234 kPa. Experiments were conducted in a greenhouse at the University of Missouri in Columbia, MO, and plants were maintained at 25 to 30 C. Natural sunlight was supplemented with artificial lighting from metal-halide lamps (600 µmol photon m−2 s−1) simulating a 16 h–photoperiod day. At 21 d after treatment, survival assessments were made within each flat; plants with new green leaf tissue were recorded as resistant, whereas those that displayed severe necrosis and no new growth were recorded as susceptible. Plants were watered and fertilized as needed to maintain healthy growing conditions.
Statistical Analyses
Data were subjected to ANOVA using PROC GLIMMIX in SAS (SAS v. 9.4, SAS Institute, Cary, NC). Herbicide treatments were analyzed as fixed effects, while replication was considered a random effect. Treatment means were separated using Fisher’s protected LSD (α=0.05).
Results and Discussion
Field Study
Overall, giant foxtail and horseweed were the least problematic weeds during both growing seasons (Tables 3 and 4). Over the years and rating intervals, control of giant foxtail exceeded 90%, and population density ranged from 0 to 7.6 plants m−2. All treatments gave 100% control of horseweed in 2011, but control and weed density were more variable by 2015, possibly due to selection of a more tolerant population over the time span of this study. Conversely, waterhemp was the most predominant weed at the end of 2011, and herbicide use strategies that included glyphosate plus dicamba and the PRE fb POST non-glyphosate herbicide program were most effective in controlling and reducing its population density (Tables 3 and 4). The glyphosate-only program provided ≤25% waterhemp control, with the greatest weed density occurring at all rating intervals. However, the addition of dicamba to glyphosate improved waterhemp control and reduced its density at each rating interval. In 2011, two POST applications of glyphosate plus dicamba were required to get ≥98% waterhemp control. However, by 2015, the addition of dicamba to glyphosate annually or in a biennial rotation of a PRE fb POST glyphosate program did not provide similar levels of waterhemp control and population density reduction, which is likely due to the selection of a population with a greater level of glyphosate resistance. Johnson et al. (Reference Johnson, Young, Matthews, Marquardt, Slack, Bradley, York, Culpepper, Hager, Al-Khatib, Steckel, Moechnig, Loux, Bernards and Smeda2010) also reported an increase in GR waterhemp control from 30% to 95% with glyphosate plus dicamba compared with a glyphosate-only program.
Effect of herbicide use strategies on annual grass and broadleaf weed control at 14 d after each application timing during 2011 and 2015.Footnote a,b

a Means within the same column followed by the same letters are not significantly different according to Fisher’s protected LSD (α=0.05). Visual weed control ratings scale: 0% (no injury) to 100% (complete control or total plant death).
b Abbreviations: EPOST, early POST at 10- to 15-cm weeds; LPOST, late POST at 10- to 15-cm weed regrowth.
Effect of herbicide use strategies on annual grass and broadleaf weed population density at harvest during 2011 and 2015.

a Means within the same column followed by the same letters are not significantly different according to Fisher’s protected LSD (α=0.05).
Similarly, application of PRE herbicide mixtures before POST glyphosate application improved waterhemp control at 14 d after EPOST compared with the glyphosate-only program in 2011. Previously, herbicide use strategies containing PRE herbicides have been shown to improve GR waterhemp control compared with a POST glyphosate-only program (Legleiter et al. Reference Legleiter, Bradley and Massey2009). Unexpectedly, plots that received the glyphosate-only program resulted in excellent waterhemp control and reduction in its population density in 2015, which was a direct result of poor giant ragweed control and a dramatic increase in its population density over time. The decrease in waterhemp population density inversely correlated with the increase in giant ragweed population in these plots over time. By 2015, annual application of the PRE fb POST glyphosate and non-glyphosate herbicide use strategies and their biennial rotation, and biennial rotation of glyphosate plus dicamba and PRE fb POST non-glyphosate herbicide use strategies gave greater waterhemp control and reduction in population density over other treatments. The addition of acetochlor to glyphosate plus dicamba EPOST did not improve waterhemp control in 2011, but by 2015, it provided an additional 40% control and 58% reduction in waterhemp population density.
Giant ragweed was not a problematic weed in 2011, and all the herbicide use strategies except the glyphosate-only strategy for the LPOST application timing provided >90% control at all rating intervals, with zero population density at harvest. The glyphosate-only program provided 50% giant ragweed control when evaluated 14 d after LPOST, but the plants were chlorotic and stunted and later died. This reduction is evident from the giant ragweed population density data recorded before harvest (Table 4). By 2015, the giant ragweed population density increased in the plots that had glyphosate only, and PRE fb POST glyphosate alone or in rotation with the POST non-glyphosate herbicide strategy. Herbicide use strategies that included glyphosate plus dicamba alone or in biennial rotation with other strategies provided 80% to 99% giant ragweed control and the lowest population density. The use of dicamba in addition to glyphosate has been previously shown to improve GR giant ragweed control compared with application of glyphosate alone (Vink et al. Reference Vink, Soltani, Robinson, Tardif, Lawton and Sikkema2012). The increase in giant ragweed population density in 2015 is likely due to the evolution of glyphosate resistance in this population. In 2015, giant ragweed was the predominant weed in the plots where glyphosate was not used in combination with dicamba in any rotation, but waterhemp was the most predominant weed in all other plots.
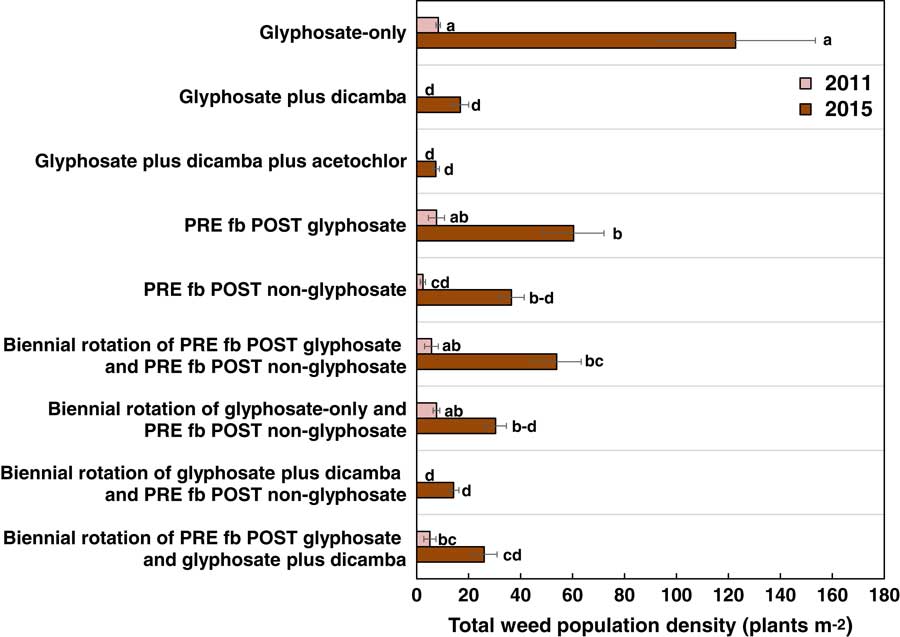
Soybean yield among herbicide use strategies was more influenced by weed control than soybean injury. Soybean injury in the form of plant stunting, chlorosis, and crinkling of leaves in the range of 0% to 8% was observed 14 d after EPOST in 2011, but the injury was transient and the soybean eventually recovered. No soybean injury was observed in 2015 and at 14 d after LPOST application in any growing season (unpublished data). Because of ineffective weed control, soybean yield during both the growing seasons was consistently lower in plots treated with glyphosate only compared with all other herbicide use strategies (Figure 1; Table 5). Barnes and Oliver (Reference Barnes and Oliver2004) showed that effect of herbicide program on soybean yield would be determined by the presence of most dominant weed species in the field. In this research, the lowest-yielding plots were dominated by GR waterhemp and/or GR giant ragweed. During both growing seasons, the greatest soybean yield occurred with herbicide use strategies that included glyphosate plus dicamba annually or in a biennial rotation. These herbicide use strategies also provided the greatest reduction in total weed density before harvest. Tank mixes of glyphosate with other herbicides have been shown to improve weed control compared with glyphosate-only programs in GR soybean (Bradley et al. Reference Bradley, Monnig, Legleiter and Wait2007; Johnson et al. Reference Johnson, Young, Matthews, Marquardt, Slack, Bradley, York, Culpepper, Hager, Al-Khatib, Steckel, Moechnig, Loux, Bernards and Smeda2010; Shaw and Arnold Reference Shaw and Arnold2002).
Effect of herbicide use strategies on total weed population density at harvest during 2011 and 2015. Bars within the same year followed by the same letters are not significantly different according to Fisher’s protected LSD (α=0.05).
Effect of herbicide use strategies on soybean yield during 2011 and 2015.

a Means within the same column followed by the same letters are not significantly different according to Fisher’s protected LSD (α=0.05).
In 2011, no additional reduction in total weed population density and increase in soybean yield was observed with PRE fb POST glyphosate compared with the glyphosate-only strategy; however, by 2015, these strategies resulted in >50% reduction in total weed population density and >250% gain in soybean yield. Over the 5-yr experimental period, the efficacy of the glyphosate-only program improved when it was biennially rotated with PRE fb POST non-glyphosate herbicide program. Additionally, the efficacy of biennial rotation of glyphosate only and the PRE fb POST non-glyphosate herbicide program improved further when dicamba was added to glyphosate in the first year of the rotation. Leon et al. (Reference Leon, Ferrell and Sellers2016) also reported an improvement in sicklepod [Senna obtusifola (L.) H. S. Irwin & Barneby] control when dicamba or 2,4-D was added to glyphosate.
In 2015 overall soybean yields were lower, which is likely due to the variation in rainfall. Columbia received 7% greater rainfall (689 mm) during 2015 compared to the 30 yr long term average (644 mm). The lower yields during 2015 are likely due to the fact that the rainfall was not equally distributed throughout the season, with heavy rainfall early in the season and very low rainfall during the reproductive stage of the crop. The water stress during the reproductive stage of the crop resulted in overall reduction in soybean yields in 2015.
Greenhouse Study
The screening of weed populations collected from each field plot provided information regarding the evolution of glyphosate resistance in these weed species over time. All of the weed species, except waterhemp and giant ragweed, were effectively controlled during the experimental period. In 2011, waterhemp plants from 25% of plots did not survive glyphosate application, and 50% of plots had survival in the range of 22% to 67% (Figure 2A). By 2015, the majority (75%) of the plots had waterhemp plants with 70% to 100% survival to glyphosate, with the remaining plots ranging from 58% to 70% plant survival. Selection with herbicides is known to rapidly increase the frequency of resistant individuals in a genetically diverse population until the resistant individuals dominate the population (Jasieniuk et al. Reference Jasieniuk, Brule-Babel and Morrison1996).
Survival of waterhemp (A) and giant ragweed (B) collected from the field and treated with glyphosate in the greenhouse during 2011 and 2015. Lower and upper boxes represent the second and third quartiles, respectively. Solid line in the box represents median value, and dotted line represents the mean. Lower and upper whiskers extend to the 10th and 90th percentiles of the data, respectively.
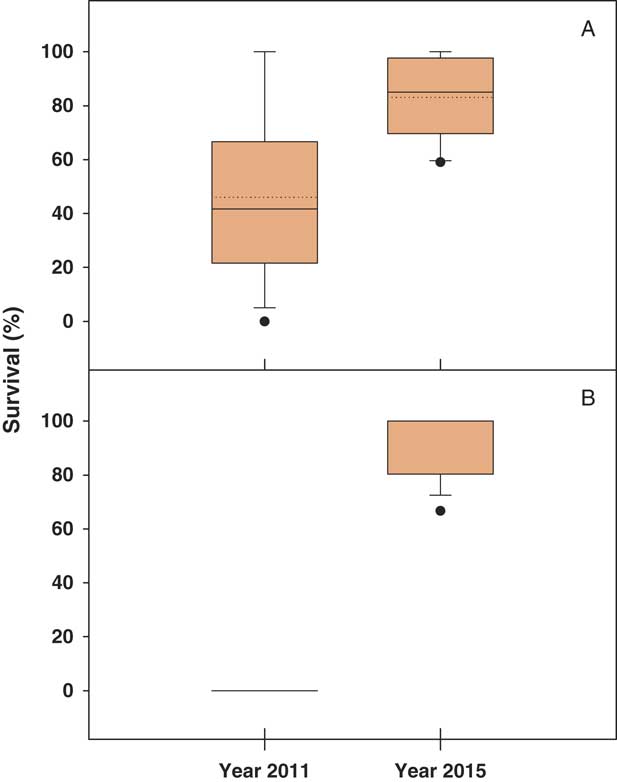
Giant ragweed was effectively controlled by glyphosate during 2011 to 2014 (unpublished data) but had evolved resistance to glyphosate by 2015 (Figure 2B). It was observed that 75% of the plots in which the herbicide use strategies were ineffective in controlling giant ragweed contained 80% to 100% GR plants. Although glyphosate resistance in weed populations has been reported to evolve over longer periods of time (James et al. Reference James, Nigel, Rex, Peter, John, Kerrie, David, Joseph and Roger1999; Perez and Kogan Reference Perez and Kogan2003; Powles et al. Reference Powles, Debrah, James and Preston1998), the rapid evolution of glyphosate resistance in this giant ragweed population could be related to the presence of initial frequency of resistant individuals that were rapidly selected under the greater selection pressure of glyphosate in GDr soybean. Collavo et al. (Reference Collavo, Strek, Beffa and Sattin2013) also reported evolution of multiple resistance to acetyl-CoA carboxylase– and acetolactate synthase–inhibiting herbicides in a rigid ryegrass (Lolium rigidum Gaudin) population over a 7-yr period. Other studies have reported the evolution of glyphosate resistance in horseweed populations within 3 yr of continuous use of glyphosate in GR crops (Koger et al. Reference Koger, Poston, Hayes and Montgomery2004; VanGessel Reference VanGessel2001). GR waterhemp and giant ragweed have been previously reported from cropping situations such as cotton (Gossypium hirsutum L.), corn, and soybean (Norsworthy et al. Reference Norsworthy, Jha, Steckel and Scott2010; Sarangi et al. Reference Sarangi, Sandell, Knezevic, Aulakh, Lindquist, Irmak and Jhala2015; Schultz et al. Reference Schultz, Chatham, Riggins, Tranel and Bradley2015a). Legleiter and Bradley (Reference Legleiter and Bradley2008) reported glyphosate resistance in waterhemp from a Missouri field with a history of continuous use of glyphosate in GR soybean.
In this study, GR in a susceptible giant ragweed population evolved in 4 yr, and the percentage of waterhemp plants with GR increased at least 2-fold. These results also show that dicamba can be a valuable addition to herbicide programs annually or in a biennial rotation, and can improve the control of problematic GR weeds, but must be used with care to avoid further resistance evolution. Glyphosate-only and PRE fb glyphosate programs annually or in a biennial rotation are unlikely to provide good weed control and will incur large yield penalties. In a recent study, Wu et al. (Reference Wu, Davis and Tranel2017) also noted that herbicide programs that only include herbicide rotations may be less effective in cases in which weeds have evolved multiple resistance. Weed control with glyphosate can be enhanced by the addition of dicamba or dicamba plus acetochlor, use of PRE herbicide mixtures, and biennially rotating glyphosate with PRE fb POST non-glyphosate herbicide program.



