INTRODUCTION
One of the most important features of farm animals is growth, because slow growth rate results in low market weight and decreased profitability (Abegaz et al. Reference Abegaz, Van Wyk and Olivier2010). Along with the development of new computational methods for more accurate and faster analyses, research focusing on growth curves in farm animals has increased in recent years (Souza et al. Reference Souza, Carneiro, Malhado, Silva and Silveira2013).
Analysis of the growth performance of animals throughout their lifetime is valuable to propose appropriate feeding methods and select the best slaughter age. The application of mathematical growth equations provides a useful method for summarizing the information included in a data set into a few parameters in order to facilitate both the understanding of the event and its interpretation (Malhado et al. Reference Malhado, Carneiro, Affonso, Souza and Sarmento2009). The parameters of growth curve give a potentially useful basis for modifying the association between age and body weight via selection (Kachman & Gianola Reference Kachman and Gianola1984) and a favourable growth curve can be obtained through selection for suitable values of growth curve parameters (Bathaei & Leroy Reference Bathaei and Leroy1998).
The ability to modify the growth curve shape by breeding or genetic selection may be an interesting perspective for farm animal producers. The selection of an appropriate mathematical model to describe the growth curve could provide the possibility of direct selection on the level of the growth curve for individual animals. It is necessary to provide an appropriate plan to obtain a suitable growth shape via modifying growth model parameters (Ghavi Hossein-Zadeh Reference Ghavi Hossein-Zadeh2014). In previous research, a wide range of growth models were studied and selected; depending upon how accurately selected models fit the available data set (McManus et al. Reference McManus, Evangelista, Fernandes, Miranda, Moreno-Bernal and Santos2003; Lambe et al. Reference Lambe, Navajas, Simm and Bünger2006; Malhado et al. Reference Malhado, Carneiro, Affonso, Souza and Sarmento2009; Ghavi Hossein-Zadeh Reference Ghavi Hossein-Zadeh2015a ). Results of different studies suggest that growth curve variables are heritable in different species and that it may be possible to change the shape of the growth curve through selection of these traits (Kachman et al. Reference Kachman, Baker and Gianola1988; Lewis & Brotherstone Reference Lewis and Brotherstone2002). Genetic parameters must be estimated for the underlying growth curve characteristics to determine the genetic flexibility of the shape of growth curves (Lambe et al. Reference Lambe, Navajas, Simm and Bünger2006).
One of the main Iranian meat sheep breeds is Moghani, which is notable for its tolerance to harsh climatic conditions, ability to provide heavy lambs and large body size. No previous studies addressed growth curve characteristics of the Iranian Moghani sheep. Also, estimates of variance components and heritabilities for growth curve parameters in sheep are very scarce in the literature (Bathaei & Leroy Reference Bathaei and Leroy1998; Ghavi Hossein-Zadeh Reference Ghavi Hossein-Zadeh2015b , Reference Ghavi Hossein-Zadeh c ). Therefore, the objective of the current study was to describe the growth pattern in Moghani sheep using non-linear mixed models. Five mathematical models were examined to evaluate their efficiency in describing the growth curve of Moghani sheep. After selecting the best growth curve, variance components and genetic parameters for growth curve characteristics of Iranian Moghani sheep were estimated using Gibbs sampling algorithm in Bayesian methodology.
MATERIALS AND METHODS
Moghani sheep were reared under a traditional migratory method with the flock kept in winter pastures from November to April and in summer ranges during May to October. The main feeding sources of animals were pasture grasses; however, some barley was supplied for breeding animals nearly 2 weeks before the start of the mating period, over the final month of pregnancy and the first month of milking. The breeding period commenced from August and lasted till October, with lambing occurring from January to February. The parents of each lamb were known because a controlled mating method was performed in the flock (Ghavi Hossein-Zadeh & Ardalan Reference Ghavi Hossein-Zadeh and Ardalan2010).
The data set used in the current study were obtained from the breeding station for Moghani sheep (in Ardebil province, north-west Iran) and comprised 7905 weight records (made up of 4765 for males, 3140 for female lambs, 5590 for single lambs and 2315 for twin lambs) which were collected on 1581 lambs (628 females, 953 males, 1118 singles and 463 twins) from birth to 400 days of age across the period 1994–2012. Therefore, each lamb had five body weight records (birth, 3-month, 6-month, 9-month and yearling). Average body weights at birth and yearling were 4·13 and 38·84 kg in the current data set. Also, the average mature weight of Moghani sheep was reported to be 60 kg (Abdollahy et al. Reference Abdollahy, Hasani, Zerehdaran, Shadparvar and Mahmoudi2012). Data were screened several times and defective and out of range records were deleted. Therefore, lambs with ages >400 days were left out. Also, records of lambs with unclear sex and those of triplets (which included 0·4% of the total data set) were discarded.
The non-linear growth functions used to describe the growth curves of Moghani sheep are presented in Table 1. The Brody, Negative exponential, Logistic, Gompertz and von Bertalanffy functions were fit to the data to model the relationship between weight and age. Each model was fitted to body weight records for all lambs, males, females, singles and twin lambs using the NLMIXED procedure in SAS (SAS Institute 2002) and the parameters were estimated. Data from different animals were pooled together in a single growth curve, so estimates of the equation parameters were estimated, as the average for all animals included in that particular group (i.e., all animals, males, females, single lambs and twins). This would be the fixed component of the mixed models. Then a random component which would indicate the variability among animals within the above-mentioned groups was also estimated. The non-linear mixed models were examined for goodness of fit (quality of prediction) using Akaike's information criterion (AIC) and residual variance (
 $\sigma _e^2 $
). Smaller values of AIC and residual variance suggest a better fit when comparing the models.
Functional forms of equations used to describe the growth curve of Moghani sheep

Y, body weight at age t (day); A, asymptotic weight, which is interpreted as mature weight; and B, is an integration constant related to initial animal weight. The value of B is defined by the initial values for y and t; K, is the maturation rate, which is interpreted as weight change in relation to mature weight to indicate how fast the animal approaches adult weight.
After selecting the best growth model, the NLIN procedure of SAS was used for obtaining parameters of the growth curve for each animal to conduct genetic analysis. Atypical growth curves of lambs resulting in out-of-range parameters were deleted. Also, lambs with incomplete records of parentage or with registration numbers lower than the numbers of their parents were left out. In addition to a data file, a pedigree file is required for conducting a genetic analysis of data. Therefore, the number of animals (in total), sires, dams, founders and non-founders in the pedigree of Moghani sheep were 35 076, 1085, 9954, 16 344 and 18 732, respectively.
The choice of fixed effects to be considered was made after testing whether the effects were statistically significant with a linear fixed effects model analysed with the GLM procedure of SAS. Level of significance for the inclusion of effects into the model of analysis was declared at P < 0·05. The final model for A, B and K parameters included the fixed class effects of year and month of birth, sex, litter size and age of dam (from 2 to 7 years old). The univariate animal model fitted for the genetic analysis of the growth curve parameters was as follows:
 $${\bi {y}} = {\bi {Xb}} + {\bi {Z}}_{\bi {a}} {\bi {a}} + {\bi {Z}}_{\bi {m}}{\bi {m}} + {\bi {Z}}_{\bi {c}}{\bi {c} + e}$$
where
y
is a N × 1 vector of records (growth curve parameters),
b
denotes the fixed effects in the model with association matrix
X
,
a
is the vector of direct genetic effects with the incidence matrix
Z
a
,
m
is the vector of maternal genetic effects with the incidence matrix
Z
m
,
c
is the vector of maternal permanent environmental effects with the incidence matrix
Z
c
and
e
denotes the vector of residual (temporary environmental) effects. From a Bayesian perspective, it was assumed that prior distributions for additive direct and maternal effects were multivariate normal distribution with mean 0 and variance
 ${\bi A}\sigma _a^2 $
and
 ${\bi A}\sigma _m^2 $
, respectively, where
A
is the additive numerator relationship matrix and
 $\sigma _a^2$
and
 $\sigma _m^2$
are additive direct and maternal variances, respectively. Residual effects were assumed to be multivariate normally distributed with mean 0 and variance
 ${\bi I}_{\bi n}\sigma _e^2 $
, where
I
n
is identity matrix with order equal to the number of individual records, and
 $\sigma _e^2 $
is the residual variance, respectively. Permanent environmental effects of the dam were assumed to be multivariate normally distributed with mean 0 and variance
 ${\bi I}_{\bi d}\sigma _{{\rm pe}}^2 $
, where
I
d
is identity matrix with order equal to the number of dams and
 $\sigma _{pe}^2 $
is maternal permanent environmental variance. Bivariate or pair-wise analyses were carried out for every pair of the growth curve parameters. The models applied in pair-wise analyses were those fitted for each of the growth curve parameters in the univariate analyses.
The prior distribution for the genetic and residual (co)variance matrices was assumed to be an inverted Wishart distribution. Marginal posterior distributions of parameters and variance components were estimated, using the Threshold Model (TM) programme (Legarra et al. Reference Legarra, Varona and Lopez de Maturana2011). The Gibbs sampler was run 1 000 000 rounds and the first 200 000 rounds were discarded as a burn-in period (Legarra et al. Reference Legarra, Varona and Lopez de Maturana2011). A thinning interval of 100 rounds was used to retain sampled values that reduced lag correlation among thinned samples. In the TM programme it is assumed a priori that the direct and maternal effects are correlated. The Gibbs Sampling algorithm (Magnabosco et al. Reference Magnabosco, Lôbo and Famula2000) enables estimation of random samples of parameter estimates based on a given data set, by generating posterior distributions of parameter values that are proportional to the product of the parameter probabilities and the observation probabilities (Ghavi Hossein-Zadeh & Ardalan Reference Ghavi Hossein-Zadeh and Ardalan2010). The Bayesian Output Analysis (BOA version 1.1.5; Smith Reference Smith2005) package was used to calculate the mean, s.d., and 95% high posterior density (HPD) interval for all parameters from the individual marginal posteriors, using the free software R (http://www.rproject.org/). The HPD region provides the interval that includes 95% of samples and is a measure of reliability. Also, the HPD can be applied to non-symmetric distributions (Hyndman Reference Hyndman1996). Convergence diagnostics tests within the BOA package (Smith Reference Smith2005) were used to control and verify the convergence of genetic analyses.
RESULTS
Comparison of non-linear mixed growth models
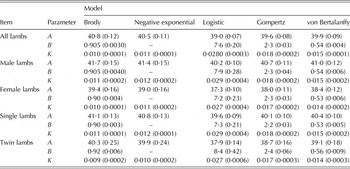
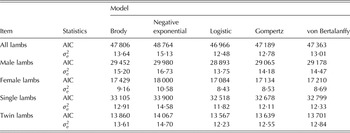
Parameter estimates of non-linear mixed growth models for Iranian Moghani sheep are displayed in Table 2. Also, statistics of goodness of fit for the five growth equations fitted to the records of body weight are demonstrated in Table 3. Logistic function supplied the lowest values of AIC and residual variance for females, males, singles, twins and all lambs. Therefore, the Logistic model was selected as the best function for fitting the growth curve in singles, twins, females, males and all lambs. The means and standard errors of A, B and K parameters obtained from fitting the Logistic model were 39·2 ± 0·12, 8·2 ± 0·05 and 0·0290 ± 0·00025, respectively.
Parameter estimates (standard errors are in parentheses) for the different mixed models of growth in Moghani sheep

A, asymptotic weight, which is interpreted as mature weight; and B, an integration constant related to initial animal weight. The value of B is defined by the initial values for y and t; K, maturation rate, which is interpreted as weight change in relation to mature weight to indicate how fast the animal approaches adult weight.
Comparing goodness of fit for different growth curves in Moghani sheep

AIC, Akaike information criteria;
 $\sigma _e^2 $
, residual variance.
The growth model parameter of A is an asymptotic weight estimate, which can be explained as adult or mature weight of animal. There were low estimates of asymptotic weight (A parameter) for the Logistic equation as the best-fitted growth model, but the Brody model provided the greatest values of A parameter compared with other equations (Table 2). In the current study, males and single lambs showed higher values for parameter K, indicating greater maturity rates (i.e., they arrived at mature weight earlier than females and twins, respectively). The negative correlations of −0·40 to −0·34 were obtained between parameters A and K, based on the Logistic model for singles, twins, males, females and all lambs.
Predicted body weights as a function of age (days) obtained with different growth models for all lambs are depicted in Fig. 1. As shown, there was an increasing trend for body weights along with increase in age and growth curves followed typically a sigmoid pattern.
Predicted body weights (kg) as a function of age (days) obtained with different growth models for all Moghani lambs.

Estimation of genetic parameters for growth curve characteristics
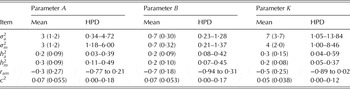
The posterior means of variance components and direct heritabilities and their HPDs for growth curve parameters obtained from univariate models of analysis are presented in Table 4. Posterior mean estimates of direct heritabilities for A, B and K were 0·21, 0·24 and 0·29, respectively. Also, posterior mean estimates of maternal heritabilities for A, B and K were 0·27, 0·24 and 0·19, respectively.
The posterior mean of direct genetic and maternal genetic variance components and direct and maternal heritabilities for A, B and K parameters of growth curve in Moghani sheep [standard deviations (PSD) of marginal posterior distribution of mean estimates are in brackets]

 $h_a^2 $
, direct heritability;
 $h_m^2 $
, maternal heritability; r
am
, correlation between direct additive and maternal genetic effects; c
2, ratio of maternal permanent environment variance to phenotypic variance;
 $\sigma _a^2 $
, direct additive genetic variance;
 $\sigma _m^2 $
, maternal genetic variance; HPD, 95% high posterior density confidence interval.
Estimates of correlation between direct and maternal genetic effects for A, B and K parameters were −0·33, −0·69 and −0·51, respectively (Table 4). The ratios of maternal permanent environment variance to phenotypic variance (c 2) for growth curve parameters were low (from 0·045 to 0·070). All HPD ranges of direct additive and maternal genetic variances were >0. Also, HPD range for correlation between direct and maternal genetic effects, except for A parameter, was negative and different from zero. Also, the variation range of HPD values for c 2 included zero. Therefore, these estimates could be considered as zero. Estimates of direct genetic, maternal genetic, maternal permanent environmental and residual correlations between growth curve parameters are shown in Table 5. Estimates of direct genetic correlations between A–B, A–K and B–K were positive and equal to 0·19, 0·07 and 0·28, respectively. Also, maternal genetic correlations between A–B, A–K and B–K were positive and equal to 0·43, 0·34 and 0·55, respectively. The HPD ranges of direct genetic correlations between all parameters and maternal genetic correlation between A and K included zero. Although maternal permanent environmental correlations between growth curve parameters varied from 0·04 to 0·70, the corresponding HPD ranges included zero. The mean estimates of residual correlations between A–B, A–K and B–K were 0·14, −0·17 and 0·13, respectively.
The posterior mean of direct genetic, maternal genetic, permanent maternal environmental and residual correlations between growth curve parameters [standard deviations (PSD) of marginal posterior distribution of mean estimates are in brackets]

 $r_{a_{12}}$
, posterior mean of direct genetic correlation between traits 1 and 2;
 $r_{m_{12}}$
, posterior mean of maternal genetic correlation between traits 1 and 2;
 $r_{pe_{12}}$
, posterior mean of maternal permanent environmental correlation between traits 1 and 2;
 $r_{e_{12}}$
, posterior mean of residual correlation between traits 1 and 2;
 $r_{a_2m_1}$
, posterior mean of correlation between direct genetic effect of trait 1 and maternal genetic effect of trait 2;
 $r_{{a_1}{m_2}}$
, posterior mean of correlation between direct genetic effect of trait 2 and maternal genetic effect of trait 1; HPD, 95% high posterior density confidence interval.
DISCUSSION
Although the concept of non-linear mixed models is not new, the application of non-linear mixed modelling for describing growth curves in sheep is scarce in the literature (Bahreini Behzadi et al. Reference Bahreini Behzadi, Aslaminejad, Sharifi and Simianer2014). Therefore, the current study is one of the first to fit and compare non-linear mixed models to describe the growth curve in a fat-tailed breed of sheep. The parameter estimates in the current study may imply that animals are heavy at their adult age and may be considered slow-growing, because it seems that these sheep require more time to arrive at maturity in comparison with other sheep breeds (da Silva et al. Reference da Silva, Fraga, da Silva, Beelen, Silva, Tonhati and Barros2012). The yearling weight of Moghani sheep (38·84 kg) had good consistency with estimated asymptotic weight (A parameter) obtained from the Logistic model (39·04 kg), but was lower than the actual mature weight for this breed of sheep (around 60 kg). The growth model parameter K, defined as the rate of maturation, is another influential characteristic to be taken into account, because it implies the speed of animal growth to arrive at the asymptotic or mature weight. High values of K indicate an advanced maturity and it seems probable that animals with higher values of K arrive at mature or asymptotic weight earlier than those with lower values of this parameter. The distinction between parameter estimates reported by different studies could be ascribed to differences in time units, month instead of day as in the current study, and the various growth models applied (Goliomytis et al. Reference Goliomytis, Orfanos, Panopoulou and Rogdakis2006). The correlation between parameters A and K of the growth curve is very important from a biological perspective. These correlation estimates indicated that animals with higher mature weights mostly display lower body weight modification in relation to adult weight than animals with a lower mature weight (da Silva et al. Reference da Silva, Fraga, da Silva, Beelen, Silva, Tonhati and Barros2012).
It has been shown that a negative and high genetic correlation between direct and maternal genetic effects for a specific trait might be a product of existing genetic antagonism and can be influenced by data structure (Maniatis & Pollott Reference Maniatis and Pollott2003). It seems possible that the antagonism between the effects of an individual's genes for growth and those of its dam for a maternal ability might be due to natural selection for an intermediate optimum (Tosh & Kemp Reference Tosh and Kemp1994). The relatively high negative estimates of direct-maternal correlations for growth curve characteristics suggest that it would be difficult to jointly improve direct and maternal growth curve characteristics in this breed of sheep.
Medium estimates of direct heritabilities for A, B and K parameters imply that improvement in these parameters could be attained by genetic selection. Consistent with the results of the current study, Ghavi Hossein-Zadeh (Reference Ghavi Hossein-Zadeh2015b ) reported medium estimates of direct heritability for A (0·39) and B (0·23) parameters, but a low estimate for K using the Brody model (0·039) in Iranian Guilan sheep. However, in contrast to the current results, Ghavi Hossein-Zadeh (Reference Ghavi Hossein-Zadeh2015c ) obtained low estimates of direct heritabilities for Brody model parameters of A (0·13), B (0·15) and K (0·19) in Iranian Shall sheep. The magnitude of the maternal heritability for growth curve parameter K was lower than the direct heritability, but maternal heritabilities were similar or greater than direct ones for A and B parameters. This result indicated that maternal genetic effects were as important as direct effects for A and B parameters, and although maternal effects influenced the expression of the K parameter, this effect was not as important as the direct effect. Abegaz et al. (Reference Abegaz, Van Wyk and Olivier2010) reported the estimates of heritabilities were 0·29, 0·18 and 0·14 for A, B and K parameters of the Brody model in Horro sheep, respectively. Bathaei & Leroy (Reference Bathaei and Leroy1998) and Stobart et al. (Reference Stobart, Bassett, Cartwright and Blackwell1986) reported high estimates of heritability (0·52 and 0·53, respectively) for parameter A, which is different from the results of the current study. Also, consistent with the current results, Mavrogenis & Constantinou (Reference Mavrogenis and Constantinou1990) and Näsholm (Reference Näsholm, Hill, Thompson and Woolliams1990) reported medium heritabilities of 0·30 and 0·29 for this parameter in Chios sheep and Swedish Finewool sheep, respectively. It is important to note that the variation ranges of HPDs of the direct and maternal heritabilities are located at the region >0. The medium heritability estimate for mature weight is probably due to maturity at a later age in Moghani sheep, where the influence of environmental factors becomes relatively small. In general, several factors such as breed of animal, genetic variation within the population, management and environmental conditions, the method of estimating parameter, etc., would have affected the differences between estimations (Ghavi Hossein-Zadeh & Ardalan Reference Ghavi Hossein-Zadeh and Ardalan2010). The heritability and genetic relationship between traits are needed for planning an efficient breeding system and development of an effective genetic evaluation.
The low positive direct genetic correlations and medium-to-high maternal genetic correlations between growth curve parameters reported in the current study implies that genes that positively influence one parameter would result in greater values of the other parameter. The positive genetic correlation between these parameters of the growth curve is evidence for common genetic and physiological mechanisms controlling these characteristics (Ghavi Hossein-Zadeh Reference Ghavi Hossein-Zadeh2011). Also, positive genetic correlations between the traits under study suggest that genetic selection for one parameter would also improve the other. Positive genetic correlation between A and K in the current study was inconsistent with those reported by Abegaz et al. (Reference Abegaz, Van Wyk and Olivier2010), Bathaei & Leroy (Reference Bathaei and Leroy1998) and Stobart et al. (Reference Stobart, Bassett, Cartwright and Blackwell1986). Positive genetic correlation between A and B indicated that heavy lambs at birth had greater weight at maturity. Therefore, medium heritabilities for initial and mature weights along with positive genetic correlations between them make it clear that genetic changes in growth patterns can be accomplished. The positive residual correlation between A and B indicated that improvement of environmental conditions at a early stage of growth could have positive effects at a later stage. The negative residual correlation between A and K in the current study implied that provision of appropriate environmental conditions for early maturity could not have positive effects on mature weight.
The results of a previous study (Ghavi Hossein-Zadeh & Ardalan Reference Ghavi Hossein-Zadeh and Ardalan2010) indicated that 3-month weight and 6-month weight could be considered as the main components of a selection goal in Moghani sheep. Therefore, animals in the current study were selected primarily based on 3-month weight, 6-month weight or average daily gain from 3 to 6 months of age in the breeding station of Moghani sheep. The current estimates of genetic parameters for growth curve characteristics could be used for designing future selection schemes for this breed. Based on the current results, there was a possibility for conducting direct selection on parameters A, B and/or K of the growth curve. Exploitable genetic variation in these parameters may facilitate greater selection intensity and thus greater response to selection, as well as reducing the replacement costs through improving the growth rate of animals. Higher heritability of the K parameter in the current study shows that higher potential exists for selecting animals with the fastest maturity. This is an advantage due to reduced generation interval. Due to the positive and high genetic correlation between A and B, any increase in initial body weight could be associated with increase in mature weight which requires an increase in feed cost in the flock. This is particularly important where the costs of supplementary feeding constitute a relatively large proportion of the total costs, as is the case of Iranian flocks (Bathaei & Leroy Reference Bathaei and Leroy1998). In this situation, selection could be for animals with a faster growth rate in early age and/or those that are early maturing. Faster growth rate increases the proportion of feed used for tissue synthesis and diminishes total inputs/unit of body weight gain (Bathaei & Leroy Reference Bathaei and Leroy1998). As another selection strategy, construction of a selection index combining growth and reproductive traits (such as body weights, growth curve characteristics and litter size) could be a possible strategy to improve jointly growth and reproductive performance of the Moghani breed.
CONCLUSIONS
The five non-linear mixed functions investigated in the present study were adequate to describe the growth pattern in Moghani sheep. The Logistic model provided the best fit of growth curves in males, females, singles, twins and all lambs due to the lower values of AIC and residual variance than other models. The results of the current study can help planning farm management strategies and decision making regarding the culling of poor producers and selecting the highly productive animals just by viewing their growth curve. Current estimates of genetic parameters for growth curve characteristics in Moghani sheep could be applied in designing a genetic selection programme in this breed. Regarding the medium heritabilities for growth curve parameters along with positive genetic correlations between them make it clear that genetic changes in growth patterns can be accomplished. Therefore, in designing future selection programmes for this breed of sheep, genetic improvement of growth parameters would be one of the main components of selection goals. Development of an optimal selection strategy to achieve a desired shape of growth curve through changing the parameters of model genetically would be very important.
The author would like to acknowledge the University of Guilan for financial support of this research (Project No. 989). Also, author wishes to thank the breeding station of Moghani sheep for providing the data used in the current study.