Introduction
In selective breeding, a population of individuals having a mutational event in a gene of interest is first isolated and then analysed in terms of its phenotypic variation. Breeding can be aided by reverse genetics or techniques such as targeting induced local lesions in genomes (TILLING; McCallum et al., Reference McCallum, Comai, Greene and Henikoff2000). The technique of TILLING is even more relevant when it is unlikely that these mutations exist in the germplasm. Moreover, non-transgenic techniques such as TILLING have been used widely to improve agronomic practices (Sikora et al., Reference Sikora, Chawade, Larsson, Olsson and Olsson2011). These techniques have the advantage of not involving the regulations to which genetically modified plants are subject. Furthermore, non-transgenic techniques are useful for determining the allelic variants of a gene of specific interest. These allelic variants can come from natural or induced point mutations (Rashid et al., Reference Rashid, He, Guanxiao and Khurram2011).
TILLING operates independently of genome size, ploidy and reproductive system of plants. It usually consists of three steps: (1) the creation of a mutagenized population by use of a mutagenic agent, (2) mixing of DNA or groups and (3) discovery of mutations (Till et al., Reference Till, Zerr, Comai and Henikoff2006). The main chemical mutagenic agents used in plant breeding are methylnitrosourea (Suzuki et al., Reference Suzuki, Eiguchi, Kumamaru, Satoh, Matsusaka, Moriguchi, Nagato and Kurata2008), ethylnitrosourea (Till et al., Reference Till, Reynolds, Greene, Codomo, Enns, Johnson, Burtner, Odden, Young, Taylor, Henikoff, Comai and Henikoff2003), γ-ray mutagenesis (Rosenbluth et al., Reference Rosenbluth, Cuddeford and Baillie1983), sodium azide (Lee et al., Reference Lee, Rustgi, Kumar, Burke, Yenish, Gill, von Wettstein and Ullrich2011), including ethyl methane sulfonate (EMS), which is usually assumed to produce point mutation type transitions of G→C to A→T (Nagy et al., Reference Nagy, Perrimon, Sandmeyer and Plasterk2003). The concentration of EMS employed is dependent on the quantity and size of the seed. For example, the effective dose for Beta vulgaris is between 0.5 and 1% (Hohmann et al., Reference Hohmann, Jacobs and Jung2005), while for Brassica napus it is 0.4–1.2% (Wang et al., Reference Wang, Wang, Tian, King, Zhang, Long, Shi and Meng2008) and for Cucumis melo, 1–3% (Dahmani-Mardas et al., Reference Dahmani-Mardas, Troadec, Boualem, Lévêque, Alsadon, Aldoss, Dogimont and Bendahmane2010).
Several studies describe alternative techniques for detecting mutations in large populations, which generally include conformation-sensitive gel electrophoresis (Rozycka et al., Reference Rozycka, Collins, Stratton and Wooster2000), analysis of high-resolution melting (Gady et al., Reference Gady, Vriezen, Van de Wal, Huang, Bovy, Visser and Bachem2012) and next-generation sequencing (NGS) (Tsai et al., Reference Tsai, Howell, Nitcher, Missirian, Watson, Ngo, Lieberman, Fass, Uauy, Tran, Khan, Filkov, Tai, Dubcovsky and Comai2011). Of these techniques, NGS is used most commonly today. The use of TILLING and EMS has been developed extensively for the generation of herbicide-tolerant crops (Jander et al., Reference Jander, Baerson, Hudak, Gonzalez, Gruys and Last2003) and, notably, these techniques have been useful for crops resistant to acetolactate synthase (ALS)-inhibiting herbicides (Yu and Powles, Reference Yu and Powles2014). Crops resistant to ALS-inhibiting herbicides have numerous point mutations altering the nucleotide sequence of the AHAS gene (Busi et al., Reference Busi, Vila-Aiub, Beckie, Gaines, Goggin, Kaundun, Lacoste, Neve, Nissen, Norsworthy, Renton, Shaner, Tranel, Wright, Yu and Powles2013).
Quinoa was domesticated and has been cultivated in the Andes for the last 7000 years; however, despite being an old crop, it is new to modern agriculture. Few studies have been conducted concerning quinoa's response to herbicides (De Barros Santos et al., Reference de Barros Santos, Spehar and Vivaldi2003) or tolerance to herbicides. Post-emergence herbicide application is not an alternative for quinoa production since there is currently no herbicide developed to selectively target weeds and not quinoa (Jacobsen et al., Reference Jacobsen, Mujica and Jensen2003). Weed control is one of the factors limiting mass production of quinoa and weeds have been shown to reduce yields by 50–90% (Ruiz et al., Reference Ruiz, Biondi, Oses, Acuña-Rodríguez, Antognoni, Martinez-Mosqueira, Coulibaly, Canahua-Murillo, Pinto, Zurita-Silva, Bazile, Jacobsen and Molina-Montenegro2014). Currently, controlling weeds in quinoa production is limited to manual control (Jacobsen et al., Reference Jacobsen, Christiansen and Rasmussen2010). The known herbicides that are effective at controlling common weeds associated with quinoa also cause varying degrees of phytotoxicity to the crop, as quinoa belongs to the same family as many different types of weeds (De Barros Santos et al., Reference de Barros Santos, Spehar and Vivaldi2003). Some herbicides developed for B. vulgaris and Spinacia oleracea, such as alachlor and tribunil, have shown little damage when used in quinoa cultivation (Alvarez, 1990, cited by De Barros Santos et al., Reference de Barros Santos, Spehar and Vivaldi2003). Based on this background, the current study was conducted in order to establish a mutagenesis protocol in Chenopodium quinoa using EMS and a TILLING library for future applications in forward and reverse genetics. In addition, a methodology for using pre-selection phenotypic data and NGS was generated in order to select allelic variants of AHAS genes related to herbicide resistance.
Materials and methods
Plant material and mutation induction
The starting material for the current study was Regalona–Baer variety (Agrogen; Von Baer et al., Reference von Baer, Bazile and Martinez2009). The seeds (n = 200) were disinfected with 10% sodium hypochlorite and then washed three times with distilled water. After this treatment, mutagen EMS was applied to the seeds using the method described above for quinoa (Samanta Tropa, personal communication, 2012). Quinoa seeds were immersed in 1, 2, 3 and 4% EMS solutions for 8 h. Following mutagenesis, seeds were incubated in two series of sodium thiosulfate (0.1 M, pH 7.4) washing buffer for 20 min at room temperature with gentle agitation (100 rpm) to remove debris from the EMS treatment. Finally, the seeds were washed in distilled water and then rinsed with tap water for 10 min. Excess water on the seeds was removed by placing the seeds on filter paper. Seeds were planted immediately in a greenhouse in trays with 84 pots. Data were collected to establish the ‘kill curve’ (i.e. lethal dose response) (Sabetta et al., Reference Sabetta, Alba, Blanco and Montemurro2011).
Generation of mutations and mutation analysis
The most appropriate treatment was determined using the ‘kill curve’. Then, a mutant population grown under controlled greenhouse conditions was generated. To generate the mutant population, 12 g (approximately 6000 seeds) of Regalona–Baer seeds were used. The seeds were treated as described above, except that they were deposited in beds with substrate rather than in trays. M2 generations were obtained from self-fertilization of the plants generated from these seeds. Over 3000 M2 plants were again propagated in the greenhouse to create the M3 generation. Seeds from the M3 generation were stored in a seedbank for future phenotyping. M2 and M3 plants were properly labelled for identification. When the M2 plants developed true leaves, two individual tissue samples were taken, frozen in liquid nitrogen and stored at −70 °C for DNA isolation. DNA extraction was performed using the cetyl trimethylammonium bromide protocol as described in Arismendi et al. (Reference Arismendi, Andrade, Riegel and Carrillo2010). The quantity and quality of DNA was determined using a Qubit fluorometer (Life Technologies Corporation, Carlsbad, CA, USA). DNA samples were standardized to 10 ƞg/μl and stored at −70 °C.
For mutation identification and characterization, the AHAS1 (1168 bp), AHAS2 (1219 bp) (constitutive gene without introns), ITS-plant (764 bp) (sequence with introns) and psbA (1083 bp) (chloroplast gene) genes were analysed in 48 plants. The selection and design of primers for gene amplification was performed as follows: for the AHAS genes, information generated by Mestanza et al. (Reference Mestanza, Riegel, Silva and Vásquez2015) was used, where each of the existing variants of the gene are described. For the ITS-plant genes, universal primers described by Varghese et al. (Reference Varghese, Chauhan and Misra2003) were used, and for the psbA gene (Mestanza et al., Reference Mestanza, Riegel, Véliz, Vásquez, Martínez, Chang and Falquez2017) an alignment of sequences existing in databases was used. The alignment was performed with the program ClustalW and, subsequently, conserved regions of the sequence were identified and primers designed using the program Primer3 (Rozen and Skaletsky, Reference Rozen, Skaletsky, Misener and Krawetz2000).
The polymerase chain reactions (PCR) contained the following: 1 µl of total DNA (5 ƞg/μl), 1 µl of each primer (10 ρM/μl), 2 µl of magnesium chloride (MgCl2; 25 mM/μl), 1 µl of each deoxyribonucleotide triphosphate (2.5 mM/μl), 1 U of Taq DNA polymerase and 2.5 µl of 10X buffer supplied with the enzyme in a final volume of 25 µl. The basic amplification protocol consisted of incubation for 3 min at 94 °C, 34 cycles of 35 s at 94 °C, 45 s at X °C, and 1.45 min at 72 °C, and a final extension of 7 min at 72 °C, where X is the annealing temperature for each pair of primers used. The products obtained were sent for sequencing at Macrogen-Korea and the sequences generated were analysed using the Chromas and Bioedit computation programs. Sequence identities were confirmed using the nucleotideBlast and BlastX algorithms available from the NCBI website (https://www.ncbi.nlm.nih.gov/).
Variables analysed in the establishment of the protocol and the mutant population
Establishment of the mutant population was assessed in the M0 through the following parameters: germination percentage, number of viable plants, number of fertile plants and germination percentage in the M1 generation. The measurements were then used to establish the recommended EMS dosage (‘kill curve’). Subsequently, the mutation frequency for each gene was determined from the obtained sequences. In addition, the following formula was used to determine the overall mutation rate: 2 × (amplicon size) × (number of plants)/(number of identified mutations) (Triques et al., Reference Triques, Sturbois, Gallais, Dalmais, Chauvin, Clepet, Aubourg, Rameau, Caboche and Bendahmane2007). The values in the calculations varied for each gene studied.
Pre-phenotypic selection in the TILLING population
Herbicides were applied when the M1 plants of each treatment had four true leaves. The herbicides had two different active ingredients, sulfonylureas (metsulfuron-methyl) and imidazolinone (imazethapyr), and each lot received only one of the two active ingredients (a.i.). The doses used in the first application were 3.5 and 74.13 g a.i/ha, respectively (70% of that recommended by the manufacturer). In the following year, after the first selection, M2 selected mutant plants were sown in the field in two separate field plots. When the plants had four true leaves, the herbicide was applied again with 100% of the recommended dose (5 and 105.9 g a.i./ha, respectively).
AHAS gene amplification and next-generation sequencing
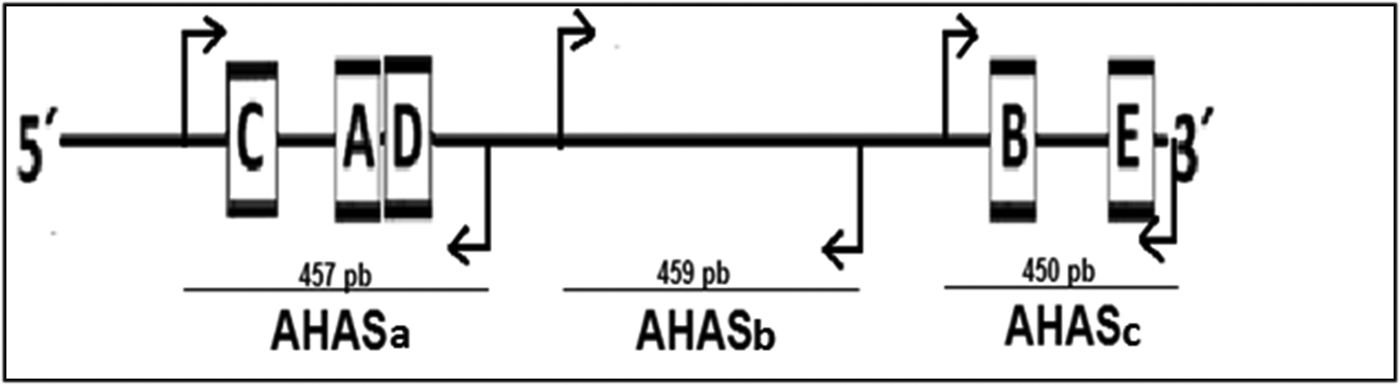
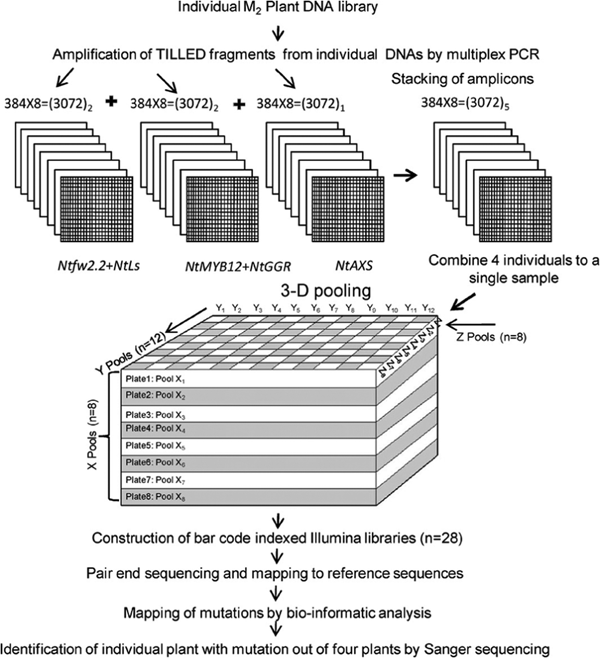
Because the size of the two copies of the gene exceeds 1000 bp and the amplicons to be sequenced did not exceed 460 bp in length, three distinct gene fragments of the selected plants were amplified from the M2 generation: AHASa (region C, A and D within the α domain) (Forward 5′AGAAAAGGCTGTGATGTCCT3′ and Reverse 5′GTCCAGGCCTACCAGAATTA3′), AHASb (intermediate region β domain) (Forward 5′TGGGTGTTTGAATTCTRGTGA3′ and Reverse 5′GCCTCMCCAAASGTCTTAAA3′) and AHASc (region B in the γ domain and region E in the C-terminal region) (Forward 5′AATGCTCTTAAACAATCAACATT3′ and Reverse 5′ATCATAGTAGTAGCAAGCAGCA3′) (Fig. 1). The search for point mutations was performed using NGS. Specifically, an Illumina Genome Analyzer and a three-dimensional overlapping pooling strategy were used (Reddy et al., Reference Reddy, Dwivedi and Sharma2012). In order to maximize the sample distribution in the 3D strategy, the test consisted of four plates (X), four columns (Y) and four rows (Z) (Fig. 2).
Schematic representation of the sequence of the AHAS gene, and location of the primers of each of the amplified fragments. The boxes show the conserved domains of the protein.

Schematic representation of TILLING by sequencing using tri-dimensional overlapping pooling strategy (Reddy et al., Reference Reddy, Dwivedi and Sharma2012).

Mixtures of Illumina libraries were made using the 16S Metagenomic Sequencing Library Preparation protocol (Illumina, 2013). The libraries were labelled with different index specifics, used to identify if the readings obtained from the sequencing belong to the different samples tested. Twelve libraries (four plates × four rows × four columns, XYZ axes, respectively) were prepared. The library preparation followed the manufacturer's instructions for sequencing on an Illumina MiSeq (Illumina, San Diego, CA, USA). In summary, the libraries were mixed and pooled in an equimolar ratio, then the pool was denatured with 1 N sodium hydroxide (NaOH). The pooled library was brought to a final concentration of 12 picomolar (pM) and mixed with 15% PhiX (an adapter-ligated library used as a control for Illumina sequencing runs) as a sequencing control. Finally, 600 ml of this pool was sequenced in the Illumina MiSeq at the AUSTRAL-omics Sequencing Core Facility of the Faculty of Sciences of the Austral University of Chile. Finally, the bioinformatics analysis followed procedures described by Rigola et al. (Reference Rigola, van Oeveren, Janssen, Bonné, Schneiders, van der Poel, van Orsouw, Hogers, de Both and van Eijk2009), Reddy et al. (Reference Reddy, Dwivedi and Sharma2012) and King et al. (Reference King, Bird, Ramirez-Gonzalez, Coghill, Patil, Hassani-Pak, Uauy and Phillips2015).
Mapping mutations
The bioinformatics tool Codons Optimized to Discover Deleterious Lesions (CODDLE) was used to predict possible mutations resulting from the EMS treatments (Yu and Powles, Reference Yu and Powles2014). This web program analyses DNA sequences to assess any changes in the genes of the mutant population (Gilchrist and Haughn, Reference Gilchrist and Haughn2005). CODDLE was used to detect variants of the readings obtained from the Illumina sequencer and the analysis was performed in sequential steps. Raw sequences were ordered according to the 12 barcodes of the sequenced libraries and then were aligned to the Regalona (wild type) library comparing the gene regions of AHAS1a, AHAS2a, AHAS1b, AHAS2b, AHAS1c and AHAS2c. Numbers 1 and 2 are the functional copies of the gene and a, b and c are the amplicons, formed from the division of each fragment for sequencing (Fig. 1).
The adapters were eliminated from both sides of the sequences and then the remaining complete sequences were aligned by minimizing empty spaces. Subsequently, the computer software SAMtools (Li et al., Reference Li, Handsaker, Wysoker, Fennell, Ruan, Homer, Marth, Abecasis and Durbin2009) was used to convert the Sequence Alignment Map (SAM) files into Binary Alignment Map (BAM) files. Additionally, the data were filtered according to the following criteria to avoid false positives in the search for mutations: (1) the EMS-generated mutations are predominantly transitions from C→T and G→A, therefore only such changes were considered and (2) the percentage of difference among the libraries was set at 1.5%. This value was determined based on the arbitrary assumption that there is at least one heterozygous mutation per pool.
In silico analysis and verification of the mutant allele
An in silico study of each amplicon was performed using the programs Integrative Genomics Viewer (IGV; Thorvaldsdottir et al., Reference Thorvaldsdottir, Robinson and Mesirov2013) and Tablet (Milne et al., Reference Milne, Bayer, Cardle, Shaw, Stephen, Wright and Marshall2010). In addition to this bioinformatics analysis, selected samples were verified using Sanger sequencing. DNA samples from individual candidates corresponding to the XYZ intersection were again sequenced using the same primers and PCR conditions that were used to generate the fragments for the NGS. The effect of the mutations was evaluated using the software Protein Homology Recognition Engine (PHYRE2) developed by Kelley and Sternberg (Reference Kelley and Sternberg2009) and Hydrophobic cluster analysis (Gaboriaud et al., Reference Gaboriaud, Bissery, Benchetrit and Mornon1987). The severity of the mutations was analysed using Sorting Intolerant from Tolerant (SIFT; Ng and Henikoff, Reference Ng and Henikoff2003). Field validation of the mutant phenotype was conducted at the Agricultural Experiment Station Austral (E.E.A.A) of the Universidad Austral de Chile (UACh). The test was evaluated by applying commercial products containing only sulfonylureas (metsulfuron-methyl) as the active ingredient (5 g a.i/ha).
Results
Establishment of the induction protocol
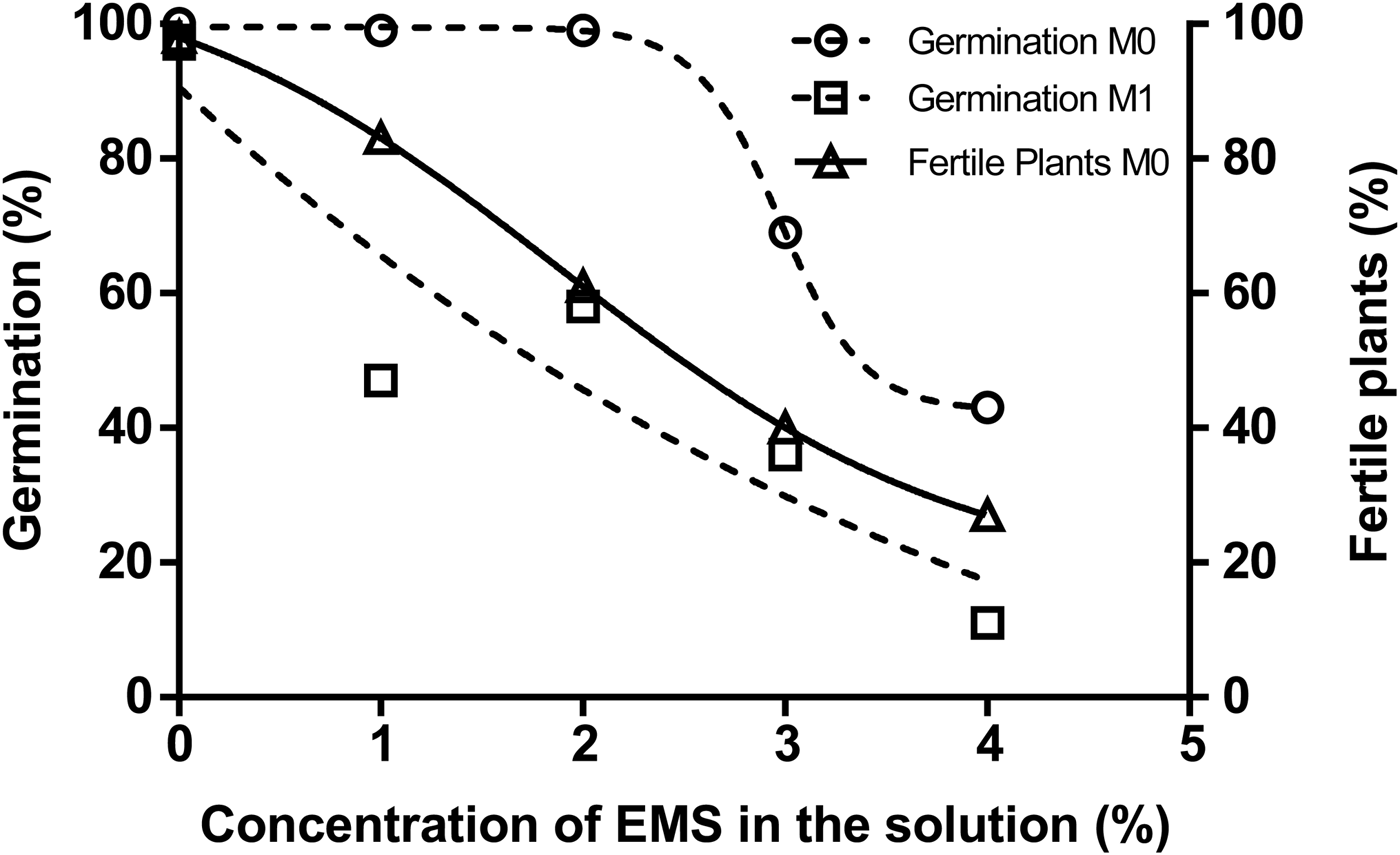
An analysis of variance was conducted for all variables and showed statistically significant differences (P < 0.01) among the EMS treatments. The percentages of M0 plants that germinated were 99, 99, 69 and 43%, respectively, for 1, 2, 3 and 4% EMS solutions. Moreover, the percentages of M0 plants harvested, from the lowest to the highest EMS dosage, were 47, 60, 39 and 11%, indicating that not all plants that germinated were able to produce seeds. Finally, in assessing the M1 generation, germination percentages were 83, 60, 39 and 27% in order of increasing EMS dosage; this result was used to establish the ‘kill curve’ (Fig. 3). The phenotypes observed included undamaged panicles of viable plants, plants without panicles sterile plants with full panicles.
Establishment of the ‘kill curve’ after the induction of mutations with different concentrations of EMS in quinoa.

Mutation frequency
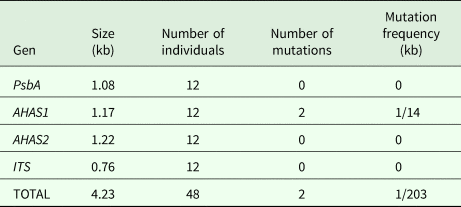
An EMS dose of 2% was chosen, given that it generated a good percentage of germination and fertile plants in the M0 generation. This dosage was then used to develop the library of 3000 TILLING mutant lines. The results obtained from the established mutant population (Table 1) indicated that treatment with 2% EMS yielded a mutation frequency of one mutation every 203 kilobases.
Determination of the frequency of mutations in quinoa using 2% EMS

The use of CODDLE allowed determination of where and what mutations could be subject to G→A and C→T transitions in the AHAS sequences. With CODDLE, ten sites were identified as possibly being subject to mutations due to the use of EMS for a total or 24 mutations that could potentially result in resistance to herbicides.
Illumina sequencing and identification of mutations
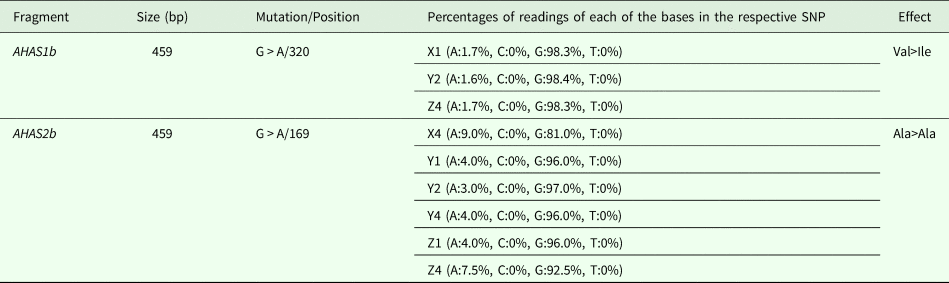
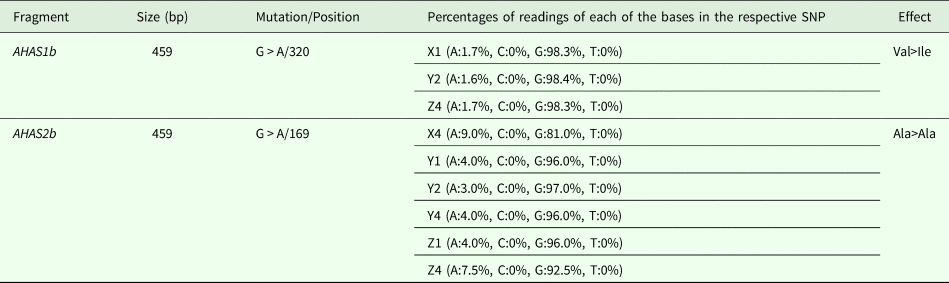
A total of 37 604 readings were generated for the AHAS fragments. In these fragments, after the bioinformatics analysis and using the three-dimensional distribution scheme, it was possible to identify two mutations related to the EMS treatments were identified (replacing G→A). Based on the selection criteria outlined in the method, only the AHAS1b and AHAS2b fragments had potential mutations.
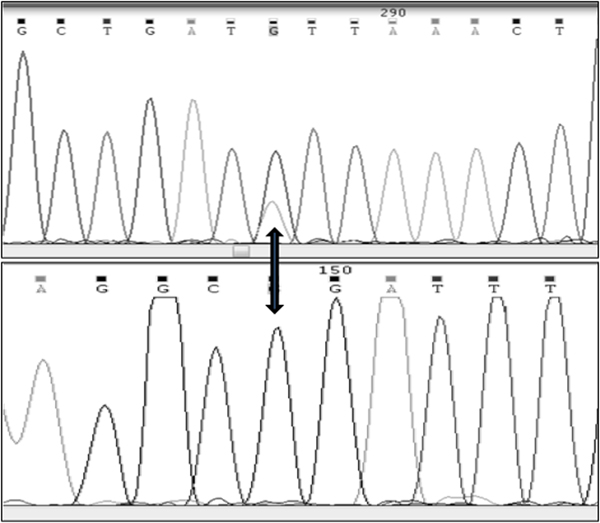
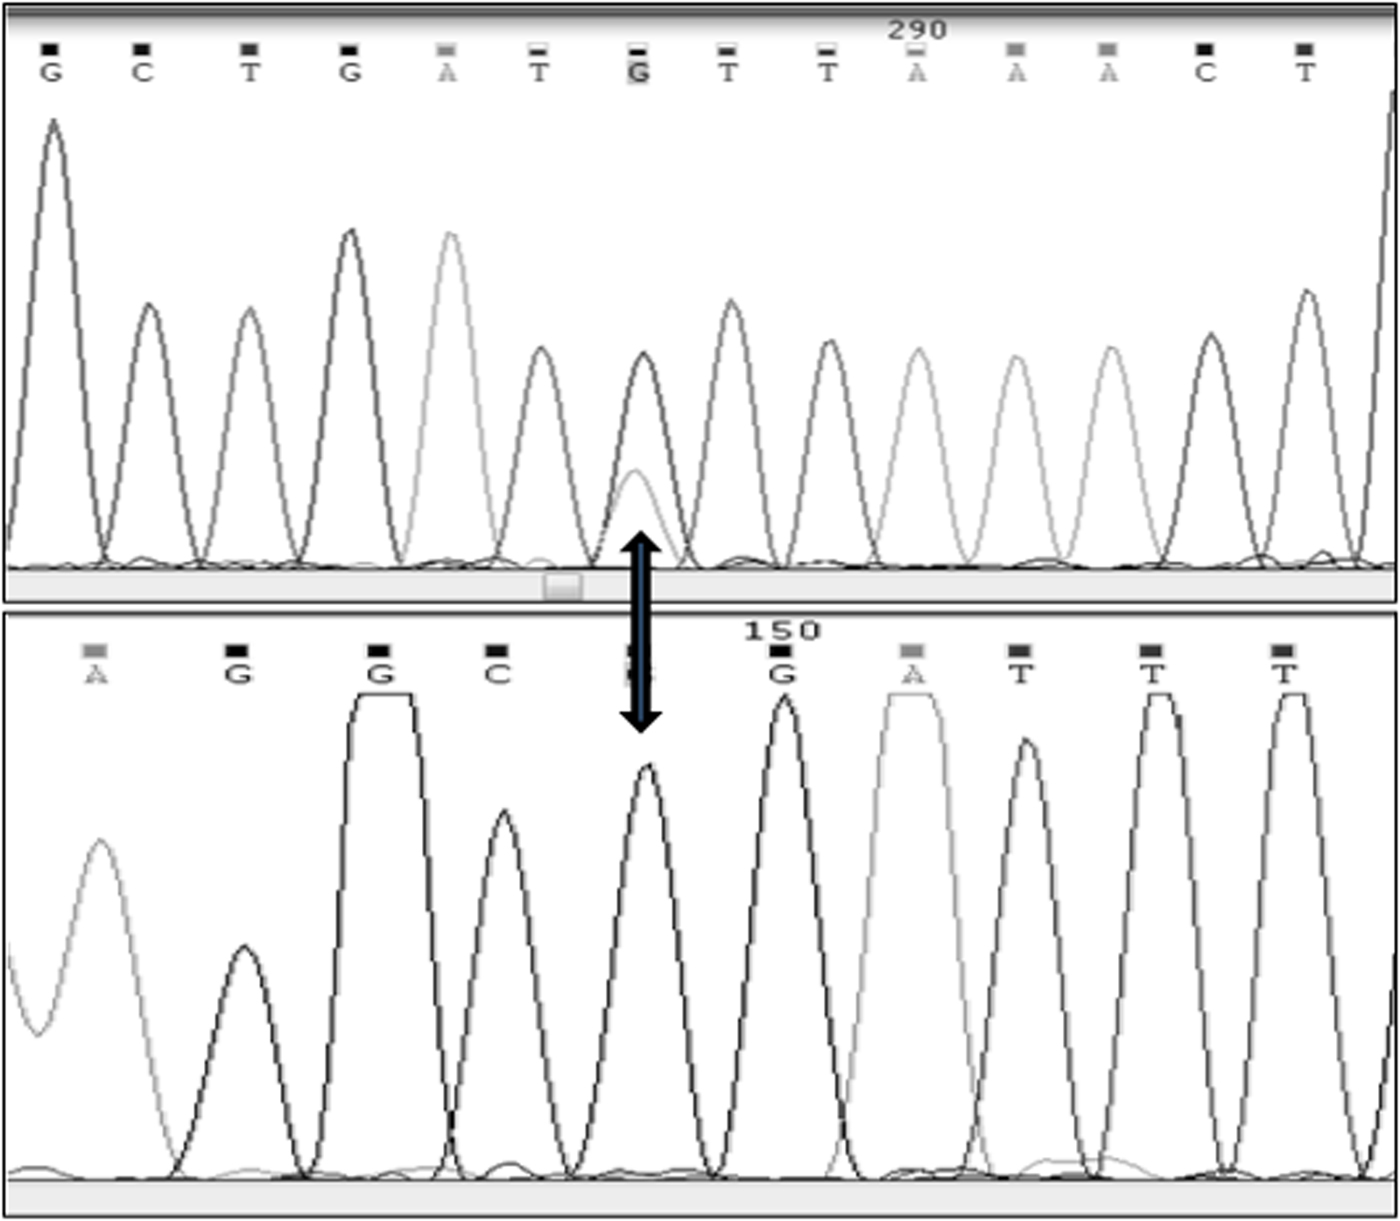
The AHAS1b fragment corresponding to pool 14 consisting of plants 27 and 28 of the TILLING collection presented a potential mutation. Individual analysis was performed using Sanger sequencing in both directions for each sequence/well confirming that plant 27 has a single G mutation, whereas plant 28 has both mutations, G and A. This indicates that the locus is heterozygous. This transition from G→A generates an amino acid change from Val→Ile (Table 2, Fig. 4). The AHAS2b fragment that was identified in several coordinates was also sequenced individually and did not show the presence of a G→A transition.
Verification of sequence variations using ABI sequencer. Upper, AHAS1b (G > A) (heterozygote in copy 1, fragment b), lower, AHAS2b (G) (homozygous in copy 2, fragment b). Arrow shows the presence of double peaks indicative of SNP G > A at same position.
Summary of mutations identified in mutated AHAS genes according to the G > A transition and allelic fraction of 1.5%
Validation of mutated phenotype
In all 12 libraries, sites exceeding 1.5% difference compared to expected sequences were not considered. The only sites found with differences were related to differences between the gene copies. While the mutation in the AHAS2b fragment generates a Val→Ile amino acid change, this alteration does not confer changes to the protein according to the Mobyle-Portal analysis of hydrophobic clusters. In terms of the secondary structure of the protein, the PHYRE2 analysis indicated that there is little difference in the conformation of the β chain, with a change of only 13–12%. However, the SIFT results indicated that a V to I substitution at position 411 of the total protein would affect the protein function (P < 0.001). However, a field application of metsulfuron-methyl on mutant line 28 was analysed, to validate the Val→Ile mutation; this application definitely did not generate a resistant phenotype, as all of the plants died after herbicide application.
Discussion
Plant breeding is an important component to address pressures on global food security and nutrition (Grassini et al., Reference Grassini, Eskridge and Cassman2013). The availability of heritable variation is a prerequisite for genetic improvement of crops. Where sufficient variation does not exist naturally, it can be created through either random or targeted processes (Shu et al., Reference Shu, Forster and Nakagawa2012). The choice of which type of mutagen to use for mutation breeding is often based on past successes reported for the species and other considerations such as the availability of mutagens, costs and infrastructure (Jankowicz-Cieslak et al., Reference Jankowicz-Cieslak, Tai, Kumlehn and Till2017). In this context, there are no data available of mutagenesis experiments for species of the genus Chenopodium (FAO/IAEA, 2017).
Currently, mutagenesis studies on species with the closest phylogenetic relationships to quinoa only include B. vulgaris (Hohmann et al., Reference Hohmann, Jacobs and Jung2005); these species belong to the same sub-family chenopodioideae. The results obtained in the current study show that the use of a 2% EMS solution yielded the best results in terms of the combination of minimal physiological effects, acceptable rates of sterility and mutation rate (1/203 kb). Creating a mutant population it is the first prerequisite for conducting the TILLING technique approach to reverse genetics (Kumar et al., Reference Kumar, McKeown, Boualem, Ryder, Brychkova, Bendahmane, Sarkar, Chatterjee and Spillane2017).
Germination percentage is the first and foremost variable to be analysed in establishing TILLING protocols. This variable is related directly to the concentration of EMS applied, the size of seeds used in the study and the duration of the chemical incubation (Reddy et al., Reference Reddy, Dwivedi and Sharma2012). The results of the current and previous studies confirm that germination is progressively reduced as the concentration of EMS increases (Ramya et al., Reference Ramya, Nallathambi and Ram2014). Hohmann et al. (Reference Hohmann, Jacobs and Jung2005) describe that high concentrations of EMS and long exposure times result in drastic reductions in survival rates (germination and fertility) in M1 plants, as well as reduced rates of germination in M2 plants: this can be seen in the current results obtained with the treatment of 4% EMS. Analysing this parameter allowed acceptable levels of germination and seed production to be established for the different generations. However, undesirable phenotypes could result in future generations due to the random distribution of mutations throughout the genome (Comai and Henikoff, Reference Comai and Henikoff2006). For B. vulgaris, treatment with 0.5% EMS for 8 h did not generate mutant phenotypes, while 1% EMS for 8 h produced mutant phenotypes (Hohmann et al., Reference Hohmann, Jacobs and Jung2005). These results for B. vulgaris and the results provided here for quinoa indicate that protocols must be established for each species individually. However, the B. vulgaris germination and fertility results are very similar to those obtained for quinoa. Treatment with low concentrations of EMS has shown to simplify the identification of mutant phenotypes and to limit lethal genotypes (Rosenbluth et al., Reference Rosenbluth, Cuddeford and Baillie1983). Several aberrant or undesirable phenotypes were observed in the establishment phase; however, these were found mainly in the M0 generation and the undesired phenotypes – plant sterility and semi-sterile panicles – were only found in the M1 generation.
Ethyl methane sulfonate treatments should be optimized to produce relatively acceptable levels of mutation rates and sterility in the M0, M1 and M2 generations (Till et al., Reference Till, Reynolds, Greene, Codomo, Enns, Johnson, Burtner, Odden, Young, Taylor, Henikoff, Comai and Henikoff2003). Successful mutagenesis can be measured by the presence of phenotypic variants in the M2 generation. The estimated overall mutation rate found in the current study was one mutation every 203 kilobases. This density of induced mutations should be considered adequate considering that acceptable treatments for other species yielded similar rates of mutations. Specifically, a density of two mutations per megabase was found for maize (Till et al., Reference Till, Reynolds, Weil, Springer, Burtner, Young, Bowers, Codomo, Enns, Odden, Greene, Comai and Henikoff2004) whereas in Arabidopsis (Greene et al., Reference Greene, Codomo, Taylor, Henikoff, Till, Reynolds, Enns, Burtner, Johnson, Odden, Comai and Henikoff2003) and rice (Till et al., Reference Till, Cooper, Tai, Colowit, Greene, Henikoff and Comai2007) a rate of one mutation per 300 kb was reported. Given the ploidy level of C. quinoa, 2n = 4x = 36, and the genome size of 1.39 Gb (Jarvis et al., Reference Jarvis, Ho, Lightfoot, Schmöckel, Li, Borm, Ohyanagi, Mineta, Michell, Saber, Kharbatia, Rupper, Sharp, Dally, Boughton, Woo, Gao, Schijlen, Guo, Momin, Negrão, Al-Babili, Gehring, Roessner, Jung, Murphy, Arold, Gojobori, van der Linden, Van Loo, Jellen, Maughan and Tester2017), the rate of mutation, 1/203 kb, obtained in the current study would probably achieve approximately 6847 mutations throughout the whole genome of quinoa.
Despite the high capacity to generate mutations in the genome, it is thought that the polyploidy of quinoa allows it to remain viable despite a high level of mutation (Martín et al., Reference Martín, Ramiro, Martínez-Zapater and Alonso-Blanco2009) and the genome's coding capacity determines the phenotypically effective mutational target (Addo-Quaye et al., Reference Addo-Quaye, Buescher, Best, Chaikam, Baxter and Dilkes2017). These criteria should be considered when new quinoa mutagenesis protocols are developed. A high number of putative mutations in the genome could be considered a disadvantage, since a greater number of backcrosses would be needed to reduce the total number of unwanted mutations and to identify potentially related genes to a particular phenotype.
TILLING is an efficient reverse genetics approach for detecting induced mutations in pools of individuals. Combined with the NGS technologies, and the resolving power of overlapping pool design, TILLING provides an efficient and economical platform for functional genomics across thousands of organisms (Addo-Quaye et al., Reference Addo-Quaye, Buescher, Best, Chaikam, Baxter and Dilkes2017), independently of the genome size, ploidy and reproductive system of plants (Rashid et al., Reference Rashid, He, Guanxiao and Khurram2011). Although TILLING is most powerful when applied to crops for which whole-genome sequences are available, it can be applied to target genes in any crop, provided that the sequence of the target gene itself is known in the target genome (Kumar et al., Reference Kumar, McKeown, Boualem, Ryder, Brychkova, Bendahmane, Sarkar, Chatterjee and Spillane2017). In the current work, the use of Illumina sequencing and single nucleotide polymorphism (SNP) analysis of multidimensional mixtures of different amplicons yielded positive results, proving to be an efficient method for detection of mutations with these techniques (Pan et al., Reference Pan, Shah, Phelps, Doherty, Johnson and Moens2015). The three-dimensional sequencing strategy (4 × 4 × 4), detailed by Tsai et al. (Reference Tsai, Ngo, Lieberman, Missirian, Comai, Alonso and Stepanova2015), allowed identification of wells with at least two alleles. Similar strategies have been used in other polyploid crops such as tobacco (Reddy et al., Reference Reddy, Dwivedi and Sharma2012) and the autotetraploidized Arabidopsis (Tsai et al., Reference Tsai, Missirian, Ngo, Tran, Chan, Sundaresan and Comai2013). One of the main reasons why this technique is useful is that it is possible to identify mutant individuals within amplicon and plant mixtures. However, all plants must be placed in the same number within each library (Tsai et al., Reference Tsai, Missirian, Ngo, Tran, Chan, Sundaresan and Comai2013) and 3D conformation must also be symmetrical (equal number of plates, rows and columns) (Chi et al., Reference Chi, Zhang, Xue, Feng, Liu, Wang and Qi2014).
Only the mutation found in the position G→A/320 of fragment AHAS1b, corresponding to nucleotide 1231 of the complete sequence of the AHAS1 copy (codon GGT→ATT) generated an amino acid change of Val to Ile. This mutation was confirmed by Sanger sequencing as being bi-allelic. The Val to Ile amino acid change does not alter the distribution of the hydrophobic cluster, since both amino acids belong to the non-polar group. Despite this, analysis of the secondary structure of the protein indicated a ‘putative’ modification in the β chain conformation. This modification may be based on the Val411 position of the protein AHAS in quinoa. The Val411 position is part of the β domain (residues 281–451) (Guttieri et al., Reference Guttieri, Eberlein, Mallory-Smith, Thill and Hoffman1992), in which a change of amino acid belonging to the same family could change the structure and possibly the function of the protein. Other studies have detected effects on phenotypes resulting from similar changes in amino acid analogues (Yu and Powles, Reference Yu and Powles2014). For example, it has been shown that changing methionine at the Val-196 site produces resistance to sulfonylurea herbicides. A great number of mutations conferring resistance have also been described for other non-polar amino acids such as Ala-122, Pro-197 and Tpr-574 (amino acid number is standardized to the Arabidopsis thaliana sequence) (Tranel and Wright, Reference Tranel and Wright2002).
For the detected mutation in AHAS2b, failure to detect the G→A variant by Sanger sequencing could be linked to quinoa's allotetraploidy or to an artefact of the reading mapping process. The presence of homologous genes and homologues make the homogeneous amplification of a single amplicon very difficult using PCR. As described by Mestanza et al. (Reference Mestanza, Riegel, Silva and Vásquez2015), quinoa has at least six variants of the AHAS gene.
The Sanger sequencing method for detecting variants is justified because it should be possible to detect the AHAS1b variant by a distinctive heterozygous double peak. On the other hand, for the AHAS2b variant, the likely amplification of multiple copies (four copies), the difference generated within and among homologous pairs would not be able to be determined by Sanger sequencing, and instead, the most numerous variants would probably be favoured. If more than one copy is amplified with the same set of primers, direct sequencing yields double peaks at sites that differ within and between the copies (Griffin et al., Reference Griffin, Robin and Hoffmann2011).
In recent years, NGS has eliminated these disadvantages of Sanger sequencing. With NGS, one can analyse sequences with multiple gene copies, multiple genes and several individuals in a single run (Griffin et al., Reference Griffin, Robin and Hoffmann2011). The use of restriction enzymes could help to discern the presence or absence of the mutation described here, since it is a widely used method for the genotyping of SNPs (Chuang et al., Reference Chuang, Yang, Tsui, Cheng, Chang, Wen and Chang2008).
Finally, the AHAS2b mutation (codon GTT→ATT), which generated a Val to Ile amino acid change, did not generate the expected effect on the phenotype since all the plants died after the herbicide was applied. This may be because Val411 is part of the β domain (residues 281–451), or structural part of the protein, but is not part of the five highly conserved regions of the AHAS gene in which the active sites of the protein bind to the herbicide (Guttieri et al., Reference Guttieri, Eberlein, Mallory-Smith, Thill and Hoffman1992).
Quinoa is a species that has great genetic variability around the world, so it has a source of important variability. However, chemically induced mutants, mainly by EMS, currently have a transcendental role because they allow availability of selected populations and the possibility of identifying new genes (Dierking and Bilyeu, Reference Dierking and Bilyeu2009). Possessing a TILLING library in quinoa will allow future work to characterize other genes of agronomic interest (e.g. resistance to drought, salinity and saponin content), or in turn, as is already known, the dose of EMS that is most suitable for the induction of mutations is feasible to generate a new and larger mutant population. Searching for or generating mutant lines resistant to herbicides in quinoa remains a challenge that must be overcome for large-scale production. Weeds are recognized as one of the main limitations to the expansion of quinoa (Jacobsen et al., Reference Jacobsen, Christiansen and Rasmussen2010), because they are closely related to weed species and selective herbicides have not yet been found for use in quinoa cultivation.
Author ORCIDs
Camilo Mestanza, 0000-0001-9299-170X; Santiago C. Vásquez, 0000-0002-3713-020X; Diana Veliz, 0000-0003-2039-8741; Nicolás Cruz-Rosero, 0000-0002-5793-9380; Hayron Canchignia, 0000-0003-1195-5446; Herman Silva, 0000-0003-1007-7442.
Acknowledgements
We also thank Karen Betancourt Ludeña for her review of the British English language.
Financial support
The authors would like to thank Secretaría de Educación Superior, Ciencia, Tecnología e Innovación (SENESCYT-Ecuador) and the Graduate School and Faculty of Agricultural Sciences of Austral University of Chile. This thesis project is associated with CONICYT Fellowship 7813110011.
Conflict of interest
None.
Ethical standards
Not applicable.