

Introduction
One particularly stark manifestation of poverty is household food insecurity, defined in high-income countries as ‘the uncertainty and insufficiency of food availability and access that are limited by resource constraints, and the worry or anxiety and hunger that may result from it’ (Wunderlich and Norwood, Reference Wunderlich and Norwood2006). Food insecurity, like poverty, exists in all high-income countries and, while estimates vary between contexts (FAO, 2019; Garratt, Reference Garratt2019)Footnote 1, the rates of food insecurity have gone up in some countries in recent years. The Great Recession, which led to stagnating wages and rising food prices, explains some of this increase (Reeves et al., Reference Reeves, Loopstra and Stuckler2017), especially in countries such as Greece, Italy, and Latvia, where the prevalence of food insecurity rose after 2007 and then peaked in 2011 or 2012 (European Commission, 2019).
Rising food insecurity in Europe was not solely rooted in the economic crisis, however (Loopstra et al., Reference Loopstra, Reeves and Stuckler2015). In some places, it only began to increase after 2010, once austerity policies aimed at reducing government spending on social security systems were implemented (Hills, Reference Hills2014). These reforms reflect a broader shift in the logic of welfare states over the last 40 years: reducing public expenditure by making the conditions of social security entitlements more demanding and by cutting the generosity of financial support (Timmins, Reference Timmins2017; Pierson, Reference Pierson1994). While the particular instantiations of this underlying logic of welfare are quite diverse, when countries reduce the generosity and the universality of social security systems, they strip away policies that would have made them relatively immune to rising food insecurity during periods of macroeconomic fluctuation (Loopstra et al., Reference Loopstra, Reeves, McKee and Stuckler2016).
The UK potentially fits this story too. The end of the recession, for example, did not coincide with a reduction in food bank usage (Loopstra et al., Reference Loopstra, Fledderjohann, Reeves and Stuckler2018), and, in spite of economic recovery, it has continued to climb over the past five years, rising by 73% since 2014 (The Trussell Trust, 2019). Indeed, over this same period, the UK Government implemented numerous welfare reforms, many of which bore the hallmarks of this new logic of social security (Taylor-Gooby and Stoker, Reference Taylor-Gooby and Stoker2011). The rhetorical frames used to justify welfare reform in the 1990s re-entered the political discourse in the wake of the Great Recession (McArthur and Reeves, Reference McArthur and Reeves2019) and were particularly prominent in the UK government’s 2010 Spending Review. ‘Universal Credit’ (UC), which was rolled-out in earnest from 2014 onwards, was the epitome of these efforts (Timmins, Reference Timmins2016).
This paper seeks to empirically assess whether rises in food bank usage are associated with the introduction and roll-out of Universal Credit, which, we argue, has a number of features that may increase the risk of economic hardship for some claimants. Using Trussell Trust data on food parcel distribution alongside a range of official statistics, we find that, when the UC caseload rises from one month to the next, the number of food parcels being distributed goes up too. This relationship is not constant across the UK, however. In places without a readily accessible food bank, putting more people on UC has a far smaller influence on the number of food parcels that are given out. This does not mean, we take it, that UC fails to produce deprivation in areas without food banks; rather it seems that, in these place, UC is in fact creating hidden hunger. We also explore the switch to Full-Service UC, testing whether this exacerbates or minimises the association with food bank use, finding that introducing Full Service appears to be independently related to higher food bank usage. Our results speak to broader debates about how social security is structured and how reforms which seek to activate both the employed and the unemployed may leave some worse off.
How Universal Credit altered social security
Drawing on the same logic informing welfare reform policies elsewhere (Kenworthy, Reference Kenworthy2010), UC has been designed to reduce welfare dependency and ensure people are financially better off when employed rather than on social security (Hills, Reference Hills2014). UC expands welfare conditionality and benefit sanctions to incentivise people to improve their financial situation. Conditionality was previously reserved for those described as ‘trapped’ in the benefit system (e.g., out-of-work benefits) (Dwyer and Wright, Reference Dwyer and Wright2014). Under UC, conditionalities apply to some people in-work and eligible for housing benefit or working- or child-tax credits (Hills, Reference Hills2014; Timmins, Reference Timmins2017). Another major change introduced with UC is that payments are made in arrears. This model is intended to mirror the world of work, where a majority of people receive their first pay cheque after a month or more of employment (Millar and Bennett, Reference Millar and Bennett2017). Until February 2018, the design involved a six-week wait for a benefit payment to be made. This ‘assessment period’ included a seven-day spell when the person was not eligible for UC, one month during which claimants’ incomes were assessed, and another seven days for processing the claim payment. From February 2018, this waiting period was reduced to five weeks, but has not been further reduced.
UC also innovates in important ways. It creates a new infrastructure for social security by combining out-of-work support, housing benefits, and tax credits into one system (Timmins, Reference Timmins2016; DWP, 2010). Combining these benefits into a single application and payment system is intended to enable people to move between out-of-work and in-work benefits more smoothly, reducing the risk of experiencing financial loss due to ‘churn’ into and out of the social security system as people’s circumstances change (Hills, Reference Hills2014). UC is also ‘digital-by-default’, what is called Full Service (Dwyer and Wright, Reference Dwyer and Wright2014), allowing people to make a claim without travelling to a centralized site.
There has been a great deal of debate concerning the potential outcomes of UC. Some argue UC’s labour activation components may have had positive effects on employment (Griggs and Evans, Reference Griggs and Evans2010; DWP, 2018), as labour activation programmes have been shown to do this elsewhere (Griggs and Evans, Reference Griggs and Evans2010). But a major qualitative longitudinal study based in the UK found that welfare conditionality, and in turn sanctions, are not effective at facilitating employment or in-work progression (Welfare Conditionality, 2018). In some cases, sanctions may be deducted from Housing and Child elements of UC payments, which could not happen under the separated benefit system (Webster, Reference Webster2019).
Digitalizing the service may also exclude those who lack IT skills and may actually make it harder for some to submit claims (NAO, 2018). Assessment of the roll-out of the Full Service version of UC has shown that 98% of claimants were able to register their claim online (Foster et al., Reference Foster, Adams, Svabaes, O’Driscoll and Thomson2018); however, this potentially misses the many who started the process but never finished. Even among these successful claimants, around 43% said they needed more support registering their claim (Foster et al., Reference Foster, Adams, Svabaes, O’Driscoll and Thomson2018). But by streamlining the application procedure and automatically signing recipients up for any entitlements, there may be higher benefit uptake than the previous, disjointed benefit system.
The waiting period for a first UC payment, though mirroring the world of work, may lead to financial hardship and debt for those who do not have financial savings. Government data suggest such policies are inducing financial hardship and causing many claimants to take out advance payments to carry them through to the first payment, resulting in debt (NAO, 2018; Foster et al., Reference Foster, Adams, Stewart, Pinakova and Newbold2017).
Lastly, financial outcomes of UC are also mixed, as levels of entitlements have changed for some claimants under UC. Some will see higher payment levels under UC (Brewer et al., Reference Brewer, Joyce, Waters and Woods2019). But, UC will reduce entitlements for a significant number of benefit claimants, with around 3 million people seeing their incomes fall, many of whom are already living in poverty (Barnard, Reference Barnard2019).
Why Universal Credit may increase food insecurity
Given both the negative and positive aspects of the new UC system, there is considerable debate about what impact UC is having on households’ ability to meet their basic needs, including their ability to afford food (Jitendra et al., Reference Jitendra, Thorogood and Hadfield-Spoor2018; Watts and Fitzpatrick, Reference Watts and Fitzpatrick2018). The claimants that benefit from higher welfare payment entitlements and from moving into higher paid employment, might be at lower risk of food insecurity. However, these positive outcomes may not offset some of the immediate, and potentially prolonged, harms of the claiming process or conditionality. For example, receiving no income through the waiting period may increase risk of food insecurity, as previous research suggests that short-term monthly income shocks are associated with periods of food insecurity (Leete and Bania, Reference Leete and Bania2010). Alternatively, if advance payments are accessed, debt repayments may leave households financially worse off once UC payments start, as these are automatically deducted. Both of these issues risk increasing food insecurity and food bank usage, one with immediate effect and one in the longer term.
The extension and intensification of sanctions to a broader segment of the low-income, claimant population could also lead to food insecurity. Evidence suggests that when benefit claimants are sanctioned, they are often left without sufficient financial support to meet basic needs and need to rely on informal means of providing for themselves and their families (Garthwaite, Reference Garthwaite2016; Watts and Fitzpatrick, Reference Watts and Fitzpatrick2018; Fitzpatrick et al., Reference Fitzpatrick, Bramley and Sosenko2018), such as food banks (Loopstra et al., Reference Loopstra, Fledderjohann, Reeves and Stuckler2018).Footnote 2 If sanctions do leave claimants without sufficient resources, as mentioned above, they can claim a hardship payment. UC, however, has now made these hardship payments repayable, with repayment required at a rate of 40% of benefit payment.
Thus, there is real risk that UC is contributing to financial hardship, and in turn, food insecurity among benefit claimants. Food insecurity rose among low-income households generally since 2004 (Loopstra et al., Reference Loopstra, Reeves and Tarasuk2019), and preliminary evidence suggests the introduction of UC has been linked to rising food bank use (Jitendra et al., Reference Jitendra, Thorogood and Hadfield-Spoor2017). While suggestive, there are reasons to be cautious about accepting this early evidence. Earlier analyses have not, for example, linked UC claimant data to food bank usage data to study the dynamic relationship between UC uptake and food bank use, nor have they considered temporal effects related to initial implementation, longer term hardship, or Full Service rollout. These are all crucial dimensions of the roll-out of UC which may alter the implications for food bank usage.
In this study, we use the roll-out of UC in the UK to explore how restructuring welfare in this way may affect food bank usage. Food bank use is a critical indicator of financial hardship, as households using food banks have frequently been found to be severely food insecure and unable to meet their basic needs, including food, utility and housing costs (Clair et al., Reference Clair, Fledderjohann, Lalor and Loopstra2019). We consider whether the net-effect of UC – namely, increased conditionality, harsher penalties, and payment in arrears, but also efforts to reduce the administrative burden – increases reliance on food banks. We also examine how access to food banks may modify this relationship and if the roll-out of Full Service has had an impact over and above the UC caseload. To address these questions, we accessed the administrative database from the largest food bank network in the UK, The Trussell Trust, combining their data on the monthly volume of food bank use over 2015 to 2017 with data on the monthly caseload and take-up of UC across postcode areas throughout Britain over this same period.
Data and method
Data on food bank use are from The Trussell Trust’s food bank network, the largest network of food banks in the UK. Member food banks in this network make up about 60% of food banks that operate in the UK, and collect data using a harmonised method, which are then uploaded and held centrally by The Trussell Trust. In general, food banks that are part of The Trussell Trust also operate according to a common set of procedures (Trussell Trust, 2020), including requiring that people have a referral from a frontline care professional agency, such as Citizens Advice Bureau, social services, or GP office, and providing three-days worth of food in the food parcel that is provided when referral vouchers are redeemed.
Food bank usage has been rising across the network over the last few years, rising by 73% since 2014 (The Trussell Trust, 2019). The Trussell Trust provided data on the monthly total number parcels of food distributed to households by postcode district covering 2015 to 2017. More than one food parcel could be given to the same household within a given month, but evidence suggests the majority of households do not use a food bank more than twice in a six month period (Garratt, Reference Garratt2017). About 4.6% of food parcels distributed in this time period could not be matched to a postcode district. A total of 2,501 postcode districts contained at least one household that received a food bank parcel over 2015 to 2017, while 504 postcodes did not report foodbank usage.
We accessed data from the Department for Work and Pensions (DWP) on the number of households receiving UC in each postcode district available from Stat X-plore (more details on the roll-out of UC are available in Box 1 and Web Appendix 1, Supplementary Materials). At the time of our analysis, data were last updated on 22nd March 2018, and we matched DWP data to the Trussell Trust data over the same period (from August 2015 to December 2017). These DWP data contain the number of households with an active UC claim. Crucially, the UC count date occurs in the middle of the assessment period. Thus, because UC is paid in arrears, this count covers households currently waiting on a UC payment. There were a total of 2,907 postcode districts which could be matched between the Trussell Trust data and the DWP data included in this analysis, covering households in England, Scotland, and Wales.
The roll-out of Universal Credit
UC has been slowly introduced across the UK, both with respect to areas where it is available and the claimants it is available to. The timeline for the roll-out has been delayed a number of times. To begin with, UC was first piloted in 12 local authority areas over September 2012 to December 2013 (DWP, 2014a). After a delay caused by concerns raised by the Major Projects Authority about UC’s assessment review, the Government started rolling out UC ‘live service’ in April 2013. At this time, only claimants who were single, childless, out-of-work adults without housing costs were eligible – in other words, claims that were simplest to manage. It was only extended to couples and families from April 2016. Live service did not involve online applications; instead, claimants made a claim through their local Jobcentre, as they would have done under legacy benefits. However, live service was only ever intended to be an interim service, while the Full Service was further developed. From January 2018, live service was deactivated. In areas where UC could previously be claimed through live service and where Full Service is not yet active, new claimants can now only claim legacy benefits.
From April 2016, areas began to transition to Full Service and existing live service claimants transferred onto Full Service. Of note is that all claims for UC are for claimants making a new claim. This could be because their financial situation has changed (i.e. unemployment, reduction in wages), because they’ve moved to a new area, or because a partner has moved in or out. Some household types are not eligible to claim due to the complexity of their cases: namely, families with three or more children. The main transition of claimants from legacy benefits onto UC was scheduled to begin in 2020.
The phased roll out of Universal Credit was not random but was implemented according to operational constraints and focused on implementation (DWP, 2014b). In web appendix 1, we provide a series of descriptive statistics showing that the roll-out was initially focused on urban areas (high population) with higher numbers of claimants (as a proportion of the working age population) but which were moderately deprived. This may introduce some bias into our analysis because the increase in the number of UC claimants was initially faster in more deprived areas (see Web Appendix 1, Supplementary Materials). However, in practice, this is unlikely to influence our results because if we look at the speed at which new claimants enter UC by the period in which UC was implemented, we see very similar trends, especially in the first year (see Web Appendix 1, Supplementary Materials).
We excluded data from 200 postcode districts with very small populations (less than 33 people) because these were likely to bias our results by creating large fluctuations. We also excluded non-residential postcodes. Finally, for the main parts of our analysis we only include postcode districts that are currently assigned to Jobcentre Plus administrative office (the centres which administer UC regionally), excluding a further 61 postcode districts. Our results do not vary if these are included in the analysis. The total number of observations included in the dataset was 76,734 referring to postcode district-months over August 2015 to December 2017 covering 2,646 postcode districts.
We also obtained data on the number of food bank distribution centres operated by Trussell Trust food banks. These refer to the physical locations where people can go to redeem their referral for a food parcel. The number of centres operating per postcode district was calculated. At the end of 2017, 1216 Trussell Trust distribution centres were operating in a total of 870 postcode districts, 30% of the sample. These data were only available for December 2017; thus, they could not be included in time-varying analyses, described in more detail below, but were included in mixed models, when fixed area characteristics could be accounted for.
Food bank use is reported as the number of food parcels distributed to households as a percentage of households in the district, and UC claimant rates are reported as percentage of households in the postcode district claiming UC.
Our analytical strategy
We explore four issues using this data to understand how the transition and uptake of UC in postcode districts could relate to food bank use.
First, we evaluate whether the first stage of the UC application process – encompassing the waiting period when claimants are being assessed and waiting to receive payments and also potentially other problems with the application process – is linked to food bank use. Any association between this period and food bank usage is likely to show up in the same month or the month after people come onto UC. We explore this relationship using the following linear regression model, which estimates the association between an increase in UC claimants and food bank usage:
 $${\rm{Voucher}}{{\rm{s}}_{{\rm{it}}}} = \alpha + {\beta _{{1}}}{\rm{U}}{{\rm{C}}_{{\rm{it}}}} + {\beta _{{2}}}{\rm{Claimant}}{{\rm{s}}_{{\rm{it}}}} + {\beta _{{3}}}{\rm{tim}}{{\rm{e}}_{\rm{t}}} + \beta {\rm{mont}}{{\rm{h}}_{\rm{t}}} + {\mu _{\rm{i}}} + {\varepsilon _{{\rm{it}}}}$$
Where i is postcode district and t is month. Vouchers is the proportion of households receiving a food voucher in a postcode district and UC is the proportion of households receiving UC in a given postcode district. We adjust for the proportion of the working-age population receiving Jobseeker’s Allowance or claiming UC for unemployment (i.e. the new “Claimant count” from www.nomisweb.co.uk) (Claimants) at the local authority level to account for the background level of social security dependence, which may be correlated with UC roll-out and food bank usage. Plus, we also include a linear time trend (time) and a seasonality variable (month), which is a series of dummy variables for each month of the year, to account for temporal aspects of both food bank usage and roll-out. µ is the postcode district ‘fixed-effects’, the differences between postcode districts that are constant over time, and ϵ is our error term. The coefficient of interest is β1: if β1 > 0 then an increase in the proportion of households receiving UC is associated with an increase in the proportion of households receiving a food parcel.
Whilst causality may be difficult to estimate in this observational setting, we estimate a number of variants of this model to test the robustness of our estimates. We estimate models with a lagged measure of the increase in UC to capture the effects in the month after their claim and also a model with a lagged measure of the dependent variable: this latter model is equivalent to a Granger causality test.Footnote 3 We also use matching techniques to create a sample that is balanced on the covariates mentioned above and allow us to compare postcode districts which have introduced UC and those that have not. This focusses our analysis on only those postcode districts that are most comparable to each other (see Web Appendix 4 for full details, Supplementary Materials). Consistent results across these specifications gives us more confidence in drawing causal conclusions. Standard errors are estimated at the postcode district level.
Second, we consider whether the association between UC and food bank usage is due to the difficulties of implementing a new system of welfare delivery, which may subsequently decline after UC has been active in an area for a sustained period of time. Here we add an interaction term to equation 1 between UC and a new variable measuring the number of months UC has been active in a postcode district. This interaction term tests whether β1 (the association between an increase in the proportion of households receiving UC and the proportion of households receiving food vouchers) changes if UC has been active in an area for a longer period.
Third, we explore whether the total proportion of households claiming UC is associated with food parcel distribution (over and above the recent increase in the proportion of households claiming UC). Rent arrears and problematic debt have both been identified as longer-term consequences of UC; thus, if UC leaves some households worse off, even after the initial waiting period has ended, we might expect food bank usage to rise with the proportion of households on UC. Here we model the proportion of households receiving a food parcel voucher using a multi-level linear regression model with random intercepts which includes two key predictors: 1) the increase in the proportion of households on UC in the last month and 2) the total proportion of households on UC one month ago. A multi-level approach allows us to include both of these variables but also allows us to simultaneously account for clustering at the level of the Jobcentre Plus Office (which may account for differences in how regional offices manage UC) and the level of the local authority (which may account for local policies that may also influence both UC and food bank usage). It also enables us to control for variables in the data set that do not change over time: namely, the number of food bank distribution centres in the postcode district, which is likely correlated with food bank usage and with the underlying level of material deprivation in an area. We also include an interaction term between the proportion of households on UC and the number of food bank distribution centres in the postcode district to test whether the association between UC and food parcel distribution varies according to the number of food distribution sites.
In the final aspect of the analysis, we test whether roll-out of Full Service UC alters any of the relationships we estimated for the main, direct associations between rolling out UC and food bank parcel distribution. We add a binary indicator to equation 1 indicating whether Full Service is active or not and then add an interaction term between this indicator of active Full Service and the proportion of claimants on UC and whether a food bank distribution centre is present. This model tests whether increases in UC are more closely associated with food parcel distribution in areas where there is an active food bank and where Full Service has been introduced. Again, we estimate a matching model to test the consistency of our results to a more balanced sample (see Web Appendix 5 for full details, Supplementary Materials). All models were estimated in STATA v 15.
Results
Food bank usage has been rising in recent years. In August 2015, at the beginning of our analytic period, the median proportion of households receiving a food parcel across all postcode districts was 0.047% (IQR = 0% – 0.17%). By December 2017, the end of our analytic period, this has risen to 0.10% (IQR = 0% - 0.31%). While many places had no food bank usage at all, some parts of the country had seen large increases. We begin our analysis, then, with a simple question: is this rise in food bank usage in some parts of the country concentrated in areas where more people are claiming UC?
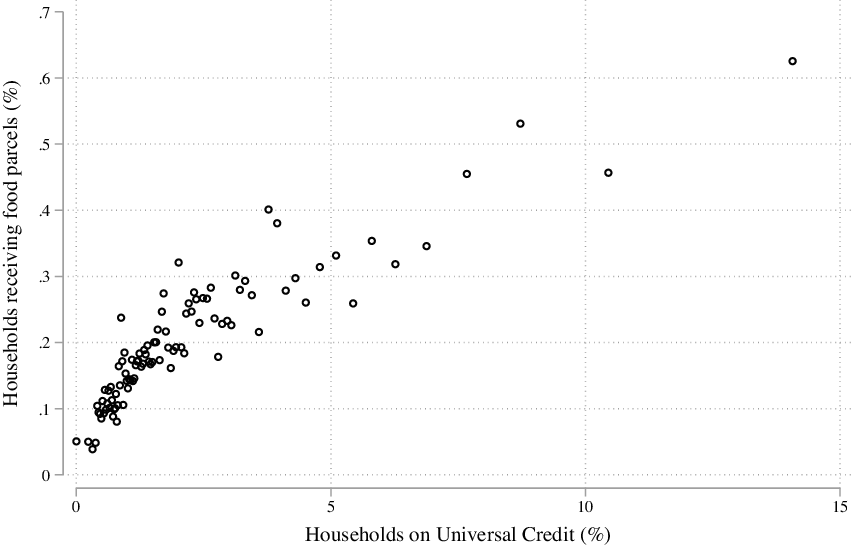
Figure 1 is a binned scatterplot of the proportion of households claiming UC (x-axis) and the proportion of households receiving help from food banks in October and November 2017 (y-axis). On average, there is a clear positive relationship across postcode districts. This correlation could, of course, be driven by underlying characteristics of the postcode areas, where common factors that drive people to claim UC and use food banks are causing a spurious correlation between these variables. Moreover, the common secular trend in both food bank use and UC rollout could also bias this association.
Binned scatterplot of the proportion of household claiming UC and households receiving help from Trussell Trust food banks across postcode districts (October and November 2017).
Notes: A binned scatterplot plot splits the sample into a pre-specified number of equally sized groups of observations (in this instance, 100 groups) and then plots the average of the X and Y axis. Each dot then represents one of these groups (or bins) and the position represents the average of that group on both axes.

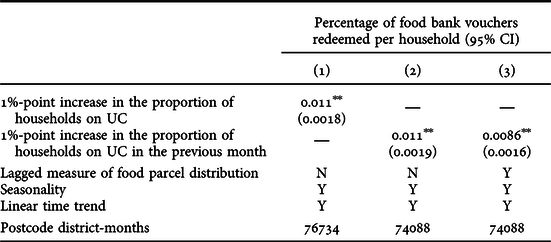
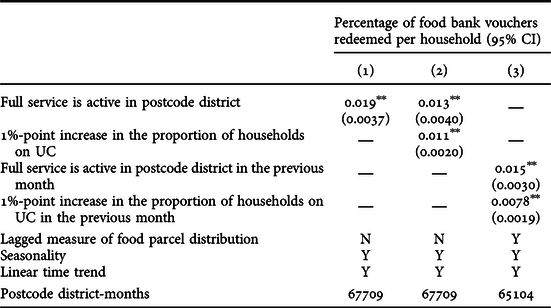
In Table 1, therefore, we report results from a series of models which explore whether this association remains after we have controlled for local area characteristics that are stable over time, the unemployment claimant rate at the local authority level, and time trends. First, we formally model the association between the change in the proportion of households receiving UC over time and the change in the proportion of households receiving food vouchers. We observe that for every 1 percentage point increase in households receiving UC, there is a 0.011 percentage point increase in redeemed food bank vouchers (Model 1 in Table 1). Given the average monthly percentage of vouchers redeemed per household across postcode districts in 2017 was 0.16%, this change represents an increase on monthly voucher claims of about 6.9%. This association is qualitatively unchanged if we estimate this association using the change in the proportion of the population receiving UC in the previous month (Model 2 in Table 1) and if we adjust for the proportion of households receiving a food parcel in the previous month (a lagged measure of the dependent variable). Model 3 in Table 1 is, in effect, a Granger Causality test and we find evidence that changes in UC ‘granger cause’ food parcel distribution.
The roll-out of UC is positively associated with the proportion of households receiving food parcels

Notes: Standard errors are clustered for repeated observations within local authorities. Constant estimated but not reported. All models include postcode district fixed-effects. All models also control for the proportion of the working-age population that are job-seeking benefit claimants. Y = model controls for that variable. * p < 0.05, ** p < 0.01
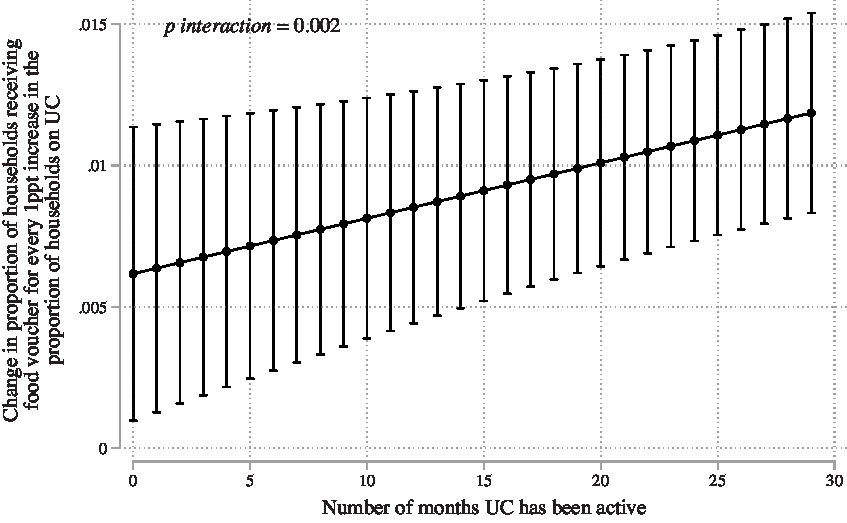
These models suggest an acute effect of more households claiming UC on food bank use. This association could solely reflect problems with the implementation of such a ‘radical’ new welfare system. If this were the case, we would expect the association between the proportion of households receiving UC and receiving help from food banks to diminish with the length of time UC has been active in an area. However, if other aspects of UC, such as debt arising from the wait for payment, reductions in benefit entitlements, or sanctions applied to UC claimants, cause ongoing hardship for UC claimants, then the length of time UC was active in an area would not alter the relationship between UC claims and food bank use, or perhaps even heighten it. We test this by estimating whether the association between the proportion of households receiving UC and the proportion of households receiving a food parcel changes depending on how UC has been active in an area. In figure 2, we show that the longer a postcode district has actively been implementing UC, the stronger the association between the proportion of households receiving UC and the proportion of households receiving a food parcel. This suggests the association between UC and food bank usage is not just teething problems, but persists well after the initial introduction of the new regime in postcode areas.
The association between UC and food parcel distribution strengthens the longer UC has been active in an area.
Notes: Full model is reported in Web Appendix 2, Supplementary Materials. The model replicates model 1 of Table 1 except that now we include a covariate measuring the number of months UC has been active and an interaction term between the number of months UC has been active and the change in the proportion of households receiving UC.

Together, these analyses suggest two mechanisms are at work. First, there is an acute effect of more households claiming UC on food bank use, which may reflect acute problems with applications and the waiting period. But it also appears that the effect of more households going on UC is only increasing the degree to which people are relying on food banks. One explanation of this relationship is that the claimant caseload is associated with the number of households receiving help from food banks, suggesting a second mechanism of persisting problems with UC, such as difficulty paying back hardship loans, rent arrears, or exposure to conditionality and sanctioning. To further explore these two mechanisms, we next use a multi-level model, which allows us to simultaneously estimate the effect of the monthly UC on-flow and the caseload on the number of food bank vouchers redeemed. We also test if we see a stronger relationship between UC and food bank use where food banks are present in the same postcode district.
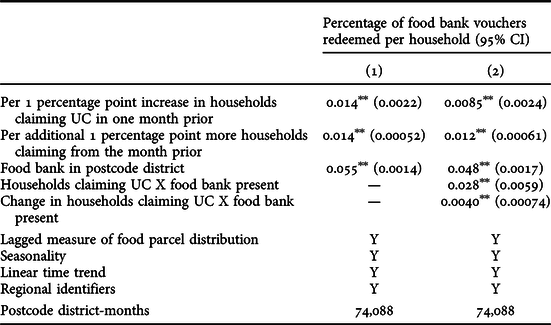
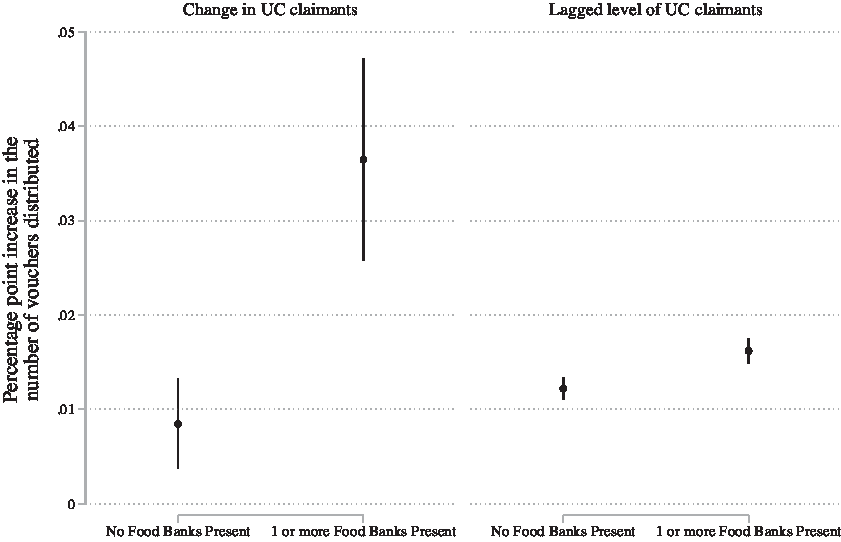
As shown in Model 1 of Table 2, both the difference in households claiming UC from the month prior and the number of households claiming UC in the month prior are independently associated with the level of food bank use. A percentage point increase in the caseload for UC increases the proportion of households receiving a food parcel by 0.014 percentage points (95% CI: 0.013 to 0.015). Similarly, when the number of new claims increases by 1 percentage-point we see the proportion of households receiving a food parcel increase by 0.014 percentage points (95% CI: 0.009 to 0.018).
Multi-level model exploring the relationship between the level and change in households claiming UC in relation to the number of households using food banks.

Notes: Standard errors are clustered for repeated observations within local authorities. Constant estimated but not reported. We estimate multi-level models with random intercepts. All models also control for population size and the proportion of the working-age population that are job-seeking benefit claimants. Y = model controls for that variable. * p < 0.05, ** p < 0.01
Importantly, we also observe (see Model 2 in Table 2) that these relationships are stronger where food banks are located in the same postcode districts as households, suggesting that a lack of access to Trussell Trust food banks may diminish the observed relationship between UC and Trussell Trust food bank use. We visualise this model in Figure 3. Where food banks are located in the postcode district, a 1 percentage point increase in the proportion of households on UC is associated with a 0.036 percentage point increase (95% CI: 0.026 to 0.047) in the proportion of households receiving a food parcel. There is also a stronger relationship between the level of UC claimants and food bank use where food banks are present in the postcode district.
The association between food parcel distribution and the roll-out of UC is greater in areas where food banks are located

How do these numbers translate into the number of times people are helped by Trussell TrustFootnote 4 food banks (see Web Appendix 3, Supplementary Materials)? To do this, we calculate the same model but with a different dependent variable to more accurately calculate the absolute numbers of those affected. We see that if the total number of households on UC increases by 100, there are about 3.5 more people who receive help from food banks. When the number of households on UC increases by 100 compared to the previous month, there is a corresponding increase of about 1.3 more people who receive help from the food bank. However, as above, relationships were stronger where food banks were located in the same postcode districts. For every additional 100 household claiming UC from the month before, the level of people receiving help from food banks was predicted to rise by 6.27 (4.57 to 7.97), and, for every household claiming UC in the month prior, the number of people helped was predicted to be 1.75 higher (1.58 to 1.91).
We can use these numbers to estimate the extent to which UC may have contributed to rising food bank usage in The Trussell Trust Network. To do this, we look at the month of November 2017. We choose this month because it is towards the end of the data collection period, but avoids December, when food bank use is higher than on average. In the month before, October 2017, the number of households on UC was 597,587, and, over October to November, the number of households on UC increased by 25,852. Our models predict that the level of households claiming UC in October would correspond to about 7,953 people helped by food banks in November, which is about 6.7% of the 117,967 beneficiaries that actually received help in this month. Additionally, our model predicts that the observed change in households claiming UC would relate to 892 more beneficiaries in food banks in November. Thus, in total, our model predicts that about 7.5% of the beneficiaries helped by food banks in November 2017 could be attributed to UC.
Sensitivity Analysis
As a final sensitivity test, we also conduct a matching analysis which examines the average proportion of households receiving food parcels in the first 3 months following UC being introduced. Here we match on local authorities that have implemented UC compared to those who have not implemented UC and will not implement it over the follow 3 months. We also match them on a range of other covariates. We find that postcode districts implementing UC have higher food parcel distribution in the first 3 months after UC goes live than those matched postcode districts that did not (see Web Appendix 4 for full details, Supplementary Materials).
The introduction of Full Service
From 2016, Full Service UC began to be introduced in Jobcentres. Its roll out has been fairly slow, but by the end of 2017, it was active in 256 Jobcentres and a corresponding 992 postcode districts. Because claiming UC through Full Service has been associated with problems for claimants related to using the new online system, our next set of analyses examines whether, over and above the number of households claiming UC, we see an association between Full Service becoming active in postcode districts and food bank use.
We again begin with a fixed effect analysis, where we examine the change in number of beneficiaries after Full Service went active across postcode districts (Table 3). We observe the proportion of households receiving food parcels increases by about 0.019% after Full Service goes active in postcode districts. Given that the average proportion of households receiving food parcels before Full Service roll out is 0.15%, this represents a ~10% increase. This association is independent of the number of people claiming UC and the number of beneficiaries in the month prior.
Full service UC is positively associated with the proportion of households receiving food parcels

Notes: Standard errors are clustered for repeated observations within local authorities. Constant estimated but not reported. All models include postcode district fixed-effects. All models also control for the proportion of the working-age population that are job-seeking benefit claimants. * p < 0.05, ** p < 0.01
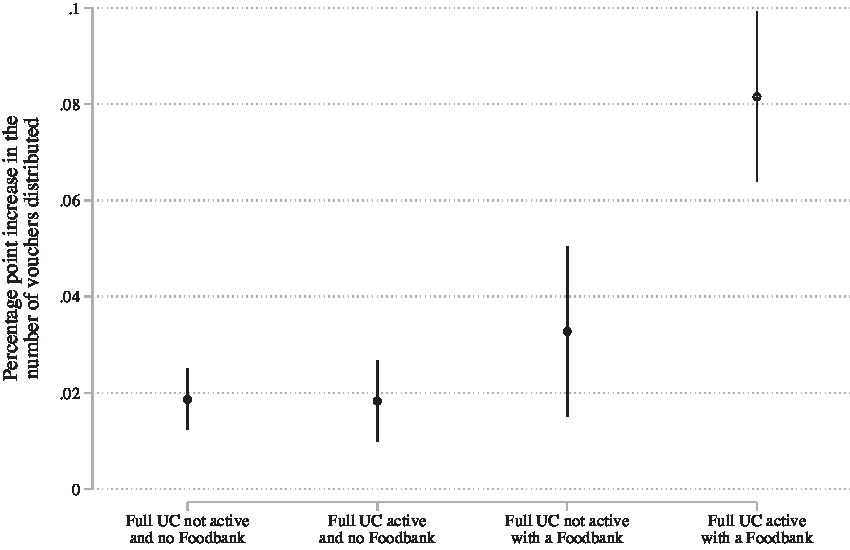
In light of findings from our previous analysis, which showed that the relationship between the number of people claiming UC and vouchers redeemed in food banks was stronger when food banks were present in the same postcode districts, we also test the interaction between Full Service going active, the presence of food banks, and the proportion of households redeeming food bank vouchers in postcode districts using our multi-level model.
The results of this three-way interaction are shown in Figure 4. It highlights that, where food banks are not located in the same postcode district, the relationship between households claiming UC and food bank use does not change when Full Service goes active. However, where food banks are present, there is a much stronger relationship between households claiming UC and food bank use when Full Service goes active (per 1 percentage point increase in households claiming UC, the percentage point increase in food bank vouchers is 0.033 (0.015 to 0.050) where Full Service is not active, but 0.082 percentage points (0.064 to 0.099) after Full Service is active. We again estimate a matching model and find consistent results (see Web Appendix 5, Supplementary Materials).
The association between the roll-out of UC and food parcel distribution varies according to whether a food bank is present and whether UC is ‘Full Active’
Notes: Point estimates represent the change in the proportion of households receiving food parcels association with a percentage point increase in the proportion of households on UC.

Discussion
The roll out of UC embodies a major shift in the logic of social security. This reform attempts to simplify the benefit system by bringing six different targeted benefits into one overarching benefit, while making it more sensitive to the changing circumstances of those on low-incomes. In theory, this should make welfare easier to access and reduce the number of times claimants have to reapply for benefits as their circumstances change. However, in practice, many features of UC may cause hardship and ultimately make the benefit less responsive to the needs of claimants, especially those who are most vulnerable. First, UC incorporates the conditionalities that had previously only been applied to the unemployed and the disabled, whilst changing some of the structural features of how monies are paid and how people claim. Under UC, people are paid in arrears and, with the arrival of the Full Service version of UC, are expected to apply online and regularly update their circumstances. Whilst unable to disentangle how each of these features of UC may relate to hardship, our analysis explores how the roll-out of UC relates to food bank usage, drawing on a uniquely detailed data set measuring food parcel distribution at the postcode district level. We find that the roll-out of UC was associated with rising food bank usage. Moreover, we find some evidence that moving to the digital version of UC (Full Service) has also increased the proportion of people relying on Trussell Trust food banks in the UK.
We found a particularly strong relationship was observed when Trussell Trust food banks were located in the same areas as UC claimants. One important implication of this finding is not, we argue, that UC has a weaker impact on economic hardship in areas without food banks, but rather that the available data are unable to make visible the economic hardship created by UC in these areas. In other words, the hunger that may arise due to UC remains hidden. This might be because households are accessing food through independent food banks that operate in their area and for which no data are available through the Trussell Trust. But, it is also possible that people are simply going without because they do not have access to food aid in their area. Even more troubling is the frequently noted gap between the number of people who are food insecure and the number of people who use food banks. Put simply, even where households have access to food banks, only a small fraction of households that experience difficulty accessing food use food banks. Our results, then, are very likely underestimates of the impact of UC on hunger and, more broadly, food insecurity. Thus, the full extent to which the implementation of UC has resulted in households experiencing food insecurity is not fully captured by using Trussell Trust food bank data by itself.
The second implication of our findings concerns the broader trends in social security that the move to UC represents (Watts and Fitzpatrick, Reference Watts and Fitzpatrick2018). Our results indicate that any association between the roll-out of UC and the rise in food bank usage is not only ‘teething problems’ or administrative errors. UC seems to be more systematically related to the acceleration in the rise in hunger in the UK in recent years. Our analyses cannot single out one specific aspect of the reforms but, at the same time, it is unlikely to be due to only one feature of this new logic of social security. Extending conditionality, increasing the severity of the penalties for failing to adhere to these conditions, payment in arrears, and even the digitalization of the service have all potentially played some role in creating additional demand for food aid. More work will be needed to unpack how these different elements are contributing to hardship.
While we use the best data currently available, there are also important limitations to our study. Area level analyses are susceptible to the ecological fallacy: that is, we simply do not know whether the people receiving food parcels from The Trussell Trust are indeed also receiving UC. Our results are, however, consistent with the rich body of qualitative work produced by both researchers and frontline services documenting the presence of UC recipients in food banks. The Trussell Trust data on food bank usage is less than ideal: for example, it does not cover food banks that are not part of their network (about 40% of food banks that operate in the UK), and it only records the volume of food parcels distributed rather than the number of unique users. And yet, The Trussell Trust remains, to our knowledge, the only source of longitudinal and harmonized data on food bank usage covering the UK. Furthermore, while we acknowledge that food bank use does not approximate the number of households experiencing food insecurity, regular monitoring of this problem has not been conducted in the UK. From 2019, a measure of household food insecurity will be included in the Family Resources Survey.
At the time of this analysis, the roll out of UC was still in its infancy. When completed, it is expected that around 8.5 million claimants will receive UC, ~13% of the entire population. There will, of course, be challenges with implementing any large-scale change to social security systems. Our analysis, however, reveals more systemic problems. The association between UC and food bank usage actually gets stronger the longer UC has been active. This suggests, to quote the UK’s ‘Work and Pensions Committee’, there might be ‘fundamental flaw[s] in the benefit’s design’ (Keen et al., Reference Keen, Kennedy and Wilson2017), which could lead to a ‘human and political catastrophe’ (Field, Reference Field2017). The logic of UC may be ‘theoretically impeccable’ – in that it simplifies social security while incentivizing people to get into work – but it is also ‘unforgiving’, leaving too many economically precarious people struggling to make ends meet (Asthana, Reference Asthana2017).
Acknowledgements
We would like to thank David Webster for his comments on an earlier version of this paper and for the time of the anonymous reviewers and the editors. We cannot share the full data publicly but we have posted the code we used to estimate these models here: https://github.com/asreeves/uc-foodbank
Supplementary material
To view supplementary material for this article, please visit https://doi.org/10.1017/S0047279420000513