


I. INTRODUCTION
Typical passive radiofrequency identification (RFID) system consists of at least a tag and a reader, also called a base station. These two elements communicate by electromagnetic waves sent through the air. To modulate the backscattered signal the tag switches its input impedance between two states, which can be identified as amplitude and/or phase modulation by the reader [Reference Dobkin1].
In most cases, the tags are designed so that their operation is optimal in undisturbed environments. In fact, the use of RFID systems in their operating environments, such as automated object identification on supply chain creates a lot of requirements. All users expect that the systems functions will be unaffected by the environment, the packaging, and the product materials despite the fact that it can impact the performance of the RFID systems.
The aim of our work is to propose to the future users a comprehensive review of the performances of tags in their operating environment. This will allow buyers to select the best candidates for their specific application, limit the pilot projects, and so save time and money.
Initially, our work is to identify the main parameters to measure. All these parameters are chosen so that they allow detailed the behavior of the tag to be identified without performing redundant measurements that may increase the measurement procedure.
Once all parameters to measure have been determined, we provided a detailed description of the measurement setup implementation and automation.
Next, we give some information concerning the capabilities, the resolution, and the benefits of the automated bench test compared to manual measurement.
Finally, we present some examples of what can be done.
II. BASIC PARAMETERS FOR TAGS CHARACTERIZATION
A) Radar cross section
1) DEFINITION
The parameter called radar cross section (RCS) quantifies the ability of the target to reflect an incident wave. It is defined as a surface similar to the equivalent effective aperture of an antenna; however it does not represent the tag's ability to capture the incident wave, but its ability to reflect it to the reader [Reference Penttilä2–Reference Pouzin, Vuong, Tedjini, Perdereau and Dreux4].
The RCS of the tag can be expressed as a function of two parameters:
• The frequency in order to allow the resonant frequency, the bandwidth and the activation range of the tag, to be determined.
• The tag's orientation in order to establish the radiation pattern and polarization of the tag antenna.
2) THEORETICAL EQUATIONS
In general, for any object the RCS is proportional to the density of reflected power on the incident power density:

In the particular case of RFID tags, expression (1) can be calculated according to circuit and radiation parameters of the tag [Reference Pouzin, Vuong, Tedjini, Perdereau and Dreux4]. Thus, we express the RCS of the tag:
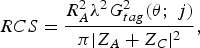
where Z A = R A + jX A is the complex tag antenna impedance, Z C is the complex chip impedance, λ is the wavelength, and G tag (θ; ϕ) is the tag antenna gain.
Equation (2) defines the influence of the load impedance mismatch on the amount of RCS. Nevertheless, it is still impossible to determine RCS if the parameters of the tag are unknown.
3) MEASUREMENT SETUP
The proposed measurement method allows to determine the tag RCS without knowing neither the antenna nor the chip parameters [Reference Penttilä2, Reference Nikitin and Rao3]. It relies on the radar equation that can be simplified if a single antenna is used for both transmission and reception. Thus, the tag RCS can be written as follows:

where S 11 is the reflection coefficient at the reference antenna port, d is the known distance between the reference antenna and the tag for which measurements are made and G ref is the reference antenna gain.
The measurement of RCS is quiet simple; it implements a network analyzer Vectorial Network Analyzer (VNA) and a linearly polarized horn as reference antenna. Figure 1 shows the measurement setup.
Experimental setup for RCS measurement.

Calibration of the measurement system is necessary, in order to remove systematic errors due to the input port mismatch and internal reflections inside the anechoic chamber.
In (3), S 11 is corrected as [Reference Nikitin and Rao3, Reference Pouzin, Vuong, Tedjini, Perdereau and Dreux4]

where S 11empty is the reference return loss measurement for empty anechoic chamber without tag and S 11total is measured in presence of the tag.
We know that tags are designed in order to match the chip's impedance to that of the tag's antenna. In this case, the power transmitted to the chip is maximized and equal to the backscattered power. The measurement of tag's RCS gives a gross idea (non-quantitative since indirect measurement) of its’ performances and those allows serial rapid tag-to-tag comparison in undisturbed conditions. Unfortunately, in real environment impedances are mismatched and the RCS is no longer an image of the activation range of the tag. In this case, another parameter has to be introduced.
B) Maximum activation range (Dmax)
1) DEFINITIONS
The maximum activation range is a tag only specific parameter (reader independent) characterizing the ability of the tag to be activated. It can be measured independently in free space or in disturbed environment.
It is directly linked to two other parameters: the minimum activation power and the activation electric field.
– Minimum activation power (P min).
It is the smallest equivalent isotropic radiated power (EIRP) that allows the tag activation. It depends on d, the distance between the reader and the tag.
– Activation electric field (E min).
This is the electric field that must reach the tag for activation. This quantity can characterize the tag regardless of any other parameter. However, it is rarely used because it does not correspond to any physical quantity of the RFID system.
– Maximum activation range (D max).
Finally, we express the maximum distance at which the tag works as a function of P EIRP_max, the maximum permissible EIRP. Generally, this quantity is the most commonly used parameter to characterize a tag, because is the most meaningful to users.
The maximum activation range of the tag can be measured likewise in space and in disturbed environment. And it can be expressed as a function of two parameters:
– The frequency in order to identify functional frequency band and variation of resonance frequency in different environment.
– The tag's orientation in order to plot the distortion of the radiation pattern of the tag antenna.
2) Theoretical equations
Once the activation power is measured, the activation electric field and the maximum activation range can be deduced using the following equations [Reference Dobkin1, Reference Nikitin and Rao5]:


3) MEASUREMENT SETUP
To optimize the measurements, we maintain a fixed distance between the tag and the reference antenna. In this case, the measurement uncertainties are minimized as positioning errors are no longer involved.
Thus, we reform the “transmitter–tag–receiver” link to find the minimum power that allows the tag's activation (Fig. 2). We use the Agilent MXG-N5182A vector signal generator as transmitter. We generate a query command with modulation and coding format described in the EPC class1 Gen2 protocol. The carrier frequency and the amplitude of the command signal are controlled by the software. The tag response is received on the Tektronix RSA3408A real-time spectrum analyzer (RTSA). We use a mono-static configuration and a circulator to isolate the transmission and the reception channels. The clocks of both devices are synchronized by the RTSA 10 MHz reference clock. The acquisition on the analyzer is triggered based on the vector emitted by the generator “event” exit. The acquired signal is analyzed by the software to determine the state of the tag (activated or not activated). For each position or each frequency, the output power of the generator is changed until the threshold power is found.
Experimental setup for activation range measurement

The EIRP, P min is calculated according to the output power of the generator and parameters of components used in the measurement chain:

where P gene is the output power at the generator port, S 21circ is the transmission coefficient of the circulator, Aff cables is the cables attenuation, and Γ is the reflection coefficient due to the mismatching between the antenna and cable impedances.
From the value of P min, we deduce the value of E min and D max.
C) Differential RCS (Δ RCS)
1) DEFINITION
To modulate the backscattered signal, the RFID chip switches its input impedance between two states, which can be seen as an amplitude modulation. Measurement of ΔRCS allows us to characterized the modulation quality of downlink, from tag to reader. The ΔRCS is an important parameter in the tag performance determination when the distance of communication is dependent on the quality of backscattered signal. That happen for semipassive tags and in some conditions when a passive tag is no longer in the expected configuration of use, for example when it is mounted on a disruptive material, or it is physically deformed, or the reader operates at a frequency other than the tag's resonance.
We know that the ΔRCS is strongly dependent on the impedance of the chip and the antenna. But both impedances vary with frequency along with the input impedance of the chip which varies with power. Several measurements of ΔRCS must then be carried out in order to evaluate independently the influence of the two parameters:
– According to the power for a fixed frequency.
– As a function of frequency for a given power.
2) THEORETICAL EQUATIONS
From the simplified radar equation and (3), differential radar cross section can be expressed as follows:

where ΔP r = P r1 − P r0 is the difference in power between high and low level of modulated backscattered signal and P t is the power transmitted to the reference antenna.
3) MEASUREMENT SETUP
The configuration and the equipment used are the same as for measurement of activation range.
The voltage at the RTSA input is measured in the time domain and expressed in the form of signals I (in phase) and Q (quadrature phase) [Reference Nikitin, Rao and Martinez6]:

In this form, the signal is described in amplitude and in phase and the reference noise contribution can be taken into account:

The reflected power is calculated from the measured voltage at the input of RTSA and according the parameters of components used in the measurement chain:

with R the RTSA input impedance (50 Ω).
In the same way, the power actually transmitted to the antenna is calculated as follows:

Finally, ΔRCS is calculated from (8).
III. THE AUTOMATED SYSTEM
A) Automation software
As previously reported, measurement protocols require long and repetitive actions. A software to automate the measurements with the VNA and the rotating axes already exists and is commonly used to plot the radiation patterns. This software is relatively simple because its functions are limited to acquire and save the parameters being measured. In the case of the RTSA and arbitrary generator, the task is more complicated. Indeed, the parameters obtained are not directly measured by the analyzer. In this case, the role of software is not only of acquiring data but to process and analyze the measurements to configure over any device until the desired settings are obtained.
We have developed two functions specifically for the program calculating the activation range:
– The first one to determine the status of the tag (activated or not activated).
– The second one to search minimum activation power.
A third function was developed to identify low and high power level during differential RCS measurement.
The software was developed on LabVIEW.
1) DETERMINING THE STATE OF THE TAG
For more reliability, the state of the tag is determined in frequency domain. The spectral content of the tag signal is calculated as the Fourier transform of the complex signal v(t) = I(t) + jQ(t).
The spectrum obtained is analyzed. The objective is to detect secondary peaks around a main peak corresponding to the carrier frequency generated by the reader. Indeed when the tag does not respond, the spectrum is equal to the Dirac delta function. While the tag is active, the secondary peaks corresponding to the modulation signal by the tag appear.
We experimentally determined a reference level above the noise regardless of the measurement configuration. This baseline is set to −110 dB. Figure 3 shows the different steps of the determination of the tag state.
Experimental setup for activation range measurement. (1) I and Q signals, (2) LabVIEW program calculating the Fourier transform, (3) signal spectrum when the tag is (a) not activated and (b) activated.

After determining whether the tag is activated or not, for fixed power and frequency, the generator parameters are modified to test another power or another frequency.
2) INVESTIGATING MINIMUM POWER ACTIVATION
The easiest way to find the activation power is to linearly scan the interval of power. In this case, the generator starts by sending a command with a very low power which cannot activate the tag. Then the generator output power is increased gradually until the tag is activated for the first time. The generator output power is the minimum activation of the tag for the tested frequency. This procedure is very simple but also very time consuming especially when the power resolution is great. In order to optimize the search time, we implemented the bisection method.
The bisection method is an algorithm for finding a zero of a function; it consists of sharing an interval into two parts and then selecting the subinterval in which there is a zero function. This process is repeated until the size of the subintervals is below the wanted resolution. This method is relatively simple to implement but largely satisfactory since less time consuming.
3) IDENTIFICATION OF HIGH AND LOW LEVELS OF MODULATION
The determination of levels 0 and 1 of the modulation is not as simple as it seems. Indeed, as shown in Fig. 4, the low signal level does not always correspond to the 0 of the modulation.
I and Q signals received by the RTSA during communication between the reader and the tag.

As exposed in the example, the 0 of the modulation (continuous wave) is the high level of I signal, but the low level of Q signal.
For each signal I and Q, we must find a way to determine signal level which is associated with the value 0 of the modulation.
The principle of the developed method is to calculate three averages of signals:
– the average of the continuous signal,
– the average of the high level,
– the average of the low level.
Afterwards, the level 0 of the modulation is associated with the average (high or low) that is closest to the continuous signal.
Figure 5 shows the I and Q signals received by the RTSA during communication between the reader and the tag together with the three calculated averages.
I and Q signals received by the RTSA and the calculated average.

With this method, levels of modulation are correctly determined. After several experiments, we can say that this method is stable even in the presence of noise.
Once determined, the high and low power levels are used in (8) in order to determine ΔP r and deduce ΔRCS.
B) Evaluation
1) MEASUREMENT SYSTEM CAPABILITIES
The measurement system covering the frequency band between 800 MHz and 1 GHz.
The resolution on the minimum activation power is 0.1 dB. Below this threshold, the behavior of the tag is unstable and the result is unpredictable.
The maximum EIRP on the transmission chain is 33 dBm (2 W).
To ensure that the far field conditions are met, the distance between the tag and the reference antenna is fixed to 1 m.
2) MEASUREMENT UNCERTAINTIES
Uncertainty estimation must be done carefully in any measurement and each possible source of error that might affect it has to be considered. The measured results are only considered exact after their respective uncertainty levels are calculated and associated to the corresponding values. The uncertainty in the measurements is determined through a four-step procedure defined by the National Laboratory of Metrology and Testing. The procedure is described in detail in [Reference Pouzin, Vuong, Tedjini, Pouyet, Perdereau and Dreux7]. Thereby is a reminder of the values of the expanded uncertainties for a confidence level of 95%:
– the uncertainty on the RCS measurement is equal to 2.08 dB or 27.1%,
– the uncertainty on the D max measurement is equal to 1.39 dB or 17.4%,
– the uncertainty on the ΔRCS measurement is equal to 2.30 dB or 30.3%.
3) TIME SAVING
The most significant time gain is achieved through the implementation of the bisection method to find the tag's power activation threshold. With the bisection method, the time gain is substantial compared to the linear manual search, which requires several hours of manipulation and processing. Actually, to know the activation power of the tag for 10 frequencies with an uncertainty of 0.1 dB, starting from an initial power range between 0 and 17 dBm, the measurement time is 12 min.
Similarly, the measurement time of ΔRCS is considerably decreased. Previously, interpretation and processing of signals required about 1 h. Now, thanks to the automatic calculation of the averages, measurement does not take more than a few minutes.
IV. MEASUREMENT PRESENTATION
A) User interface
Figure 6 shows the user interface for measurement of activation power of the tag depending on frequency. Only parameters that require adjustment prior to start measurements are configurable through the interface.
User interface for measurement of activation power of the tag depending on frequency.

The screen is divided into three distinct parts:
– The first is the input area. It includes the fields that the user has to complete to define the measurement parameters.
– The second is a display area through which the user can control program flow. We can find the state of the tag and the frequency and power range being measured.
– The final section is updated at the end of the measurement and gives results in the form of curves and tables.
B) Measurement storage
In addition to the display interface in LabVIEW, an Excel workbook is created for each measure. This workbook has three sheets and a chart. The first sheet summarizes the configuration of the measurement entered by the user. The second sheet includes a table specifying the parameters of devices implemented in the measurement. These parameters are used in calculations. The last sheet contains the measurement results in tabular form. Finally the chart represents the maximum distance activation as a function of frequency.
Finally, the entire workbook describes the configuration of the measurements and contains all information used to achieve the displayed result and eventually modify them.
C) Measurement results
Following figures show some results of actions we have achieved with the automated test bench.
Figures 7 and 8 show RCS as a function of frequency in free space.
RCS of three different tags: a wide band tag (DB) and two narrow band tags for EU (IER1) and US (IER2) RFID bands.

RCS of tags with the same reference and coming from the same batch: (1) homogeneous batch and (2) inhomogeneous batch.

Figure 7 displays behavior of three different tags.
Figure 7 shows the RCS of three tags with distinct behaviors. The tag named IER2 displays a narrow bandwidth around 900 MHz and greater equivalent surface, and thus has the greatest activation range. IER1 tag also presents a narrow bandwidth but around 840 MHz. Its equivalent area is smaller than the tag IER2 and its activation range is less. Finally, the tag called DB has a wide bandwidth, so it can be used in both Europe and North America. Broadening the bandwidth is made at the expense of the activation distance which will therefore be lower for this tag.
The measurement of RCS is relatively quick and simple to implement; it is fully appropriate for the testing of different batches to assess their homogeneity.
By testing a sample of reference tags from the same batch, we note that though some batches of tags are homogeneous (Fig. 8(1)), others are much less homogeneous (Fig. 8(2)).
Figure 9 show the D max of tags allowing the resonant frequency, the bandwidth and the activation range of the tag, to be determined.
Maximum activation range of the DB and the SD tags as a function of frequency with P EIRP_max = 2 W.

We observe in Fig. 9 that the activation range and the bandwidth of the tag called DB are greater than those of the SD tag.
Figures 10 and 11 act out the ΔRCS of the DB tag, respectively, as a function of frequency and power.
Differential RCS of the DB tag as a function of frequency with P t = 1.2(P min/G ref).

Differential RCS of the DB tag as a function of EIRP generated at the reference antenna port.

Figure 10 shows the ΔRCS of the DB tag for significant frequencies. We note that is optimized for the normal operating frequencies of the tag (866, 868, 915, and 956 MHz). Conversely, for other frequencies, to optimize the ΔRCS is not a goal to reach.
We observe that the ΔRCS is maximum when the power received by the tag is low and then decreases gradually as the transmission power increases.
At last, Fig. 12 illustrates the shape change of the radiation pattern of the tag when positioned in free space, at 4 cm, and at 16 cm of a metal plate of size 200 × 200 × 2 mm.
Maximum activation range of the DB tag (in m) as a function of orientation, in free-space and with metal at 4 or 16 cm.

Depending on the distance between the tag and the metal plate, the activation distance of the tag is either improved or deteriorated by the reflections that can be constructive or destructive.
V. CONCLUSION
In this paper, we have proposed an automated test bench for passive UHF RFID tag performances determination. This test bench allows quick and easy measurements of all physical tag parameters without taking into account protocol parameters.
The test bench and the software can be used by anyone. Thanks to the automation, time gain, resolution, and repeatability is considerably increased.
To summarize, we can measure:
– RCS,
– maximum activation range (D max),
– differential RCS (ΔRCS),
as a function of
– frequency,
– power,
– orientation,
– substrate and stand,
– operational environment.
 Audrey Pouzin received her engineer degree from the Institute National Polytechnique de Grenoble (Grenoble-INP) in 2006 and her Ph.D. degree in optical and radiofrequency engineering in 2009. Her main research interests are the characterization of RFID systems, either in terms of regulations or the real performances observed in operations.
 Tan Phu Vuong (senior member IEEE) was born in Vietnam. He received Ph.D. degree in Microwaves from Institut National Polytechnique (INP), Toulouse, France, in 1999 and the HDR (Habilitation à Dériger des Recherches) degree in Microwave and Electronic from Institut Polytechnique de Grenoble (Grenoble INP), in 2007. From 2001 to 2008, he was an Associate Professor in microwave and wireless systems at the ESISAR high school of engineer of Grenoble INP. Since 2008, he is professor at Phelma high school of engineer of Grenoble INP. His research interests include modeling of passive microwave and millimeter-wave integrated circuits. His current research interests include design of small antennas and printed antennas for mobile, RFID, design of passive and active millimeter-wave components.
 Smail Tedjini, Doctor in Physics from Grenoble University in 1985. Since 1996 he is professor at Grenoble Institute of Technology. His teaching topics concern electromagnetism, RF, wireless, and optoelectronics. He serves as director of the ESISAR Eng. Dept. Past research concerns the modeling of devices and circuits at both RF and optoelectronic domains. He is the founder and past director of the LCIS Lab. Now, he is ORSYS group leader. Current research concerns wireless systems with specific attention to RFID. He supervised 27 Ph.D. and he has more than 250 publications. He is member of several TPC and serves as expert/reviewer for national and international scientific committees like Piers, IEEE, URSI, ISO, ANR, OSEO, FNQRT, etc. He organized several conferences/workshops. Senior Member IEEE, President and founder of the IEEECPMT French Chapter, Vice-President of IEEE Section France, and elected as the Vice-Chair of URSI Commission D “Electronics & Photonics” in 2008.
 Jacques Perdereau is an engineer at the National Laboratory of Metrology and Testing (LNE). He is in charge of the department “testing of consumer products”. His work focuses on electromagnetic compatibility and digital media.



