Introduction
Climate change is shaping global biodiversity patterns and driving dramatic shifts in areas where species live and thrive (Journé et al. Reference Journé, Barnagaud, Bernard, Crochet and Morin2020; Willig et al. Reference Willig, Kaufman and Stevens2003). Reports from leading organisations, including the Intergovernmental Science-Policy Platform and Birdlife International, highlight alarming declines in both mammalian and avian populations linked to these changing climatic conditions (Birdlife International 2018; IPBES et al. Reference Archer, Dziba, Mulongoy, Maoela, Walters and Biggs2018). The crisis extends beyond animals; plant communities are also under threat, further highlighting climate change as a major challenge to global biodiversity (Hacket-Pain and Bogdziewicz Reference Hacket-Pain and Bogdziewicz2021; Varol et al. Reference Varol, Canturk, Cetin, Ozel and Sevik2021). Under rising global temperatures (Hajat et al. Reference Hajat, Vardoulakis, Heaviside and Eggen2014; Shukla et al. Reference Shukla, Skeg, Buendia, Masson-Delmotte, Pörtner and Roberts2019), species face three potential outcomes: track suitable climates via range shifts, persist in situ through acclimatisation or adaptation, or decline toward extinction (Bellard et al. Reference Bellard, Bertelsmeier, Leadley, Thuiller and Courchamp2012; Román-Palacios and Wiens Reference Román-Palacios and Wiens2020; Shemsanga et al. Reference Shemsanga, Omambia and Gu2010). In this context, understanding species distributions is essential for guiding effective conservation and habitat management strategies (Bibby et al. Reference Bibby, Burgess and Hill1992), helping us anticipate and mitigate the impacts of the rapidly changing world.
Avian species are widely recognised as sensitive indicators of environmental change and are already exhibiting measurable responses to climate change, including notable shifts in distribution range (Princé and Zuckerberg Reference Princé and Zuckerberg2015; Root et al. Reference Root, Price, Hall, Schneider, Rosenzweig and Pounds2003; Van Doren Reference Van Doren2022; Warren et al. Reference Warren, VanDerWal, Price, Welbergen, Atkinson and Ramirez-Villegas2013). Emission projections suggest that climate change will accelerate over the next century more rapidly than in the past two million years, potentially forcing even widespread bird species to contract their distribution ranges significantly (Mann et al. Reference Mann, Zhang, Hughes, Bradley, Miller, Rutherford and Ni2008; Warren et al. Reference Warren, VanDerWal, Price, Welbergen, Atkinson and Ramirez-Villegas2013). As a result, these species will need to adapt rapidly to novel climatic conditions or relocate to newly suitable habitats, driving further shifts in their distributional ranges and reshaping avian community structures (Princé and Zuckerberg Reference Princé and Zuckerberg2015; Williams and Blois Reference Williams and Blois2018). Evidence of these shifts is already visible on migratory birds, which are arriving earlier on breeding grounds (Gienapp et al. Reference Gienapp, Leimu and Merilä2007; Lehikoinen and Sparks Reference Lehikoinen, Sparks, Møller, Fiedler and Berthold2010), species are moving upslope in elevation (Freeman et al. Reference Freeman, Scholer, Ruiz-Gutierrez and Fitzpatrick2018; Şekercioğlu et al. Reference Şekercioğlu, Schneider, Fay and Loarie2008; Shoo et al. Reference Shoo, Williams and Hero2005), and populations of long-distance migrants have declined more sharply than those of resident species (Sanderson et al. Reference Sanderson, Donald, Pain, Burfield and Van Bommel2006; Yamaura et al. Reference Yamaura, Amano, Koizumi, Mitsuda, Taki and Okabe2009). Additionally, communities are becoming more homogenised, with generalist species increasing at the expense of habitat specialists (Davey et al. Reference Davey, Chamberlain, Newson, Noble and Johnston2012; Le Viol et al. Reference Le Viol, Jiguet, Brotons, Herrando, Lindström and Pearce-Higgins2012). While these patterns can also be influenced by land use and management changes (Doxa et al. Reference Doxa, Paracchini, Pointereau, Devictor and Jiguet2012), mounting evidence suggests that generalist species with broader ecological niches are better equipped to respond to climate change than specialists with narrow habitat requirements (Davey et al. Reference Davey, Devictor, Jonzén, Lindström and Smith2013).
In southern Africa, relatively few studies have focused on the effects of climate change on endemic avian specialists, particularly habitat-sensitive species such as montane grassland birds (Duckworth et al. Reference Duckworth, Garcia, Scholtz and Altwegg2023; Milne et al. Reference Milne, Cunningham, Lee and Smit2015; Oswald et al. Reference Oswald, Lee and Smit2018, Reference Oswald, Smit, Lee and Cunningham2019, Reference Oswald, Diener, Diener, Cunningham, Smit and Lee2020, Reference Oswald, Lee and Smit2021a, Reference Oswald, Smit, Lee, Peng, Brock and Cunninghamb). While some research has investigated distributional range shifts and changes in relation to Important Bird Areas (IBAs) and species turnover in South African biomes (Coetzee et al. Reference Coetzee, Robertson, Erasmus, Van Rensburg and Thuiller2009; Walther and van Niekerk Reference Walther and van Niekerk2015), other research has highlighted species most at risk from climate change (Simmons et al. Reference Simmons, Barnard, Dean, Midgley, Thuiller and Hughes2004). For example, Colyn et al. (Reference Colyn, Ehlers Smith, Ehlers Smith, Smit-Robinson and Downs2020) modelled connectivity and persistence of forest-dependent bird species under future climate scenarios. Against this background, we focused on two grassland montane avian specialists that are potentially vulnerable to climate change (Simmons et al. Reference Simmons, Barnard, Dean, Midgley, Thuiller and Hughes2004).
Our study assessed the potential distributions of two high-altitude grassland specialist birds (Mucina and Rutherford Reference Mucina and Rutherford2006), the Drakensberg Rockjumper Chaetops aurantius and the Mountain Pipit Anthus hoeschi, under the present and future climate scenarios using the pessimistic socioeconomic pathway. This is necessary because both species are listed as Near Threatened (NT) on the IUCN Red List (IUCN, 2022). These ecosystems are increasingly threatened by degradation and transformation through agriculture, overgrazing, mining, and other forms of extractive land use (Egoh et al. Reference Egoh, Reyers, Rouget and Richardson2011). The Drakensberg Rockjumper is endemic to South Africa and Lesotho, typically occurring above 1,500 m above sea level (asl) in rocky and grassy habitats (Allan Reference Allan, Hockey, Dean and Ryan2005; Bonde Reference Bonde1993; Craig Reference Craig1991; Morris Reference Morris2013). The Mountain Pipit breeds on grassy slopes and plateaus during the austral summer, mostly above 3,000 m asl (Voelker Reference Voelker, Hockey, Dean and Ryan2005). These two species were chosen because of the scarcity of ecological data and their restriction to remote, hard-to-access habitats.
We used species distribution modelling to estimate the potential current and future distributions of these species in South Africa and Lesotho (Pearson and Dawson Reference Pearson and Dawson2003; Pearson et al. Reference Pearson, Raxworthy, Nakamura and Townsend Peterson2007), integrating occurrence records from SABAP2, elevation, and bioclimatic data from WorldClim (Fick and Hijmans Reference Fick and Hijmans2017). To assess climate change impacts, we projected distributions under one Shared Socioeconomic Pathway (SSP): SSP5–8.5 selected to represent a high-emissions, fossil-fuel-driven scenario under two temporal scales (IPCC Reference Masson-Delmotte, Zhai, Pirani, Connors, Péan and Berger2021). We specifically selected the widely used model with excellent performance in the Southern Hemisphere, i.e., the ACCESS-CM2 (Bi et al. Reference Bi, Dix, Marsland, O’Farrell, Sullivan and Bodman2020). This model has been shown to produce reliable projections for several taxonomic groups in the southern hemisphere (Sultana et al. Reference Sultana, Baumgartner, Dominiak, Royer and Beaumont2020; Sáenz-Jiménez et al. Reference Sáenz-Jiménez, Rojas-Soto, Pérez-Torres, Martinez-Meyer and Sheppard2021; Motloung et al. Reference Motloung, Chaisi, Sibiya, Nyangiwe and Shivambu2025). The projection models from this study will help guide conservation prioritisation, inform climate-adaptation planning for vulnerable montane birds, and assess their future extinction risk.
Methods
Study area and montane mask
The study area encompassed the montane regions of South Africa and Lesotho, defined as areas with elevation ≥1,500 m (Figure 1). This layer was used to mask and crop species occurrences and pseudo-absences in subsequent analyses, resulting in a montane study area covering approximately 10.3% of the South Africa-Lesotho extent (Simmons et al. Reference Simmons, Barnard, Dean, Midgley, Thuiller and Hughes2004). This threshold was selected based on the known minimum elevation of the Drakensberg Rockjumper, which rarely occurs below 1,500 m (Morris Reference Morris2013; Figure 1), and the montane breeding habitat of the Mountain Pipit, which typically breeds above 2,000 m but forages below 1,500 m (Birdlife International 2018; Figure 1). The study extent was bounded by coordinates 16°E to 33°E and 35°S to 22°S, covering the full distribution of both species across the Drakensberg Escarpment, Lesotho Highlands, and associated mountain ranges of the southern African Great Escarpment (Figure 1).
Geographic distribution range and topographic elevation at 30 m resolution for two South African montane grassland specialist bird species: a) the Drakensberg Rockjumper Chaetops aurantius, and b) the Mountain Pipit Anthus hoeschi.
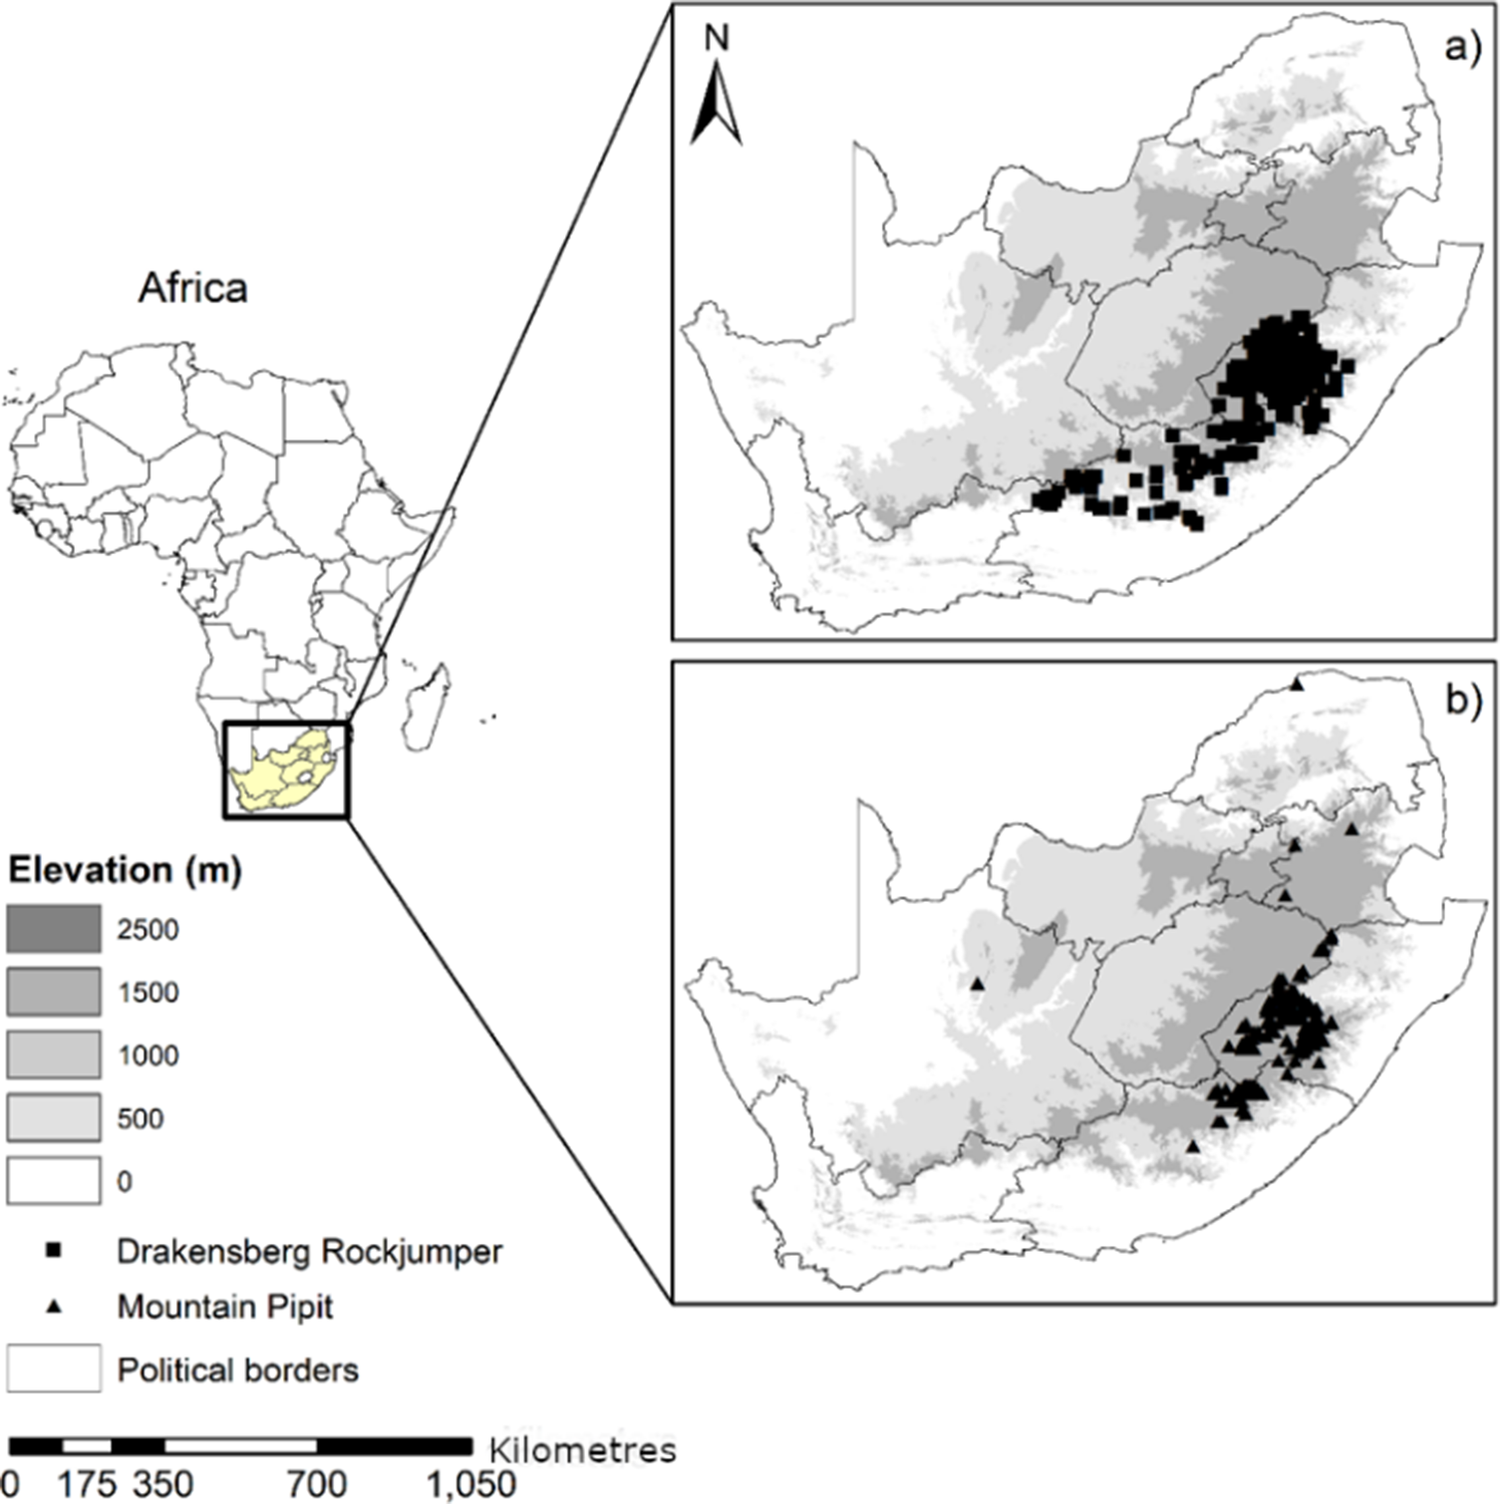
Figure 1 Long description
A multi-panel figure containing three maps and a legend.On the left is a map of the continent of Africa with South Africa highlighted in yellow and enclosed in a black box. Lines extend from this box to two larger inset maps on the right.Below the Africa map is a legend for Elevation in meters, using a grayscale gradient. Dark gray represents 2500, medium-dark gray is 1500, medium gray is 1000, light gray is 500, and white is 0. Below this, a black square represents the Drakensberg Rockjumper, a black triangle represents the Mountain Pipit, and a thin black outline represents Political borders. A scale bar at the bottom indicates 0 to 1,050 Kilometres.Panel a, at the top right, shows the distribution of the Drakensberg Rockjumper. Black squares are densely clustered in the high-elevation regions of the Southeast, specifically within and around the borders of Lesotho, following the dark gray 1500 to 2500 meter elevation contours.Panel b, at the bottom right, shows the distribution of the Mountain Pipit. Black triangles are concentrated in the same high-elevation Southeastern region as the Rockjumper, but with a slightly more dispersed presence extending further North along the high-altitude ridge and one isolated point in the central-west region.
Species occurrence data
The occurrence records for the target species in Lesotho and South Africa were obtained from the Southern African Bird Atlas Project 2 (SABAP2 2025; Brooks and Ryan Reference Brooks and Ryan2025), which is a year-round, graded citizen-science initiative documenting bird presence and distribution range across southern African countries (Figure 1, Brooks et al. Reference Brooks, Rose, Altwegg, Lee, Nel and Ottosson2022; Daniel and Underhill Reference Daniel and Underhill2023). Records were filtered to remove duplicates, coordinates with low precision (≥1 km uncertainty), and occurrences falling outside the study area (Robertson et al. Reference Robertson, Visser and Hui2016) (Supplementary material Table S1). To reduce spatial sampling bias and mitigate spatial autocorrelation, occurrence records were spatially thinned (1 km) prior to modelling, following standard species distribution modelling practice, and its effectiveness was evaluated using Moran’s I (Sillero and Barbosa Reference Sillero and Barbosa2021). Occurrences below the 1,500 m elevation threshold were excluded to ensure all records represented true montane habitat rather than dispersing individuals or misidentified low-elevation records. The filtered dataset was then converted into spatial point objects in the R statistical environment (version 4.5.2; R Core Team 2026). All coordinates were verified to be in the WGS84 geographic coordinate system (EPSG:4326) and were checked for spatial accuracy.
Pseudo-absence records
The current Köppen-Geiger climate classification in the years 1991–2020 (Beck et al. Reference Beck, Zimmermann, McVicar, Vergopolan, Berg and Wood2018) was used exclusively to guide the process of pseudo-absence sampling to ensure background points were drawn from climatically similar areas as occurrence records (Barbet-Massin et al. Reference Barbet-Massin, Jiguet, Albert and Thuiller2012). This approach was used to reduce spatial sampling bias and prevent the selection of pseudo-absences in climatically unsuitable regions, which would otherwise artificially inflate model performance (Bentley et al. Reference Bentley, Robertson and Barker2019). We selected a ratio of pseudo-absences to presences (approximately 2:1) as recommended for presence-only models with small sample sizes (Barbet-Massin et al. Reference Barbet-Massin, Jiguet, Albert and Thuiller2012).
Environmental data and variable selection
Climatic variables
For this study, we used both topographic and climatic variables to build the models for the potential species distributions (Huntley et al. Reference Huntley, Collingham, Green, Hilton, Rahbek and Willis2006; Barbet-Massin and Jetz Reference Barbet-Massin and Jetz2015; Bradie and Leung Reference Bradie and Leung2017) (Table 1). We selected four bioclimatic variables based on their ecological relevance for montane birds (i.e., Annual precipitation (BIO12); Precipitation of the driest quarter (BIO17); Minimum temperature of the coldest month (BIO6)); and Mean temperature of the wettest quarter (BIO8). These variables were selected from the full set of 19 bioclimatic variables to minimise multicollinearity (Pearson correlation coefficients <0.7 among retained variables) and to focus on biologically meaningful constraints identified in previous studies of southern African montane birds (Huntley et al. Reference Huntley, Harvey, Pavia, Boano and Voelker2018).
Environmental predictor variables used in species distribution models. All variables were non-collinear (|r| < 0.7) and derived from WorldClim v2.1 at 1 km resolution
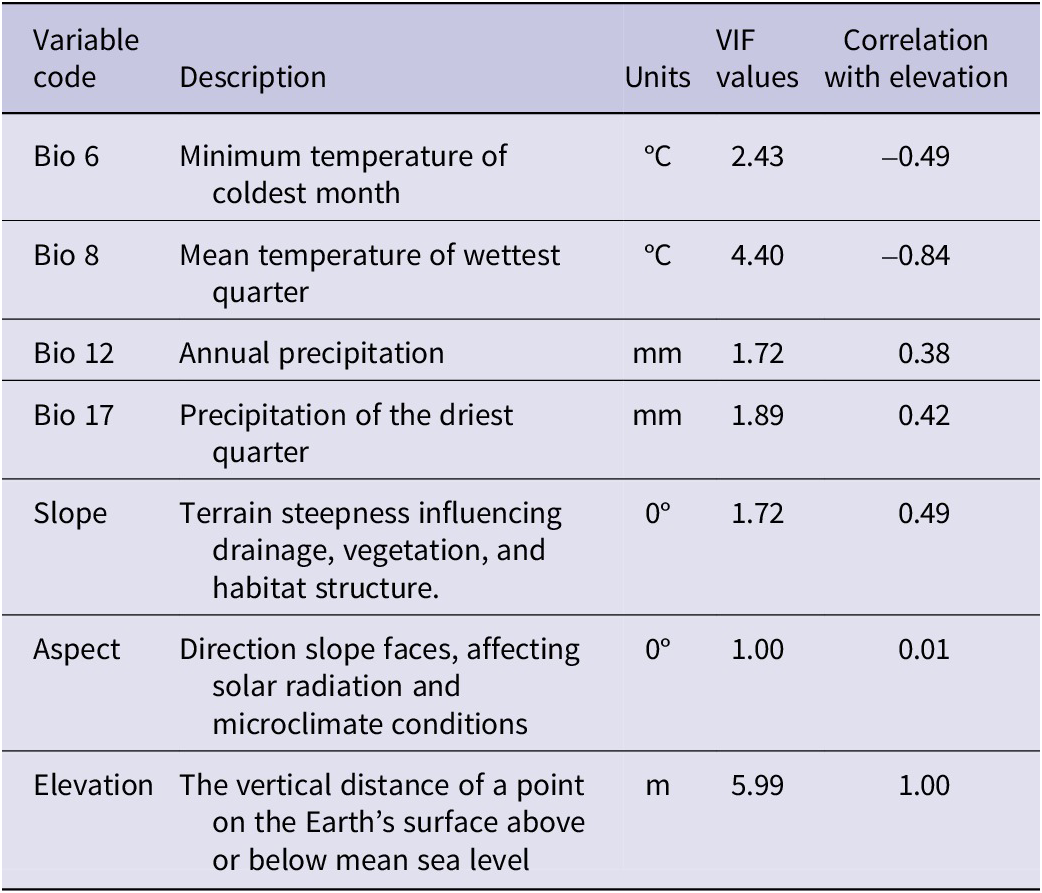
Table 1. Long description
Table 1 has five columns. Column 1 lists the variable codes (e.g., BIO1, BIO12). Column 2 provides the full variable names. Column 3 gives the units of measurement. Column 4 indicates the data source. Column 5 specifies the temporal period (current or future). The table contains 12 rows.
To account for future climate uncertainty, we incorporated projections from the Coupled Model Intercomparison Project Phase 6 (CMIP6), using ACCESS-CM2 general circulation model (GCM), as it has global and regional climate simulation capabilities, high-resolution projections, and a proven track record in studying potential habitat changes under climate change (Sultana et al. Reference Sultana, Baumgartner, Dominiak, Royer and Beaumont2020). We used one Shared Socioeconomic Pathways (SSPs): SSP5–8.5 within two temporal scales. SSP5–8.5 assumes continued fossil-fuel-intensive growth, leading to temperature increases exceeding 4 °C (IPCC Reference Masson-Delmotte, Zhai, Pirani, Connors, Péan and Berger2021). The selected climatic variables were obtained from WorldClim (https://www.worldclim.org/data/index.html) version 2 for both current (1970-2000) and future scenarios, i.e., 2041–2060 (2050s) and 2061–2080 (2070s), at a 30 arc-second resolution (~1 km at the equator) in GeoTIFF format (Booth et al. Reference Booth, Nix, Busby and Hutchinson2014; Fick and Hijmans Reference Fick and Hijmans2017; Hijmans and Graham Reference Hijmans and Graham2006).
Topographic variables
Topographic variables included aspect, elevation and slope (Table 1). Slope and aspect were derived from elevation data obtained from GMTED2010 (Danielson and Gesch Reference Danielson and Gesch2011) and subsequently resampled to match the resolution of the bioclimatic variables using bilinear interpolation (Hijmans Reference Hijmans2021). Slope and aspect were derived from the elevation layer using the terrain() function in R statistical software (Hijmans et al. Reference Hijmans, Barbosa, Ghosh, Mandel and Hijmans2024). Slope represents terrain ruggedness and influences nest-site availability and foraging habitat structure (i.e., mostly important for the ground-foraging Drakensberg Rockjumper), while aspect influences solar radiation and microclimatic conditions (Brambilla et al. Reference Brambilla, Ilahiane, Assandri, Ronchi and Bogliani2017). These variables are used because they are known drivers of target species distributions in high-altitude habitats (Morris Reference Morris2013).
Variable selection
Prior to model development, we assessed multicollinearity among the seven environmental predictor variables using Pearson correlation coefficients and Variance Inflation Factors (VIF). Correlation analysis revealed that elevation was strongly correlated with the mean temperature of the wettest quarter (bio_8; r = -0.84) and moderately correlated with the minimum temperature of the coldest month (bio_6; r = -0.49), the annual precipitation (bio_12; r = 0.38), and the precipitation of the driest quarter (bio_17; r = 0.42) (Table 2). Aspect showed virtually no correlation with elevation (r = 0.01). VIF values ranged from 1.00 (aspect) to 5.99 (elevation), all below the conventional threshold of 10 (Table 2), indicating acceptable multicollinearity. Therefore, all seven variables were retained for species distribution modelling.
Statistical algorithms used for ensemble species distribution modelling
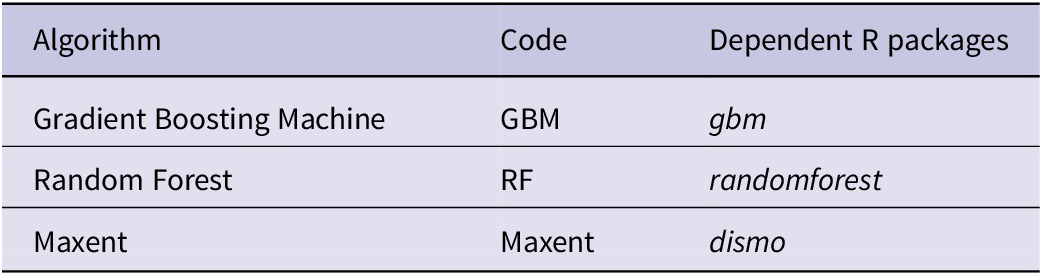
Table 2. Long description
Table 2 has three columns. Column 1 lists the algorithm name. Column 2 gives the R package or software used. Column 3 provides a brief description of the algorithm. The five algorithms are: GLM (Generalised Linear Model), GAM (Generalised Additive Model), RF (Random Forest), MaxEnt (Maximum Entropy), and BRT (Boosted Regression Trees).
Modelling framework
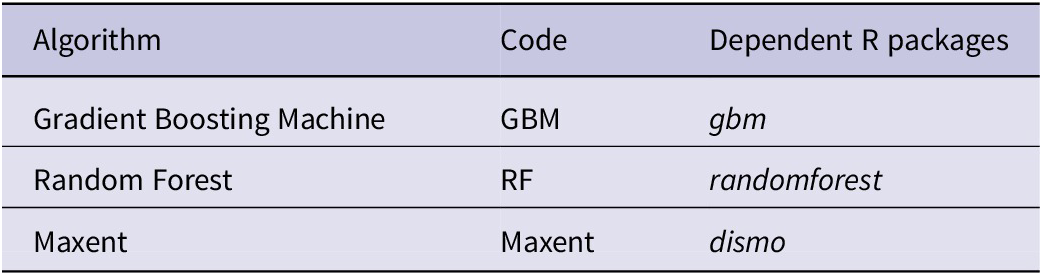
Species distribution models were developed using an ensemble approach implemented in the R package biomod2 (version 4.5.2; Thuiller et al. Reference Thuiller, Lafourcade, Engler and Araújo2009, Reference Thuiller, Guéguen, Renaud, Karger and Zimmermann2019). Elevation, aspect and slope were included as static predictor variables, as they remain constant over time (Elith and Leathwick Reference Elith and Leathwick2009). We selected a set of three modelling algorithms to offer a diverse toolkit that balances interpretability, flexibility, and predictive power, and is suitable for modelling montane specialist birds whose distribution ranges are shaped by complex, nonlinear environmental gradients and often limited occurrence data (Table 2). These are Random Forest (RF), which is an ensemble machine learning method that builds multiple decision trees and aggregates their predictions (Breiman Reference Breiman2001). It handles non-linear relationships and interactions well and provides variable importance measures. The number of trees was set to 500. The Gradient Boosting Machine (GBM) is a boosting algorithm that sequentially builds decision trees, each correcting errors of the previous model (Friedman Reference Friedman2001). It is robust to overfitting and handles complex ecological relationships. Maximum Entropy (MaxEnt) uses a presence-background method to estimate species distributions by finding the probability distribution of maximum entropy subject to environmental constraints (Phillips et al. Reference Phillips, Anderson and Schapire2006). MaxEnt performs well with presence-only data and was run using maxent.jar software (version 3.4.1; Phillips et al. Reference Phillips, Anderson and Schapire2006).
Cross-validation and model evaluation
We calibrated multiple individual Species Distribution Models (SDMs) using the BIOMOD_Modeling function from the biomod2 package (Thuiller et al. Reference Thuiller, Lafourcade, Engler and Araújo2009). Model performance was evaluated using 5-fold cross-validation with three repetitions. We applied stratified five-fold cross-validation to partition presence data into training (80%) and testing (20%) subsets. Stratification was employed to preserve the environmental diversity of each fold across key predictor gradients, minimising spatial sampling bias and reducing the risk of overfitting. This procedure provides reliable performance metrics (AUC, TSS) and ensures that model predictions are robust across species’ distributional range. The AUC measures the model’s ability to discriminate between presence and absence locations, ranging from 0.5 to 1.0, i.e., random to perfect discrimination (Fielding and Bell Reference Fielding and Bell1997). The other metric used was the true skill statistic (TSS), which is calculated as sensitivity + specificity -1, ranging from -1 to +1, where values >0.5 indicate useful predictions (Allouche et al. Reference Allouche, Tsoar and Kadmon2006). The TSS is less dependent on prevalence than other metrics and provides a balanced measure of model performance. Variable importance was assessed by randomly permuting each predictor variable three times and measuring the resulting decrease in model performance.
We evaluated model performance using a randomised k-fold cross-validation approach implemented in the BIOMOD2 framework. Models were validated using random data partitioning (CV.strategy = “random”), a commonly used method that provides reliable estimates of predictive performance when spatial autocorrelation is low or when spatially structured cross-validation is not feasible (Roberts et al. Reference Roberts, Bahn, Ciuti, Boyce, Elith and Guillera-Arroita2017). The dataset was split into five replicates, each with 80% of the data used for training and 20% for testing (CV.nb.rep = 5, CV.perc = 0.8). Model performance was assessed using the TSS (Allouche et al. Reference Allouche, Tsoar and Kadmon2006) and the AUC (Fielding and Bell Reference Fielding and Bell1997). For all models, TSS, AUC, calibration, and cutoffs were calculated across multiple runs. We interpreted the AUC values as follows: <0.7: poor model performance, 0.7–0.9: good performance, and >0.9: excellent performance (Mohammadi et al. Reference Mohammadi, Ebrahimi, Moghadam and Bosso2019). The TSS values ranged from -1 to +1, with values >0.6 considered excellent (Araújo et al. Reference Araújo, Anderson, Márcia Barbosa, Beale, Dormann and Early2019). Instead of the jackknife procedure, which can overestimate predictive power, we evaluated cut-off thresholds and sensitivity, and specificity to ensure model accuracy.
In addition, we evaluated model performance using calibration, validation, and the optimal probability threshold (cutoff) in addition to TSS, sensitivity and specificity. Calibration measures the agreement between predicted probabilities and observed presence/absence in the training data, indicating model reliability. Validation assesses predictive performance on held-out data or cross-validation runs. The cutoff, defined as the probability threshold that maximises TSS, was used to binarise continuous predictions into climatically suitable versus unsuitable areas
Bottom of Form
Ensemble model construction
To create a robust consensus forecast, we built an ensemble model from the calibrated individual models using the BIOMOD_EnsembleModeling function. This function creates a single, integrated model using a committee averaging approach, weighted by each individual model’s TSS evaluation score. To reduce uncertainty associated with individual algorithms, ensemble models (EMwmean) were constructed using weighted mean predictions. Committee averaging averages predictions from models with TSS > 0.7 (Marmion et al. Reference Marmion, Parviainen, Luoto, Heikkinen and Thuiller2009). Binary projections (suitable/unsuitable) were derived by applying a threshold that maximised the sum of sensitivity and specificity (MaxSSS), which balances omission and commission errors (Liu et al. Reference Liu, White and Newell2013).
Projections and ensemble forecasting
We generated consensus maps for each scenario by combining the projections of the individual models using BIOMOD_EnsembleForecasting. Continuous suitability projections were converted to binary maps using TSS-based thresholds to identify areas of potential gain, loss, and stability in the predicted climatic distributions. Clamping masks were applied during projection to detect and limit extrapolation into novel environmental conditions (Owens et al. Reference Owens, Campbell, Dornak, Saupe, Barve and Soberón2013).
Projection to current climates
The calibrated models were projected onto current environmental conditions across the entire study area to generate spatially explicit predictions of habitat suitability. Continuous suitability predictions (ranging from 0 to 1) were produced for each algorithm. Binary presence-absence maps were subsequently derived using the TSS-maximising threshold (i.e., the threshold that maximises sensitivity and specificity). All predictions were masked by the montane mask to restrict outputs to ecologically relevant montane habitats.
Projection to future climates
To assess potential impacts of climate change on both the Drakensberg Rockjumper and Mountain Pipit, distribution models were projected onto future climate conditions for the periods 2041–2046 and 2061–2080 under the SSP5-8.5 scenario. Potential distributions of the species were assessed using three complementary metrics to capture different aspects of range change. These are mean suitability changes, expressed as percentages of the mean suitability score across the entire montane area between current and future periods and capture overall habitat quality trends. High-quality habitat loss is defined as suitability scores exceeding the 70th percentile of the current suitability. This threshold was selected to identify the best habitat (top 30%) while avoiding arbitrary absolute thresholds (Liu et al. Reference Liu, White and Newell2013). Loss was calculated as the proportional decline in area meeting this threshold by 2050 and 2080. Lastly, the top-quartile habitat loss, which refers to areas exceeding the 75th percentile of current suitability, represents the most suitable 25% of habitat. This provides a more conservative estimate of core habitat loss (Thuiller et al. Reference Thuiller, Lafourcade, Engler and Araújo2009).
Statistical analyses
We performed all statistical analyses using R version 4.5.2 (R Core Team 2026). Statistical significance of changes was evaluated using paired t-tests comparing suitability values at identical locations between current and future projections (Zar Reference Zar2010). Paired tests account for spatial autocorrelation by comparing the same locations across time periods. Effect sizes were calculated using Cohen’s d (Cohen Reference Cohen1988), with values interpreted as: <0.2 trivial, 0.2–0.5 small, 0.5–0.8 medium, and >0.8 large (Sawilowsky Reference Sawilowsky2009).
Results
Model performance
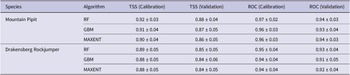
In total, we used 243 Drakensberg Rockjumper and 147 Mountain Pipit occurrence records for the study area, along with related topographic and climatic data, to successfully predict the potential distribution ranges under the different climatic scenarios. Spatial autocorrelation remained significant after thinning (Moran’s I = 0.68–0.99, all P < 0.0001), indicating that despite data cleaning, the presence records retained strong spatial clustering. All three selected modelling algorithms achieved excellent predictive performance for both species, with evaluation metrics substantially exceeding the minimum threshold for model retention (TSS ≥ 0.7). For the Mountain Pipit, ensemble model validation scores showed a mean TSS of 0.87 (±0.04 SD) and a mean ROC of 0.94 (±0.03 SD) across cross-validation folds (Table 3). The Drakensberg Rockjumper ensemble achieved a mean TSS of 0.84 (±0.05 SD) and a mean ROC of 0.92 (±0.04 SD). All individual models exceeded the TSS ≥ 0.7 retention threshold and were therefore included in ensemble forecasts (Supplementary material Table S2).
Model evaluation metrics (mean ± SD) for Drakensberg Rockjumper Chaetops aurantius and Mountain Pipit Anthus hoeschi across cross-validation folds
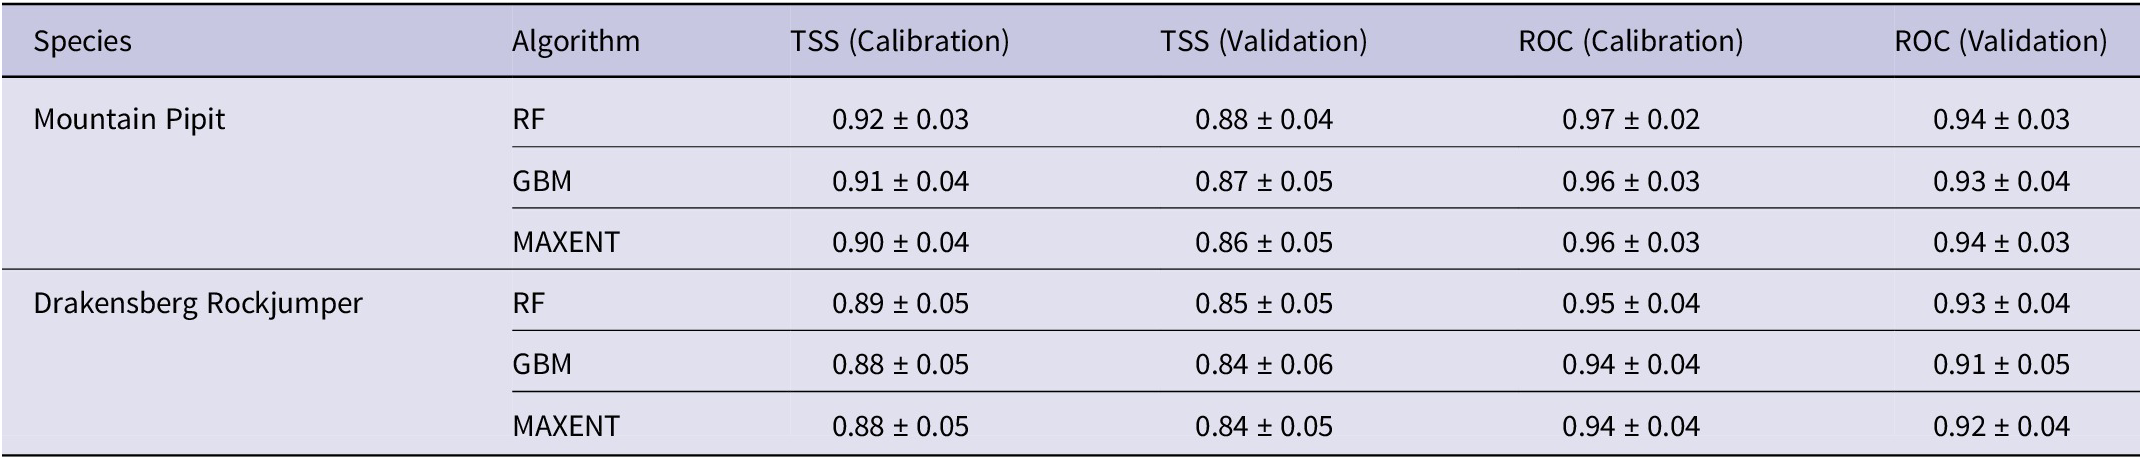
Table 3. Long description
Table 3. Model evaluation metrics for the Drakensberg Rockjumper and Mountain Pipit (mean ± SD across cross-validation folds).
The EMwmean showed good-to-excellent predictive performance for both species (Table 4). For the Mountain Pipit, the ensemble achieved a TSS of 0.735 and an AUC of 0.939, with a sensitivity of 88.8% and a specificity of 85.0% at the optimal cutoff of 524. The Drakensberg Rockjumper model yielded a TSS of 0.683 and an AUC of 0.896, with a sensitivity of 90.0% and a specificity of 78.0% at a cutoff of 373. Because each ensemble was trained and evaluated on the full dataset (mergedData, mergedRun, and mergedAlgo) without cross-validation or bootstrapping, standard deviations could not be calculated. Therefore, only point estimates are reported in Table 4. Variability across cross-validation folds for individual algorithms (RF, GBM, and MAXENT) is provided in Supplementary material Table S2.
Ensemble model (weighted mean) performance metrics for Drakensberg Rockjumper Chaetops aurantius and Mountain Pipit Anthus hoeschi. Sensitivity and specificity are reported at the TSS-maximising threshold. AUC = Area Under the Receiver Operating Characteristic Curve

Table 4. Long description
Table 4 has seven columns. Column 1 lists the species. Column 2 reports the ensemble AUC. Column 3 reports the TSS. Column 4 reports sensitivity. Column 5 reports specificity. Column 6 gives the threshold value used. Column 7 provides the number of algorithms contributing to the ensemble.
Overall, the models performed well across algorithms, runs, and data splits for both species. For the Drakensberg Rockjumper, the calibration values ranged from 0.81 to 1.00, indicating strong agreement between predicted probabilities and observed occurrences. Validation metrics from cross-validation yielded TSS of 1.00 (±0.057 SD) and ROC/AUC of 1.00 (±0.057 SD). Similarly, for the Mountain Pipit, the calibration values ranged from 0.84 to 1.00, and the validation metrics from cross-validation yielded TSS of 0.97 (±0.023 SD) and ROC/AUC of 0.98 (±0.024 SD). The optimal probability threshold (cutoff), rescaled between 0 and 1, used to convert continuous predictions into binary suitability maps was 0.33 (±0.22 SD) across models, ensuring balanced sensitivity and specificity (Supplementary material Table S2).
Variable importance analysis
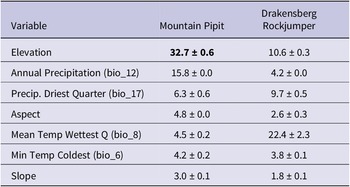
Variable importance analysis revealed contrasting patterns between the two species (Table 5). For the Mountain Pipit, elevation was the dominant predictor, accounting for 32.7 ± 0.6% of model variance, followed by annual precipitation (bio_12; 15.8 ± 0.0%) and precipitation of the driest quarter (bio_17; 6.3 ± 0.6%). Aspect (4.8 ± 0.0%), mean temperature of the wettest quarter (bio_8; 4.5 ± 0.2%), minimum temperature of the coldest month (bio_6; 4.2 ± 0.2%), and slope (3.0 ± 0.1%) contributed comparatively little. In contrast, for the Drakensberg Rockjumper, the mean temperature of the wettest quarter (bio_8) was the most important predictor (22.4 ± 2.3%), followed by elevation (10.6 ± 0.3%) and precipitation of the driest quarter (bio_17; 9.7 ± 0.5%). Annual precipitation (bio_12; 4.2 ± 0.0%), minimum temperature of the coldest month (bio_6; 3.8 ± 0.1%), aspect (2.6 ± 0.3%), and slope (1.8 ± 0.1%) contributed less.
Variable importance (mean percentage contribution ± SD) for Drakensberg Rockjumper Chaetops aurantius and Mountain Pipit Anthus hoeschi, ranked by importance for Mountain Pipit
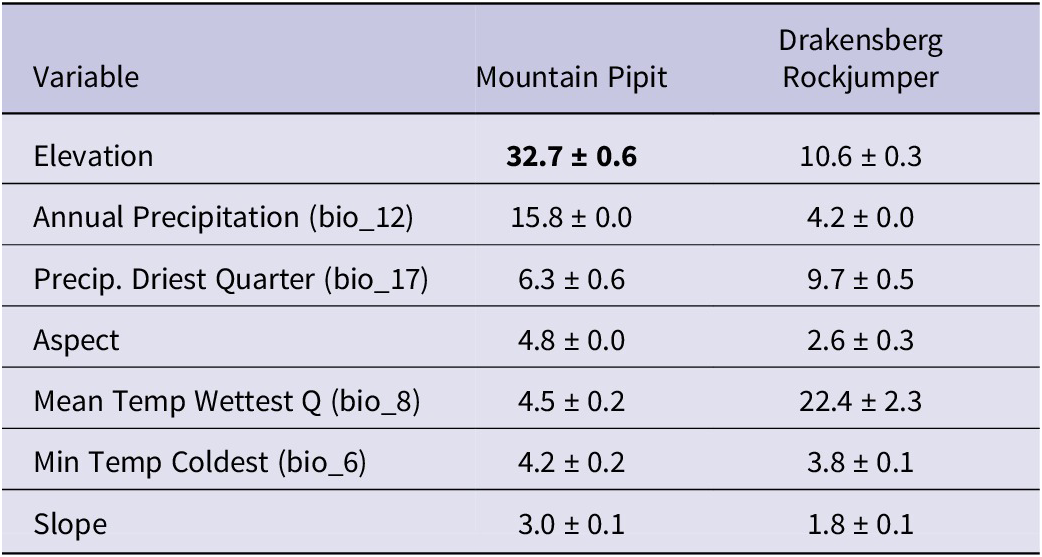
Table 5. Long description
Table 5 has three columns. Column 1 lists the environmental variables in descending order of importance for the Mountain Pipit model. Column 2 shows the mean percentage contribution (± standard deviation) for Mountain Pipit. Column 3 shows the mean percentage contribution (± standard deviation) for Drakensberg Rockjumper. Values are calculated from 10 replicate MaxEnt runs.
Current habitat suitability
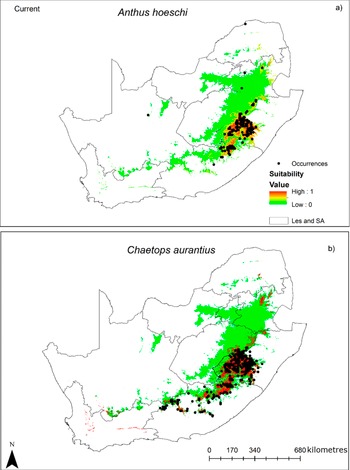
Under current climate conditions (1970–2000 baseline), suitable habitat for both species was largely confined to the Drakensberg Escarpment and Lesotho Highlands, consistent with their known distributions (Figure 2a and b). The Drakensberg Rockjumper exhibited a distribution largely restricted to the montane zone (≥1,500 m), with a mean suitability of 247.6 (range: 0–1000 on the raw MaxEnt output scale). This species also has high-quality habitat, defined as suitability exceeding the 70th percentile of current values, which occupied 30.0% of the montane area. Similarly, the Mountain Pipit showed a comparable but slightly more extensive distribution, with a mean suitability of 221.1 (range: 6–957) and high-quality habitat also occupied 30.0% of the montane area (Tables 6 and 7).
Current predicted distributions for (a) Mountain Pipit Anthus hoeschi and (b) Drakensberg Rockjumper Chaetops aurantius across the montane areas of South Africa and Lesotho. Predicted climatic suitability ranges from unsuitable (0, green) to suitable (1, red). [Note: Boundaries are shown for spatial context and do not represent the full extent of the study area].
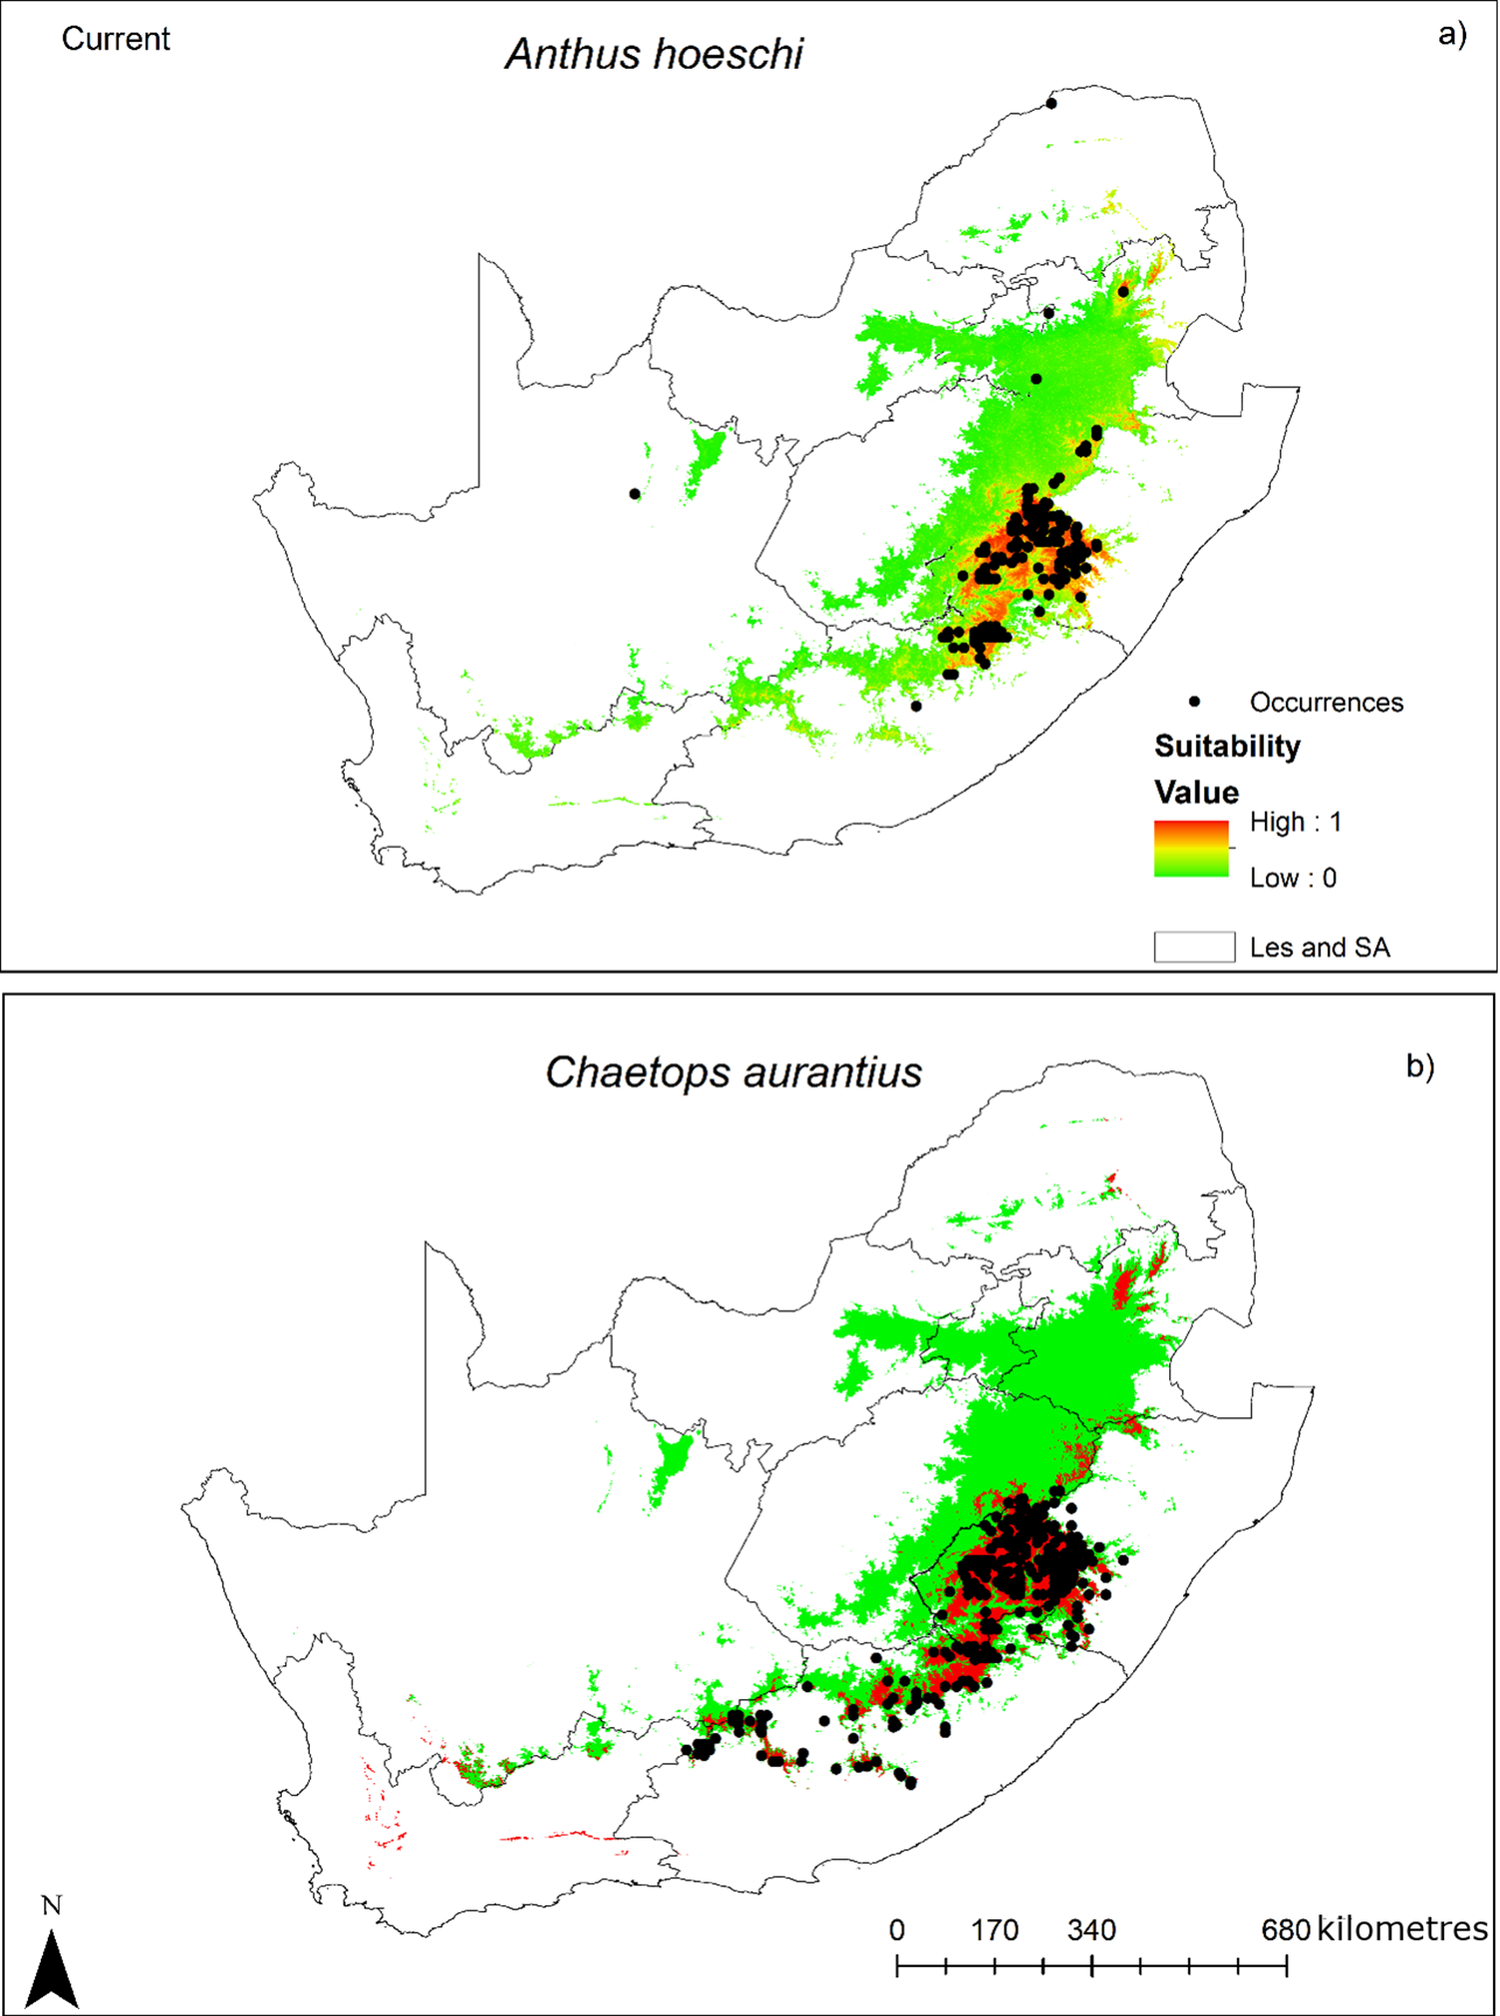
Figure 2 Long description
A two-panel vertical layout of geographical maps. Both maps show the borders of South Africa and Lesotho, labeled as Les and S A.Panel a, titled Anthus hoeschi, shows habitat suitability concentrated in the East and Northeast. A color gradient scale for Suitability Value ranges from green (Low: 0) to red (High: 1). The highest suitability (orange and red) is clustered in the Drakensberg region of Lesotho and the Eastern Cape. Black dots representing Occurrences are densely packed in this high-suitability zone, with a few scattered occurrences in the North and West.Panel b, titled Chaetops aurantius, shows a similar but more restricted distribution. High suitability (red) is concentrated in the high-altitude regions of Lesotho and the Eastern Cape. The black dots for Occurrences are heavily clustered in the Southeast, following the mountain range. A scale bar at the bottom right indicates 0, 170, 340, and 680 kilometres. A North arrow is located in the bottom left corner.
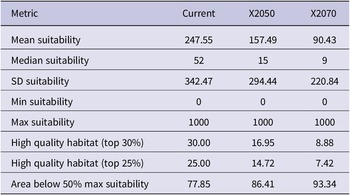
Predicted habitat suitability changes for Drakensberg Rockjumper Chaetops aurantius from current climate to the 2070s (RCP 8.5), showing changes in mean suitability, high-quality habitat (top 30% and top 25%), and area below 50% of maximum suitability
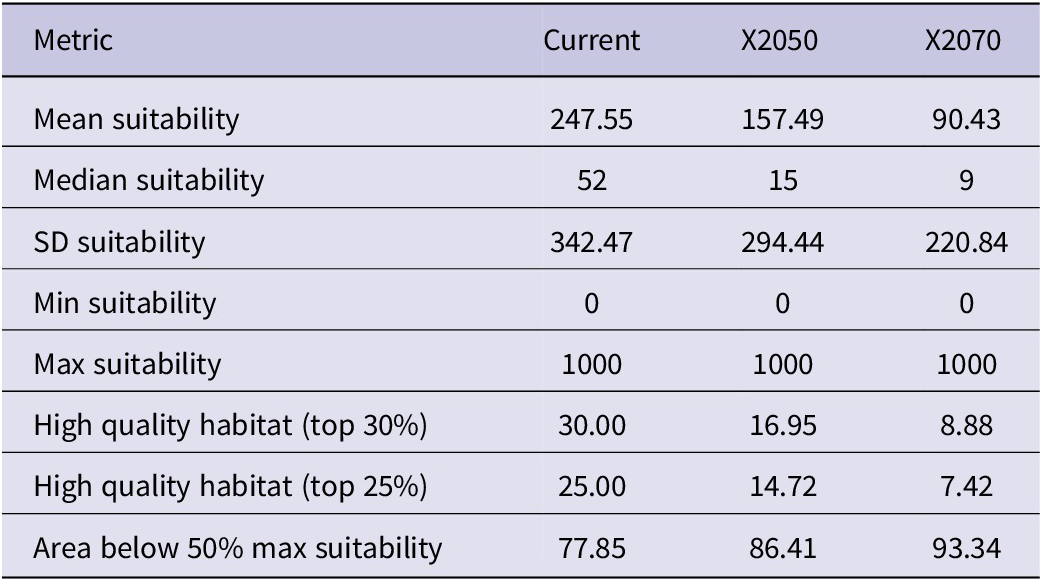
Table 6. Long description
Table 6 has four columns. Column 1 lists the habitat suitability class (e.g., unsuitable, low, moderate, high). Column 2 shows the current area (km²) in each class. Column 3 shows the projected area (km²) in the 2070s. Column 4 shows the percentage change from current to 2070s.
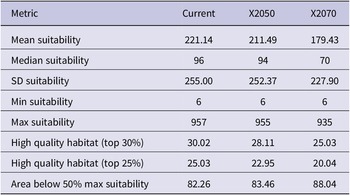
Predicted habitat suitability changes for Mountain Pipit Anthus hoeschi from current climate to the 2070s (RCP 8.5), showing changes in mean suitability, high-quality habitat (top 30% and top 25%), and area below 50% of maximum suitability
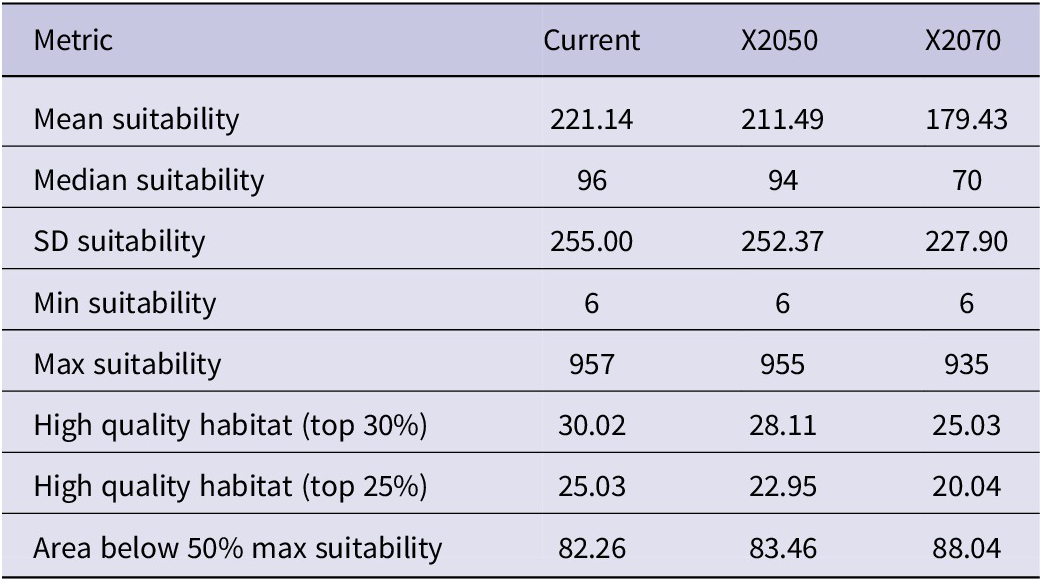
Table 7. Long description
Table 7 has four columns. Column 1 lists the habitat suitability class. Column 2 shows the current area (km²). Column 3 shows the projected area (km²) in the 2070s. Column 4 shows the percentage change.
Changes in species ranges - Drakensberg Rockjumper
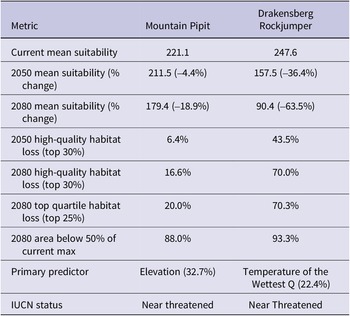
Under the SSP5-8.5 scenario, the Drakensberg Rockjumper is projected to experience a severe decline in climate space (Figure 3; Table 6). Their mean climatic suitability decreased from 247.6 under the current climate to 157.5 by 2050 (-36.4%) and 90.4 by 2080 (-63.5%). However, the median suitability was substantially lower (52 currently, falling to 15 by 2050 and 9 by 2080), indicating that most of the landscape already has low suitability while a few high-value areas pull the mean upward. High-quality climatic space was defined as the top 30% of current suitability and will contract from 30.0% of the landscape to 17.0% by 2050 (a relative loss of 43%) and to 9.0% by 2080 (a relative loss of 70%). The top quartile (25%) showed similar declines: from 25.0% to 14.7% by 2050 and 7.4% by 2080. Alarmingly, the area below 50% of the maximum suitability metric identified locations where suitability fell to less than half the maximum possible score (500 out of 1000). Currently, 77.9% of the landscape falls below this threshold, meaning less than a quarter of the study area retains moderately high suitability. This expanded to 86.4% by 2050 and 93.3% by 2080, leaving only 6.7% of the landscape with suitability above 500 for the Drakensberg Rockjumper by the end of the century.
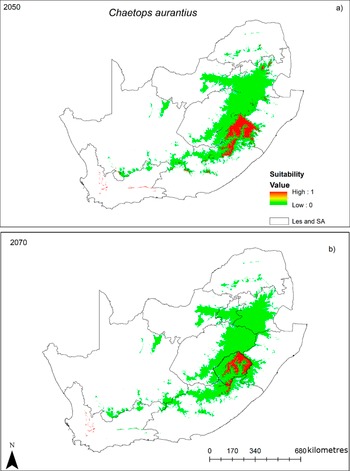
Future predicted distributions for Drakensberg Rockjumper Chaetops aurantius under RCP 8.5: (a) 2050s and (b) 2070s. Suitability ranges from unsuitable (0, green) to suitable (1, red). [Note: Boundaries are shown for spatial context, Les = Lesotho, SA = South Africa]
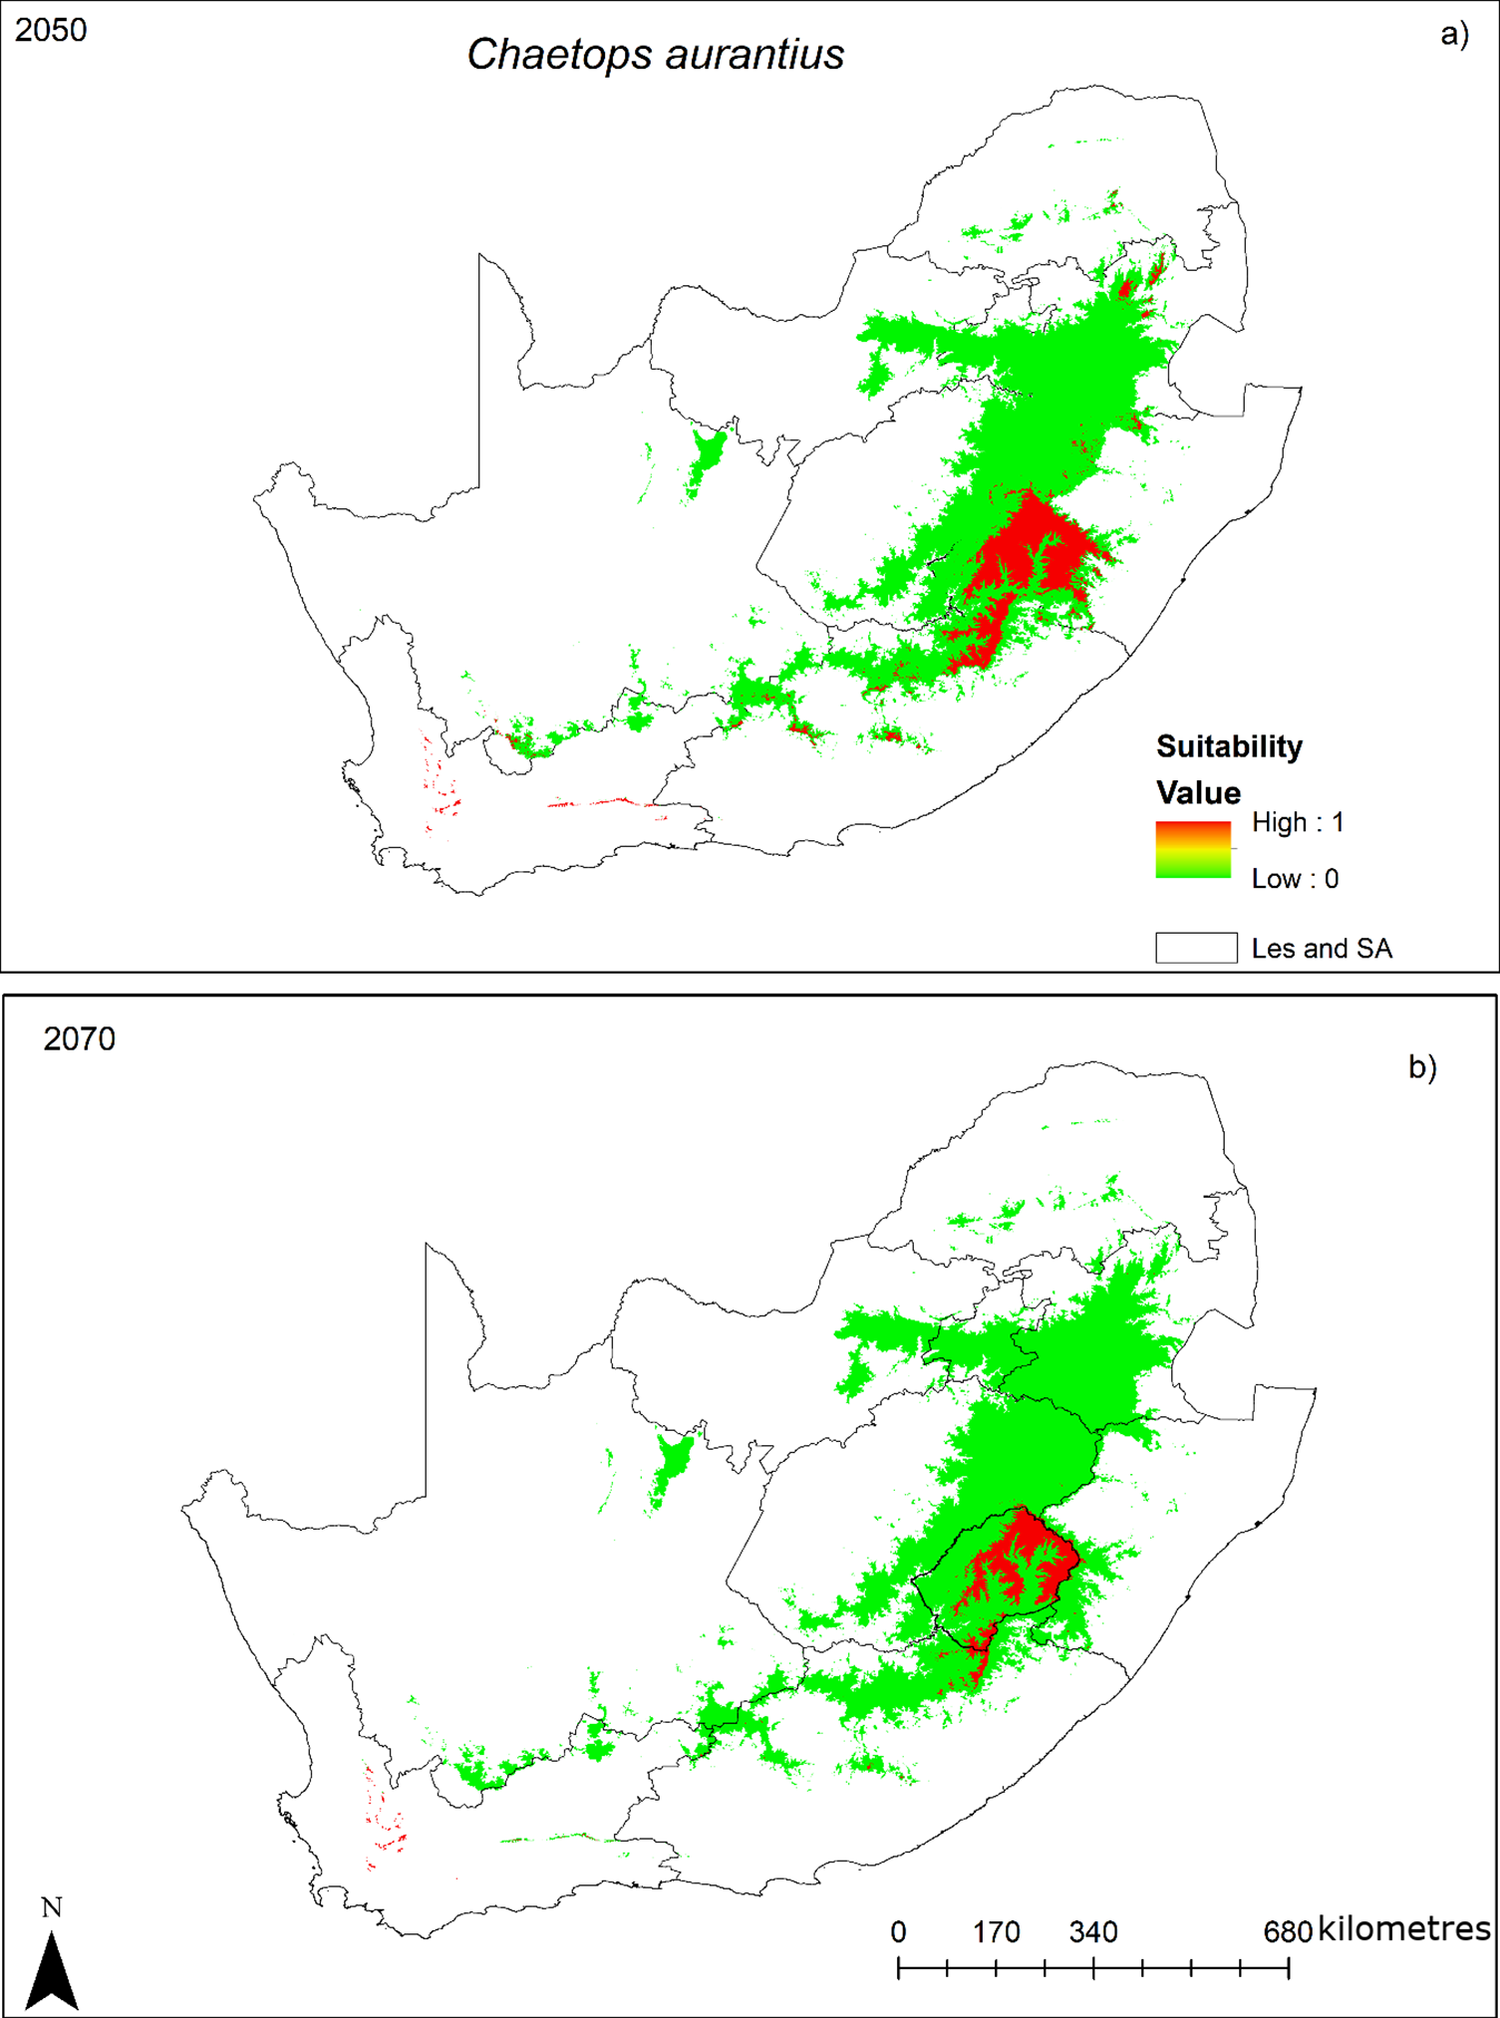
Figure 3 Long description
A two-panel geographical map set.Panel a, labeled 2050 at the top left and Chaetops aurantius at the top center, shows habitat suitability across South Africa and Lesotho. A legend in the Southeast indicates Suitability Value on a scale from Low 0 in green to High 1 in red. The distribution is concentrated in the East and Southeast. A large green area covers the high-altitude regions of the Drakensberg and surrounding escarpments. Within this green zone, a significant red core of high suitability is located primarily within the borders of Lesotho and the immediate surrounding South African provinces. Scattered green patches appear in the South along the Cape Fold Mountains.Panel b, labeled 2070 at the top left, shows a similar distribution but with a noticeable reduction in high-suitability areas. The red core within Lesotho has shrunk significantly compared to the 2050 projection, becoming more fragmented. The surrounding green low-suitability area remains largely stable in extent but shows thinning at the northern and southern edges.Both maps include a North arrow in the bottom left and a scale bar in the bottom right indicating 0, 170, 340, and 680 kilometres. The administrative boundary legend identifies the outlines as Les and S A.
The spatial pattern of change for the Drakensberg Rockjumper revealed range-wide degradation rather than simple range contraction (Figure 3). By 2080, 88.0% of the current montane area will fall below 50% of the current maximum suitability, indicating that even areas that remain within the species’ distribution experience reduced habitat quality. High-quality habitat loss was predicted to be most pronounced along the lower-elevation margins of the Drakensberg (1,500-1,800 m), while core areas above 2,500 m in the Lesotho Highlands retained relatively higher suitability.
Changes in species ranges - Mountain Pipit
Predicted changes in the Mountain Pipit distribution indicate a gradual decline in climatic suitability through time, with accelerated losses after the 2050s (Table 7, Figure 4). Mean suitability decreased modestly from current conditions (221.1) to the 2050s (211.5, -4.4%) and more noticeably by 2070s (179.4, -18.8%). The median suitability of this species declined from 96 to 94 by the 2050s and to 70 by the 2070s. The summary statistics in Table 7 suggest that suitability values were strongly right-skewed, with the mean suitability consistently much higher than the median across all scenarios. We therefore emphasise changes in median suitability alongside mean suitability, because the median is less influenced by a small number of highly suitable grid cells. Median suitability declined from 96 under current conditions to 94 by the 2050s and 70 by the 2070s, indicating a progressive reduction in climatic suitability for the Mountain Pipit.
Future predicted distributions for Mountain Pipit Anthus hoeschi under RCP 8.5: (a) 2050s and (b) 2070s. Suitability ranges from unsuitable (0, green) to suitable (1, red). [Note: Boundaries are shown for spatial context, Les = Lesotho, SA = South Africa]
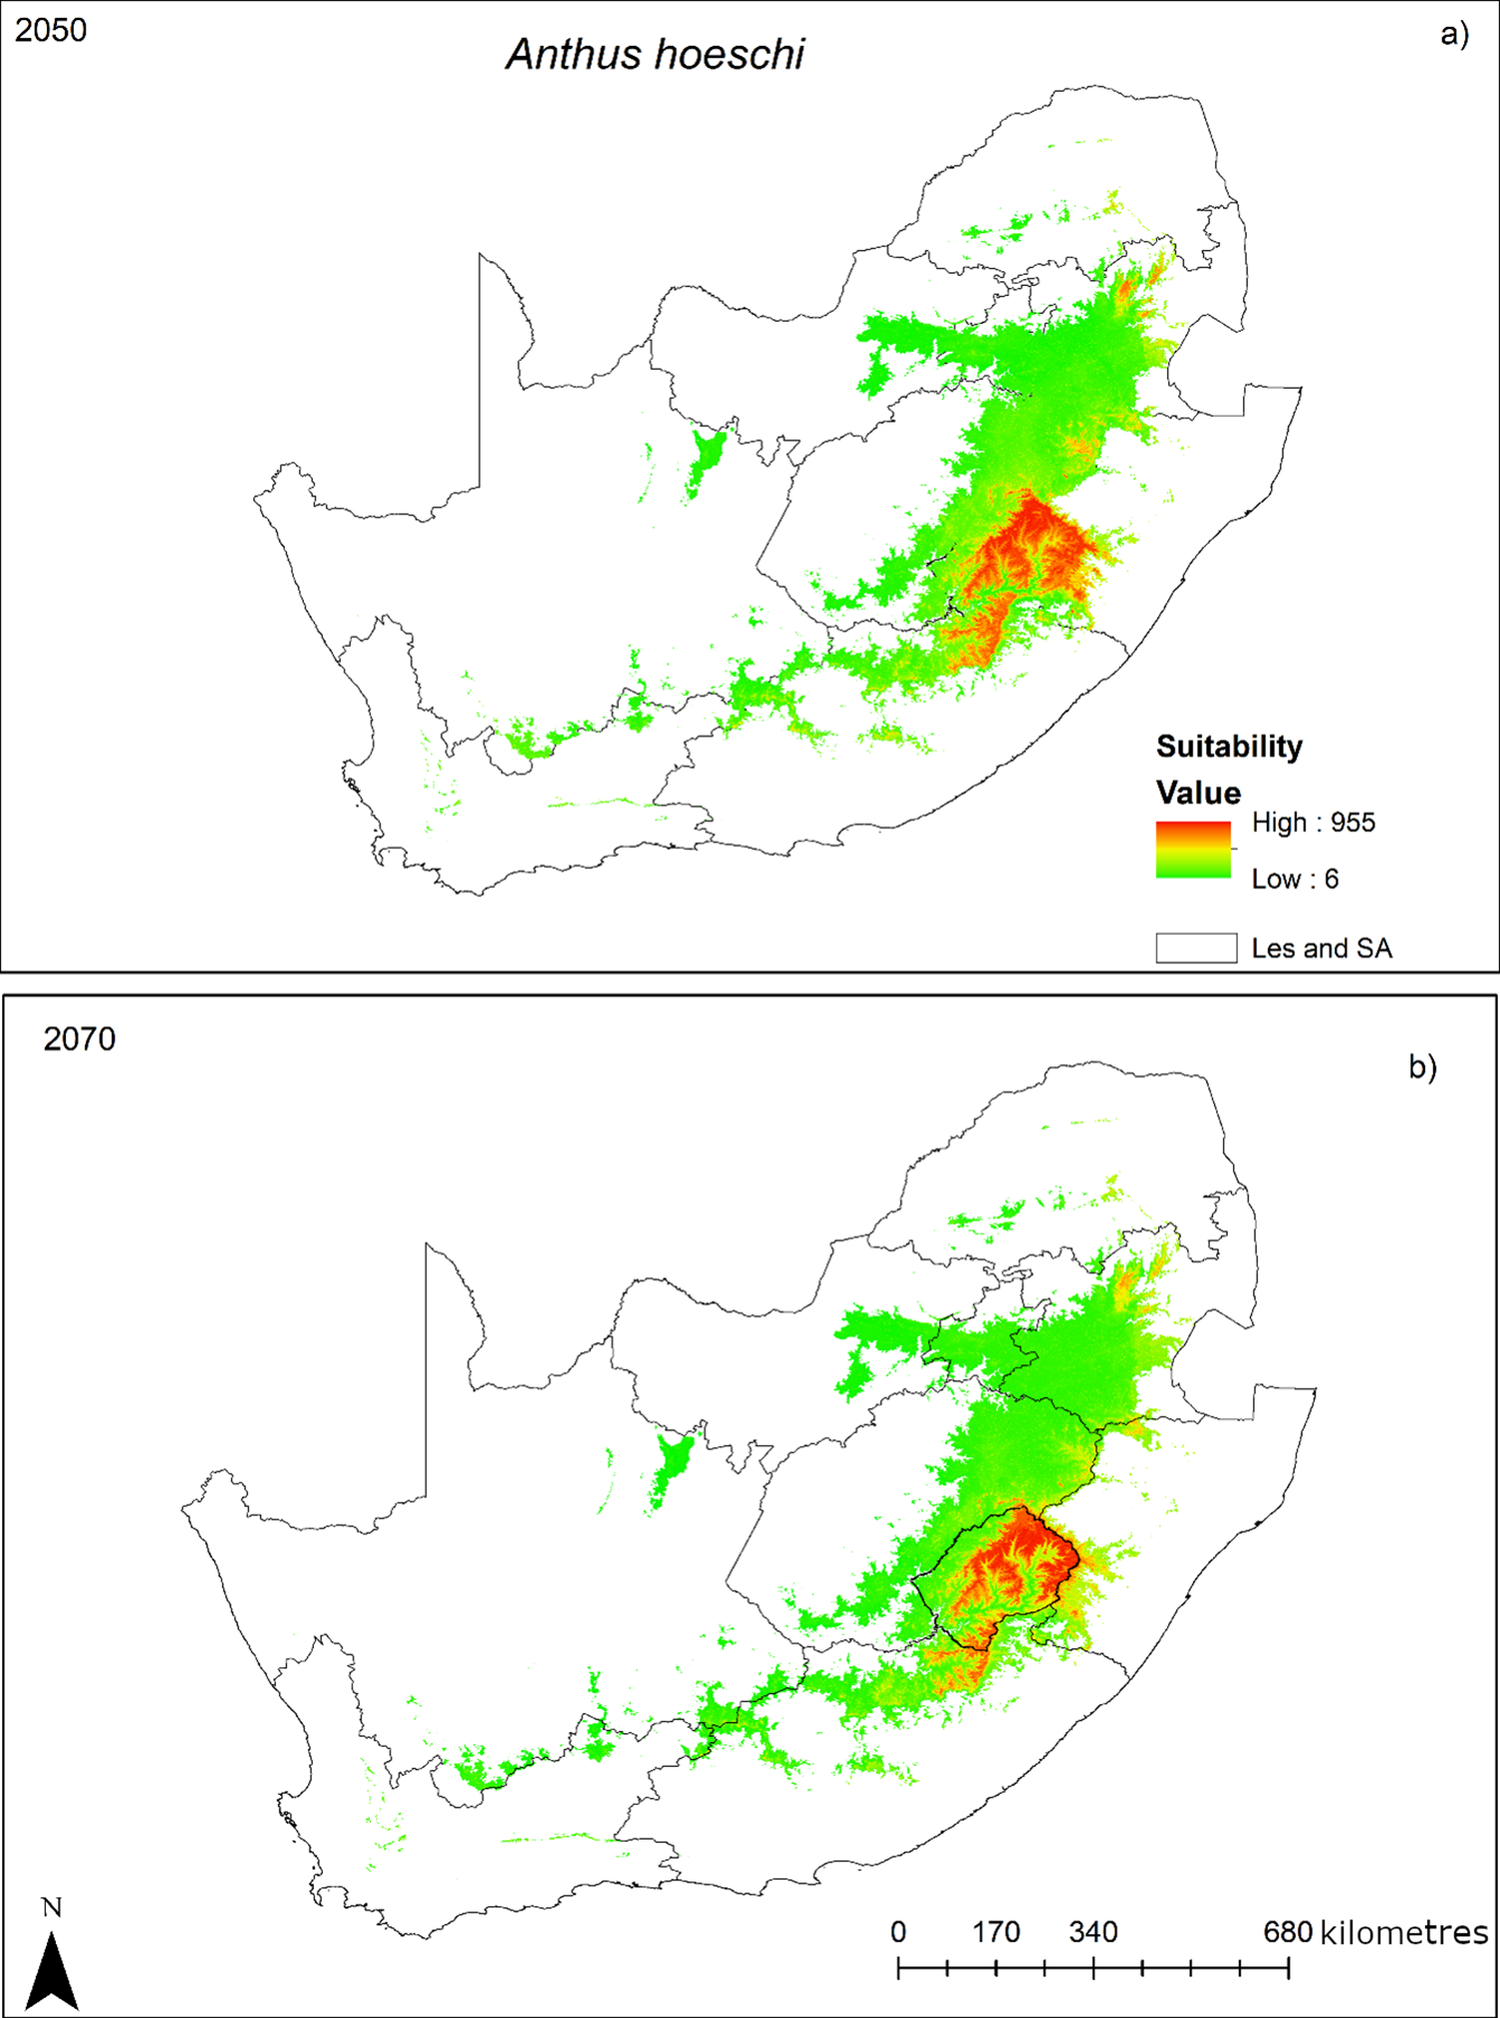
Figure 4 Long description
A two-panel vertical layout of geographical maps showing the projected distribution of Anthus hoeschi. Both maps use a color gradient for Suitability Value, where green represents Low 6 and red represents High 955. A legend indicates that the black outlines represent Les and S A.Panel a, labeled 2050 at the top-left, shows a large green area of suitability stretching across the East and Northeast of South Africa. A concentrated red and orange zone of high suitability is located in the Southeast, corresponding to the mountainous region of Lesotho and its immediate borders.Panel b, labeled 2070 at the top-left, shows a similar distribution but with a noticeable reduction in the total area of green low-suitability zones. The high-suitability red and orange core remains centered over Lesotho, which is highlighted with a thicker black border in this panel.A scale bar at the bottom-right indicates distances of 0, 170, 340, and 680 kilometres. A north arrow is located in the bottom-left corner.
The extent of high-quality habitat declined progressively. The top 30% suitability class is decreasing from 30% at present to 28.1% by the 2050s, and to 25% by the 2070s. The proportion of the study area with suitability below 50% of the maximum (below 500) increased from 82.3% to 83.5% in the 2050s and 88.0% in the 2070s. For this species, minimum suitability remained at six across all scenarios, i.e., was technically above zero, but values this low are less likely to support viable populations.
Comparisons between the species
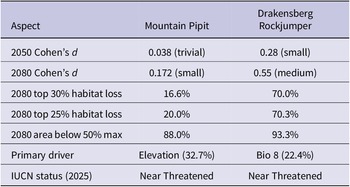
Climate change vulnerability differed markedly between the two high-altitude endemic species (Figures 3 and 4; Table 8). For the Mountain Pipit, projected climatic suitability declined under the selected scenarios. However, the decline was minimal in 2050 but became more pronounced in 2080, suggesting an increasing negative response to climate change over time. Effect sizes were trivial for 2050 (Cohen’s d = 0.038) and small for 2080 (Cohen’s d = 0.172), indicating that the magnitude of change was limited in the near future but increased by the end of the century. In contrast, the Drakensberg Rockjumper showed substantially stronger responses to climate change. Effect sizes were small for 2050 (Cohen’s d = 0.28) and medium for 2080 (Cohen’s d = 0.55), indicating a potential increase in habitat loss over time.
Comparative summary of effect sizes, habitat loss projections, and primary environmental drivers for Drakensberg Rockjumper Chaetops aurantius and Mountain Pipit Anthus hoeschi under RCP 8.5. Cohen’s d effect sizes are interpreted as: trivial (<0.2), small (0.2–0.5), medium (0.5–0.8), and large (>0.8)
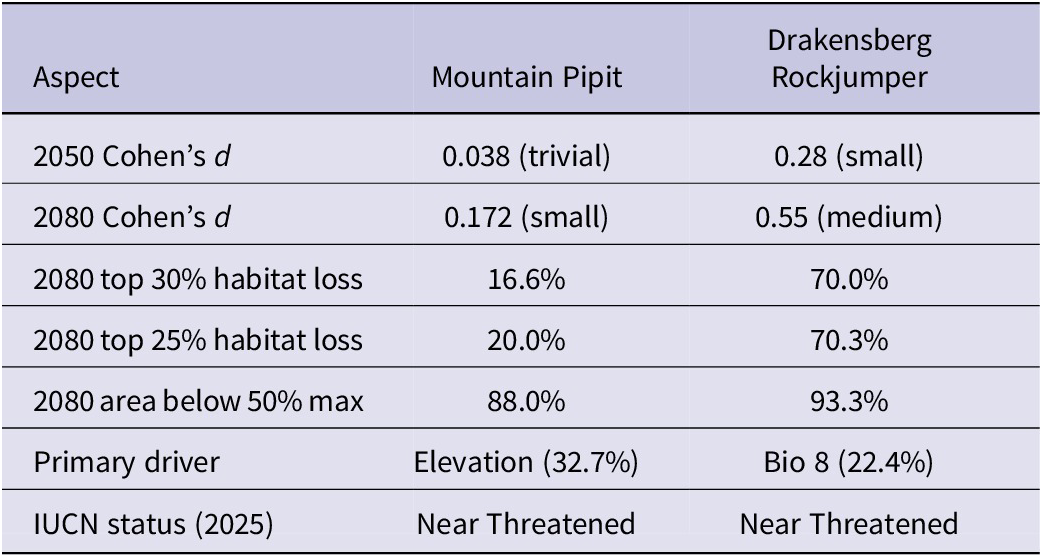
Table 8. Long description
Table 8 has eight rows and three columns. Column 1 lists the aspect or metric being compared. Column 2 shows the value for Mountain Pipit (Anthus hoeschi). Column 3 shows the value for Drakensberg Rockjumper (Chaetops aurantius). Rows are: (1) Cohen’s d for 2050, with effect size interpretation; (2) Cohen’s d for 2080, with effect size interpretation; (3) percentage of top 30% habitat lost by 2080; (4) percentage of top 25% habitat lost by 2080; (5) percentage of area falling below 50% of current maximum suitability by 2080; (6) the primary environmental driver and its percentage contribution; and (7) the current IUCN Red List status for each species. Cohen’s d effect sizes are interpreted as: trivial (<0.2), small (0.2–0.5), medium (0.5–0.8), and large (>0.8).
The spatial pattern of change revealed more extensive degradation for the Drakensberg Rockjumper than for the Mountain Pipit (Figure 4). Even high-elevation areas (>2,500 m) showed a substantial decline in suitability, suggesting that mountaintop refugia may be insufficient to buffer the species against climate change. The most severe losses occurred in the northern Drakensberg and lower-elevation margins of the range.
By the 2070s, the rockjumper is predicted to lose 70% of its high-quality habitat (top 30%) and 70% of its top quartile habitat, compared with 17% and 20%, respectively, for the Mountain Pipit. Similarly, 93% of the Drakensberg Rockjumper’s landscape falls below 50% of its maximum suitability by 2080, versus 88% for the Mountain Pipit. These differences in climate vulnerability align with their primary environmental drivers. The Mountain Pipit’s distribution was primarily constrained by elevation (32.7% variable importance), which may provide topographic refuge as temperatures rise. In contrast, the Drakensberg Rockjumper was driven by the temperature of the wettest quarter (22.4%), a more direct measure of climatic suitability that is projected to change substantially under the SSP5-8.5 scenario. Interestingly, both species are currently classified as Near Threatened within the region (Lee et al. Reference Lee, Rose, Banda, Bezeng, Maphalala, Maphisa and Smit-Robinson2025). However, the results of this study indicated that the Drakensberg Rockjumper faces a substantially more severe trajectory of habitat loss, suggesting its vulnerability may be underestimated under current criteria, while the Mountain Pipit’s reliance on elevation may offer some buffering against climate change.
Comparison of the two species revealed markedly different vulnerability to climate change (Figures 3 and 4; Table 9). By 2080, the Rockjumper is predicted to lose 70% of its high-quality habitat (top 30%) and 70% of its top quartile habitat, compared with 17% and 20%, respectively, for the Mountain Pipit. Similarly, 93% of the Drakensberg Rockjumper’s landscape falls below 50% of its maximum suitability by 2080, versus 88% for the Pipit. Interestingly, the Mountain Pipit’s updated IUCN status is Near Threatened, similar to that of the Drakensberg Rockjumper. However, based on the findings of this study, these species should be on the same level; for example, the conservation status of the Drakensberg Rockjumper could remain Near Threatened, while the Mountain becomes Least Concern. Their primary climatic drivers are temperature for the Drakensberg Rockjumper and elevation for the Mountain Pipit.
Comparative summary of projected changes in mean habitat suitability, percentage changes, and high-quality habitat loss for Drakensberg Rockjumper Chaetops aurantius and Mountain Pipit Anthus hoeschi from current climate to the 2070s (RCP 8.5). High-quality habitat is defined as the top 30% and top 25% of suitability values
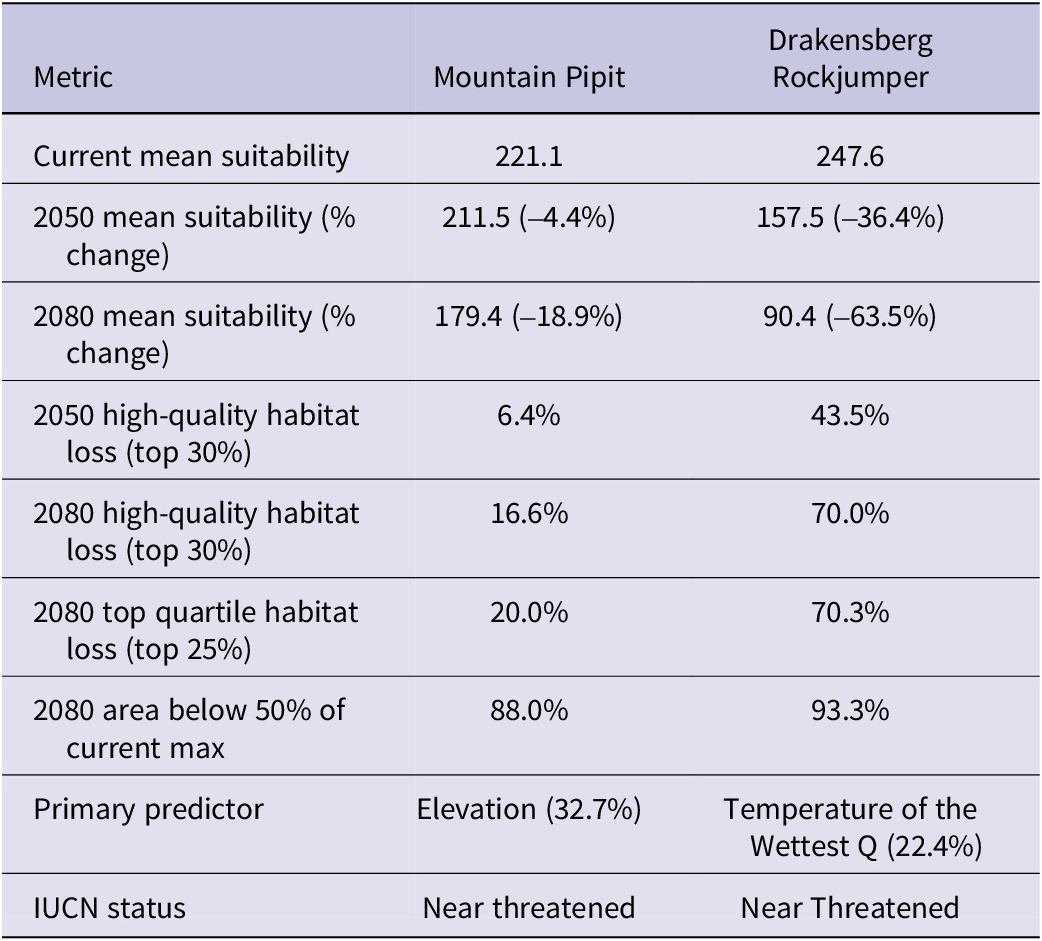
Table 9. Long description
Table 9 has seven rows and three columns. Column 1 lists the metric being compared. Column 2 shows the value for Mountain Pipit (Anthus hoeschi). Column 3 shows the value for Drakensberg Rockjumper (Chaetops aurantius). Rows are: (1) current mean habitat suitability score; (2) mean suitability in the 2050s with percentage change from current in parentheses; (3) mean suitability in the 2080s with percentage change from current in parentheses; (4) percentage of high-quality habitat (top 30% suitability) lost by 2050; (5) percentage of high-quality habitat (top 30% suitability) lost by 2080; (6) percentage of top quartile (top 25%) habitat lost by 2080; (7) percentage of the study area falling below 50% of current maximum suitability by 2080; (8) the primary environmental predictor and its percentage contribution; and (9) the current IUCN Red List status for each species. All future projections are under the RCP 8.5 climate scenario.
Ensemble species distribution models predicted climate refugia for both species in high-elevation eastern and south-eastern montane regions, confirming these species as montane grassland specialists (Figures 3 and 4). Both species were projected to lose a significant portion of their range by 2080 under the high-emission RCP 8.5 scenario. This contraction was marked by a loss of climatically suitable montane areas in the northern and southern parts of their distribution ranges in the Limpopo, Mpumalanga, and Eastern Free State provinces, leaving the mountainous regions in and around Lesotho, such as the Drakensberg, as the core future refugia for both species.
The predicted distribution ranges of the Drakensberg Rockjumper across the Lesotho-South Africa region under present and future climate scenarios indicated that the species is largely concentrated in the high-elevation eastern and south-eastern montane regions. Observed presence points largely overlapped with areas predicted to be suitable across all scenarios, suggesting that the model accurately captured the species’ current distribution. Future projections indicated major contractions and shifts in suitable areas, with suitability remaining largely confined to the core montane regions. The distribution range maps suggest that while some peripheral areas may become less suitable, central populations in the high-elevation regions are likely to persist. In South Africa, only the western montane areas of the Eastern Cape and KwaZulu-Natal provinces are predicted to serve as stable refugia for Drakensberg Rockjumper under the optimistic climate scenario (Figure 3). Under the pessimistic scenario, these areas are projected to experience a substantial loss of climatically suitable distribution range, particularly by 2080. Our results further suggest that the entire climatically suitable distribution range in the northern regions, spanning from the northeastern Free State along the escarpments into Limpopo Province, will likely be lost between 2040 and 2080 under both the pessimistic and optimistic scenarios (Figure 3).
The predicted distribution ranges of the Mountain Pipit across the study region under present and future climate scenarios indicated that the species was largely concentrated in the high-elevation eastern and south-eastern montane regions. Observed presence points largely overlapped with areas predicted to be suitable across all scenarios, suggesting that the model accurately captured the species’ current distribution. Future projections indicated major contractions and shifts in suitable areas, with suitability generally remaining within the core montane regions, with central populations in the high-elevation regions likely to persist. In South Africa, only the southwestern montane areas of the KwaZulu-Natal and north-western parts of the Eastern Cape provinces are predicted to serve as stable refugia for Mountain Pipit under the optimistic climate scenario (Figure 4a–c). Under the pessimistic scenario, these areas are projected to experience a substantial loss of climatically suitable distribution range, with the species likely to persist in the southwestern KwaZulu-Natal, particularly by 2080 (Figure 4e). Our results further suggest that the entire climatically suitable distribution range in the northern regions spanning from the north-eastern Free State along the escarpments into Limpopo Province will likely be lost in the future (2080) under both the pessimistic scenario (Figure 4d–e).
Discussion
Our study predicted that the distribution ranges of both target bird species will contract in the future, primarily towards higher elevations, rather than shifting laterally across the landscape. Substantial contractions in distribution range are predicted along the South African and Lesotho escarpments under future climate scenarios for the Drakensberg Rockjumper. The northern parts of the escarpment, including the north-eastern Drakensberg, Soutpansberg and Wolkberg mountain ranges, are particularly vulnerable, with these regions predicted to be lost in the future. Only the parts of the Lesotho Highlands are predicted to remain suitable and stable for the Drakensberg Rockjumper and Mountain Pipit over time. Mountain Pipit is also most likely to persist in parts of the Steenkampsberg range in Mpumalanga and parts of the Great Escarpment bordering Lesotho, adjacent to the Eastern Cape.
The magnitude of projected declines for the Drakensberg Rockjumper is consistent with patterns reported for sedentary, high-elevation specialists. They largely reflect limited capacity to track shifting climates and face progressive habitat contraction under warming scenarios (La Sorte and Jetz 2010; Pearce-Higgins and Martin Reference Pearce-Higgins, Martin, Chamberlain, Lehikoinen and Martin2023). In contrast, the more moderate declines observed in the Mountain Pipit align with studies showing that migratory species can partially buffer climate impacts through spatial and temporal flexibility (Lisovski et al. Reference Lisovsk, Hoye, Conklin, Battley, Fuller, Gosbell, Klaassen, Lee, Murray and Bauer2024; Reese and Skagen Reference Reese and Skagen2017).
The contrast between variables important in the distribution of the Drakensberg Rockjumper and Mountain Pipit likely reflects differences in ecological specialisation within montane systems. Climatic suitability for the Drakensberg Rockjumper was primarily driven by the temperature of the wettest quarter and elevation, highlighting the importance of thermal conditions. This supports evidence that birds respond to warming through elevational shifts and range contractions (Neate-Clegg et al. Reference Neate-Clegg, Jones, Tobias, Newmark and Şekercioǧlu2021; Rahbek Reference Rahbek2005). In addition, closely related species within the rockjumper clade exhibit pronounced heat sensitivity, further reinforcing the role of temperature as a key limiting factor (Duckworth et al. Reference Duckworth, Garcia, Scholtz and Altwegg2023). In contrast, the Mountain Pipit was primarily associated with elevation and annual precipitation, likely reflecting its reliance on moisture-driven grassland structure and productivity, which in turn shape foraging conditions in high-altitude systems (Simmons et al. Reference Simmons, Barnard, Dean, Midgley, Thuiller and Hughes2004). Across both species, elevation emerged as a key predictor, underscoring its role as an integrative proxy for climatic and habitat gradients in montane environments (Rahbek Reference Rahbek2005; van der Hoek et al. Reference van der Hoek, Sirami, Faida, Musemakweli and Tuyisingize2022).
Both species rely on cool, moist montane habitats for foraging and breeding, making them highly sensitive to climate-driven changes along elevational gradients. These findings align with previous studies demonstrating the vulnerability of montane endemics to climate change (Brambilla et al. Reference Brambilla, Caprio, Assandri and Scridel2022; Coxen et al. Reference Coxen, Frey, Carleton and Collins2017; Engler et al. Reference Engler, Randin, Thuiller, Dullinger, Zimmermann, Araújo and Guisan2011). They also correspond with prior modelling studies of montane biota in South Africa and Lesotho (Bentley et al. Reference Bentley, Robertson and Barker2019), which showed a general trend of montane species moving to higher elevations and experiencing contractions in their distribution range.
In contrast, the Mountain Pipit was more strongly associated with elevation and annual precipitation, likely reflecting its dependence on moisture-driven grassland structure and productivity. In high-altitude systems, precipitation plays a central role in maintaining vegetation structure and invertebrate availability, which in turn shape foraging conditions (Simmons et al. Reference Simmons, Barnard, Dean, Midgley, Thuiller and Hughes2004). This suggests that, unlike the thermally constrained Drakensberg Rockjumper, the Mountain Pipit is more influenced by habitat-mediated climate effects, particularly those linked to moisture availability.
For both species, elevation emerged as a key predictor, underscoring its role as an integrative proxy for climatic and habitat gradients in montane environments (Rahbek Reference Rahbek2005; van der Hoek et al. Reference van der Hoek, Sirami, Faida, Musemakweli and Tuyisingize2022). High-elevation areas likely function as climatic refugia, buffering species against rising temperatures and thereby supporting persistence under changing climatic conditions. However, reliance on elevation also implies vulnerability, as continued warming may compress suitable habitat into increasingly restricted altitudinal ranges.
Although species distribution models revealed strong associations between climatic variables and predicted suitability, such relationships do not necessarily imply causation. Nevertheless, the consistency of temperature and elevation effects with known ecological constraints, particularly thermal sensitivity in the Drakensberg Rockjumper and moisture dependence in the Mountain Pipit, suggests that these variables likely reflect underlying mechanisms shaping species distributions. Areas predicted to be less suitable, particularly warmer or drier regions, may represent marginal habitats where local persistence is reduced, potentially leading to range contractions under future climate change.
These findings highlight contrasting yet complementary pathways by which climate influences montane bird distributions: directly through physiological constraints on thermally sensitive species, and indirectly through habitat structure and resource availability in moisture-dependent species. While static species distribution models provide valuable insights into potential habitat suitability (Franklin Reference Franklin2023), they do not capture the demographic processes underlying distributional change (Franklin Reference Franklin2010). Integrating correlative approaches with mechanistic understanding remains essential for predicting how species will respond to ongoing environmental change.
Caveats and limitations
It is important to note that our models predict climatically suitable areas based solely on abiotic environmental variables, including climate and topography. Ideally, interpretations of predicted climatic suitability should consider birds’ dispersal ability and landscape connectivity. However, correlative species distribution models implicitly assume that species can occupy all areas of future climatic suitability and thus do not explicitly account for dispersal limitations. This assumption is likely more realistic for the Mountain Pipit, which is a long-distance migrant and thus more likely to be able to disperse while tracking the shifting climatic conditions across the landscape. In contrast, the Drakensberg Rockjumper is sedentary and range-restricted and may therefore be less able to disperse to newly suitable areas, particularly where habitat connectivity is limited. As a result, projected persistence for the Mountain Pipit may be more achievable, whereas declines in the Drakensberg Rockjumper could be underestimated if dispersal barriers and habitat fragmentation constrain range shifts.
Additionally, species distributions are shaped by other factors, including biotic interactions, geology, edaphic conditions, and connectivity, which were not incorporated. It is challenging to incorporate all these variables as they are not recorded in the fine-scale modelling used in this study. The study area comprises a diverse geology, with both basaltic and sandstone formations, yet the effects of these substrates on bird distributions remain poorly understood. Consequently, while our projections provide valuable insights into climate-driven range trends, they should be interpreted as potentially suitable areas based on topography and climate covariates rather than definitive predictions of occurrence for the target species.
Finally, spatial thinning was applied to reduce spatial bias in occurrence records; however, evaluation of residual spatial autocorrelation using Moran’s I indicated that spatial structure persisted after thinning (Phillips and Dudík Reference Phillips and Dudík2008). This is consistent with the strongly aggregated nature of montane habitats and suggests that observed spatial patterns reflect both ecological constraints and residual sampling structure in citizen-science datasets (Tsai et al. Reference P.-Y, Ko, Chia, Lu and Tuanmu2021).
Conclusions
In conclusion, our study demonstrated that the Drakensberg Rockjumper and Mountain Pipit are likely to experience substantial range distributional contractions in response to future climate change, with climatically suitable habitats becoming increasingly restricted to higher-elevation montane refugia. Taken together, the results have important implications for the conservation of montane bird species under climate change. The strong association between climatic suitability and temperature in the Drakensberg Rockjumper suggests that ongoing warming may progressively reduce the availability of suitable habitat, particularly at lower elevations where thermal stress is likely to intensify. In contrast, the Mountain Pipit appears more sensitive to precipitation variability, implying that projected rainfall changes may indirectly influence population persistence through bottom-up effects on grassland productivity and associated foraging resources. In both cases, the concentration of suitable conditions in high-elevation environments highlights the importance of montane systems as climatic refugia but also underscores their vulnerability to range contraction under continued climate change. Conservation strategies should include protecting montane refugia, enhancing habitat connectivity, maintaining and restoring ecological corridors to facilitate range shifts, long-term monitoring to assess species responses, and engaging local communities to integrate conservation into land-use planning. By prioritising these measures, it may be possible to enhance the resilience of montane grassland specialists and safeguard the unique biota. In addition, long-term monitoring programs are recommended to ensure the persistence of these species.
Our study also highlighted the importance of the regional biodiversity framework. For example, the projected climate-driven range contraction of both species into the Lesotho Highlands and adjacent escarpment transforms their conservation from a national responsibility into a transboundary legal obligation. Under the Convention on Biological Diversity (CBD 1992) and the regional SADC Protocol on Wildlife Conservation and Law Enforcement (SADC 2023), South Africa and Lesotho are required to cooperate in managing shared ecosystems. Existing frameworks such as the National Environmental Management: Biodiversity Act and the Maloti-Drakensberg Transfrontier Programme provide a basis for formalising joint adaptation strategies, without which long-term species persistence is unlikely (NEMBA 2004).
Supplementary material
The supplementary material for this article can be found at http://doi.org/10.1017/S0959270926100896.
Acknowledgements
We are thankful to the University of KwaZulu-Natal (ZA) and the National Research Foundation (ZA, Grant 98404) for funding this project and the Ford Wildlife Foundation (ZA) for vehicle support. We are grateful to the reviewers and the associate editor for their constructive comments, which improved our manuscript.
Competing interests
The authors have no conflict of interest.