INTRODUCTION
Tropical dry forests occur in frost-free areas with lower rainfall (250–1800 mm y−1), higher mean annual temperatures (>17°C), stronger seasonality (3–8 mo of drought) and a higher ratio of potential evapotranspiration to precipitation (>1) than wet forests (Holdridge Reference HOLDRIDGE1967, Murphy & Lugo Reference MURPHY and LUGO1986a). They possess unique characteristics including a well-established trend of species richness along latitudinal and environmental gradients (Gentry Reference GENTRY1988), high floristic endemism (Dirzo et al. Reference DIRZO, YOUNG, MOONEY and CEBALLOS2011) and high structural and physiological diversity of life forms (Bullock et al. Reference BULLOCK, MOONEY and MEDINA1995). Additionally, tropical dry forests have a high degree of soil spatial heterogeneity with some soil properties varying at the scale of kilometres, whereas other soil properties may vary over a few metres or less (Gonzalez & Zak Reference GONZALEZ and ZAK1994). Despite these characteristics, tropical dry forests have received less attention than tropical rain forests in published ecological studies.
In many cases, tropical dry forests are not pristine, but are secondary forests resulting from various human disturbances (Janzen Reference JANZEN and Wilson1988). Although secondary succession of tropical rain forests is often characterized by the colonization of pioneer species after disturbance followed by the replacement of late-successional species (Saldarriaga et al. Reference SALDARRIAGA, WEST, THARP and UHL1988, Van Breugel et al. Reference VAN BREUGEL, BONGERS and MARTÍNEZ-RAMOS2007), the recovery of tropical dry forests may be determined by the resprouting capability of the pre-disturbance species composition (Imbert & Portecop Reference IMBERT and PORTECOP2008, Lévesque et al. Reference LÉVESQUE, MCLAREN and MCDONALD2011). Regarding the resilience of tropical dry forests, previous studies have reported floristic differences between seral stages (Guariguata et al. Reference GUARIGUATA, CHAZDON, DENSLOW, DUPUY and ANDERSON1997, Sanchez-Azofeifa et al. Reference SANCHEZ-AZOFEIFA, KALACSKA, CALVO-ALVARADO, QUESADA, RIVARD and JANZEN2004), the effects of the degree of disturbance (Murphy & Lugo Reference MURPHY and LUGO1986b) and successional change along a chronosequence (Kennard Reference KENNARD2002, Lebrija-Trejos et al. Reference LEBRIJA-TREJOS, BONGERS, PÉREZ-GARCÍA and MEAVE2008). Often succession studies of tropical dry forests have overlooked edaphic conditions and have offered limited conclusions about how species are affected by soil factors during secondary succession (Gonzalez & Zak Reference GONZALEZ and ZAK1996, Jha & Singh Reference JHA and SINGH1990).
In Myanmar, there are 3 million hectares of dry forests (FD 2011), occurring mostly in the central dry zone. These forests have been subjected to various anthropogenic disturbances such as firewood cutting, agricultural expansion and illegal logging. Although these disturbances are quite common in the region, there is a knowledge gap pertaining to secondary succession and the effect of soil spatial diversity on species composition in these dry forests. Therefore, we examined a dry forest in central Myanmar that had once been intensively disturbed. We tested two hypotheses: (1) secondary succession is not initially led by pioneer species, but instead, by superior competitor species capable of resprouting; and (2) species distributions are primarily determined by the filtering effects of edaphic conditions.
STUDY SITE
Description of study site
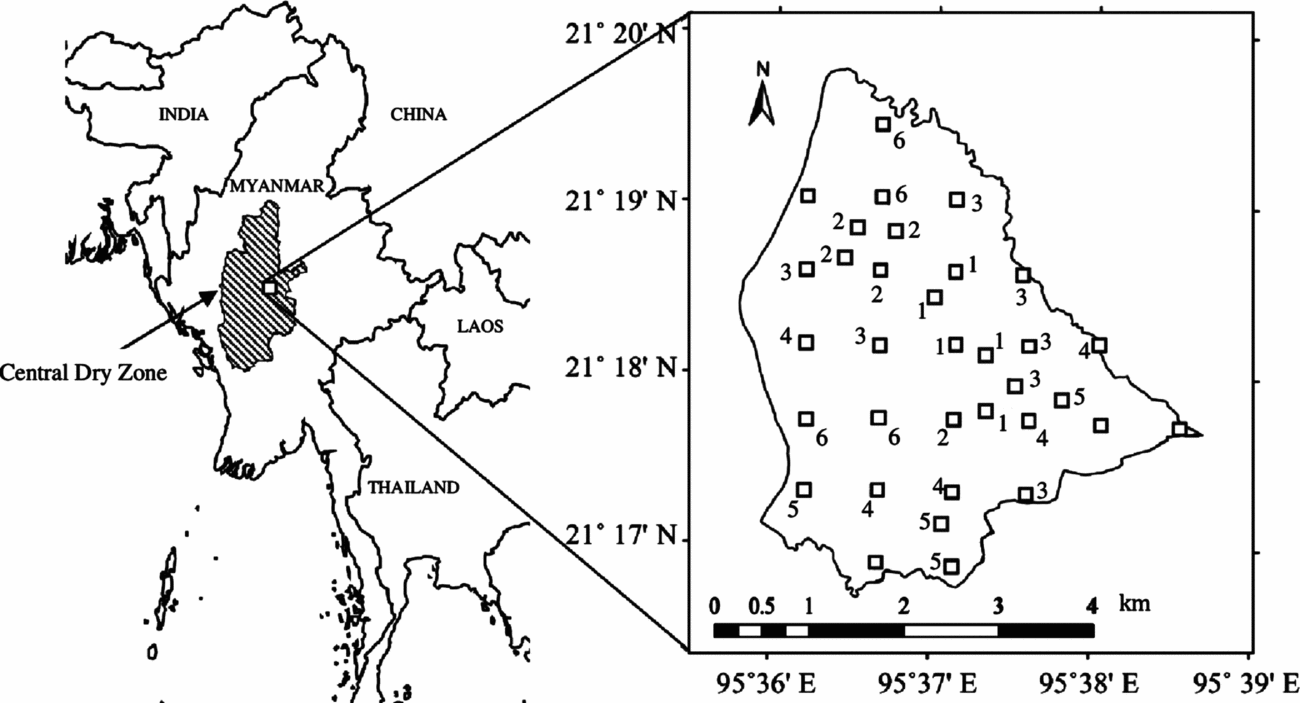
This study was conducted in the Taungphila reserved forest (21°18′N, 95°37′E; 15 km2) located in central Myanmar (Figure 1), which contains a mosaic of permanent agriculture, human settlement and remnant forest vegetation. The region experiences three seasons a year: a hot season (February–April), a rainy season (May–October) and a cold season (November–January). According to the nearest rain gauge station in Natogyi less than 6 km away, the study area has an annual rainfall of less than 700 mm y−1, and the average monthly temperature is c. 27°C. The study area in this semi-arid region is characterized by lowland hills and undulating topography, with lowest and highest altitudes of 209 and 292 m asl. According to the DZGD (2010) soil map, the study area contains predominantly Luvisols, with Vertisols in a few locations. The vegetation of the forest is said to be mesic savanna (Ratnam et al. Reference RATNAM, BOND, FENSHAM, HOFFMANN, ARCHIBALD, LEHMANN and SANKARAN2011), or dry scrub forest (Davis Reference DAVIS1964).
Location, layout of the 25 systematic and nine additional sample quadrats (20 × 20 m) and the spatial distribution of community types in the Taungphila reserved forest in central Myanmar. Numbers 1–6 adjacent to each quadrat (except bare quadrats) indicate community types 1–6.

Disturbance history
The study area is surrounded by permanent agricultural fields and 23 long-settled villages (c. 5300 households) located within 3–5 km of the forest. As early as 1940, the study area had been covered with natural remnant forest vegetation that had been continuously threatened by lopping, overgrazing and minor cutting of trees (pers. comm. with local people). In order to protect the threatened natural vegetation, the area was officially designated as a reserved forest in 1985. However, in 1988 Myanmar experienced nationwide democracy movements that lasted nearly 1 y. During this period, local people intensively cut the forest for household poles and posts, firewood and agricultural implements, rendering the whole area over-exploited. Since then, the government has strengthened the protection of the forest through the staffing of permanent base camps, frequent patrols and fire protection. Based on this history, secondary succession in the forest began in 1989, although slight disturbances due to lopping and cattle grazing continue to this date. Unfortunately, the quantitative structure and composition of the pre-disturbance condition of the forest are unavailable due to a lack of documentation. Outbreaks of wildfire are uncommon with only one surface fire occurring in 2007. Infrequent fires may be related to the Government's protection of the forest as well as the surrounding agricultural practices of not burning agricultural residues.
METHODS
Vegetation and soil sampling
Twenty-five quadrats (20×20 m) were placed systematically at 800-m intervals across the study area with the aid of a Garman GPSMAP 62s (Figure 1). Although the systematic quadrats were evenly distributed in the study area, they did not encompass the complete spatial variation of species composition in the study area. Thus, an additional nine quadrats of the same size were arbitrarily placed to cover the remaining variation in species composition (Figure 1). A species-area curve was used to evaluate the adequacy of the sample size. Within each quadrat, measurements included the diameter at breast height (dbh) for all trees ≥3 cm dbh. Individual trees were also classified as either single-stemmed individuals or multiple-stemmed individuals in order to evaluate resprouting during secondary succession. Specifically, if a tree had a single stem with a single trunk at or near the soil surface, it was recorded as a single-stemmed individual. If a tree emerged from a single root mass but had multiple stems, each with separate trunks at or near the soil surface, then it was recorded as a multiple-stemmed individual. We recorded the number of multiple stems per individual and their dbh to calculate total basal area of each individual. Plant specimens were collected, and species identification was conducted following the nomenclature of Kress et al. (Reference KRESS, DEFILIPPS, FARR and KYI2003).
In the sample quadrats, soil samples were collected from three layers (0–10 cm, 10–30 cm and 30–60 cm) using a 100-ml (20 cm2 × 5 cm) sampling cylinder at triplicate positions in each layer. Soil hardness and depth were measured using a cone dynamic penetrometer (S06-M, Tsukuba Maruto). The penetrometer comprised a long steel rod equipped with a cone with a pointed tip at the end (60° angle) and a 5-kg dropping weight (i.e. a hammer). The hammer was dropped from a height of 50 cm on an anvil fixed to the rod. The resulting measure of soil hardness (or compaction) is a quantitative value, Nc, equal to the number of hammer drops required to penetrate a soil thickness of 10 cm. Soil depth corresponds to the thickness of soil from the ground surface to the maximum soil depth where Nc < 50. Five replicate measurements of soil hardness and depth were conducted per quadrat and then were averaged to determine the soil hardness and depth of a given quadrat. Vegetation and soil sampling were conducted from November to December 2012 in order to minimize the effect of moisture content on soil compaction during the rainy and hot seasons. Of the 34 quadrats (25 systematic quadrats plus nine additional quadrats), vegetation and soil surveys were conducted in only 30 quadrats since four bare quadrats were excluded.
Laboratory analysis
Soil texture was determined using a 10-g subsample and the pipette method following the procedure of Klute (Reference KLUTE1986). Soil pH was measured in a 1:2.5 (soil:deionized water) soil solution with a pH meter (HM-30G, DKK-TOA Corporation). Electrical conductivity was measured in a 1:5 (soil:deionized water) soil solution with a conductivity meter (ES-51, Horiba). Total C and total N were determined using a N/C analyser (JM1000, J-Science Lab). Available P was determined by the Bray-2 method (Sparks et al. Reference SPARKS, PAGE, HELMKE and LOEPPERT1996) on a 2-g soil subsample.
Data analysis
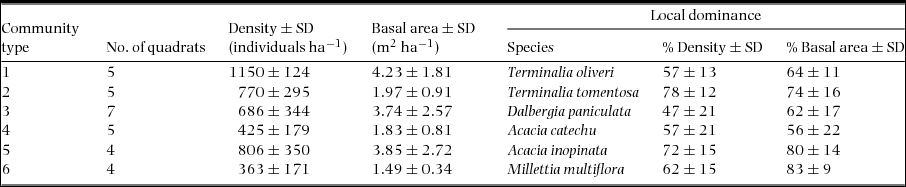
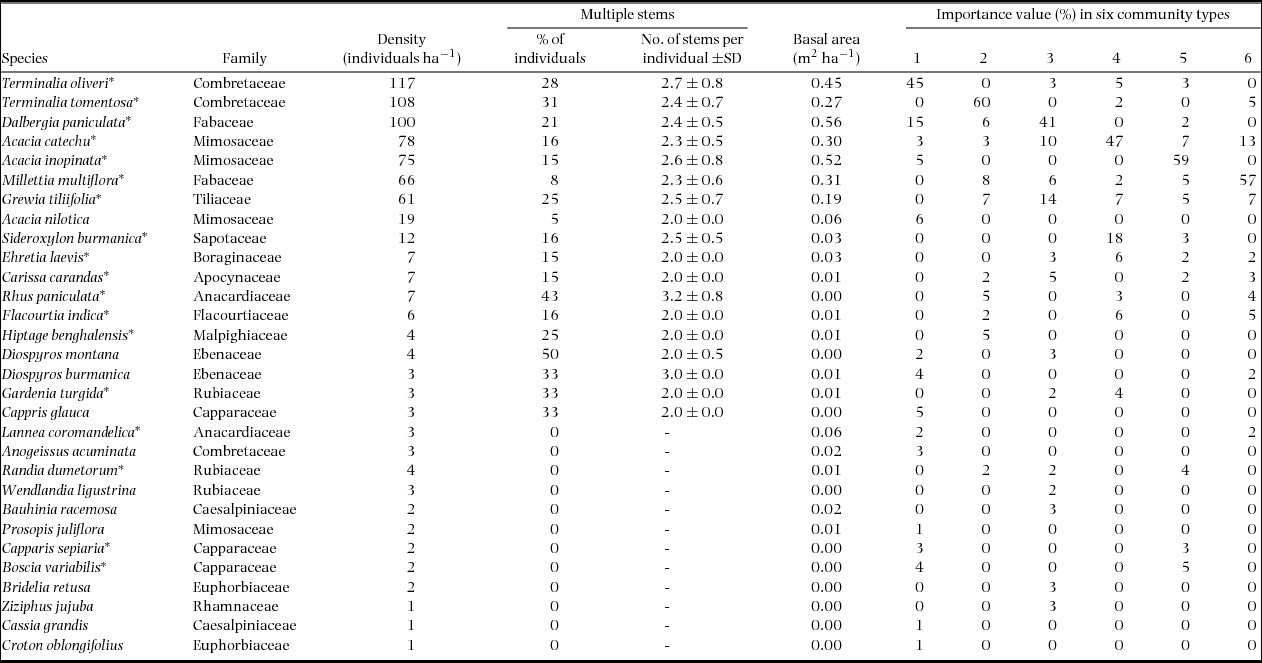
Species richness was estimated using the first-order jack-knife estimator (Heltshe & Forrester Reference HELTSHE and FORRESTER1983, Palmer Reference PALMER1990). To evaluate spatial variation in species composition, the sample quadrats were grouped into clusters through hierarchical cluster analysis based on the basal area of each species (Table 1). The species composition of each cluster (i.e. community type) was represented by an importance value (% relative density + % relative frequency + % relative dominance / 3) for each species (McCune & Grace Reference MCCUNE and GRACE2002). Canonical correspondence analysis (CCA) was used to investigate associations between species and soil. Since we measured a large number of environmental variables (i.e. 24 properties = 8 properties × 3 layers; Table 2) relative to the number of quadrats (30), which should be avoided in CCA, the data were reduced before CCA to avoid inflating the power of the analysis (McCune & Grace Reference MCCUNE and GRACE2002). To accomplish this, principal component analysis (PCA) of the correlations between soil properties was used to identify and remove collinear variables prior to performing the CCA.
Number of sample quadrats (20 × 20 m), mean density (≥ 3 cm dbh) and mean basal area (≥3 cm dbh) in the six community types in the Taungphila reserved forest. Local dominance of species is indicated by the mean proportions (%) of total density and total basal area in the community types.
Physicochemical properties (mean ± SD) of soil collected from three different layers in the 30 quadrats (20 × 20 m) in the Taungphila reserved forest. EC = electrical conductivity. SD represents spatial variation among the quadrats.

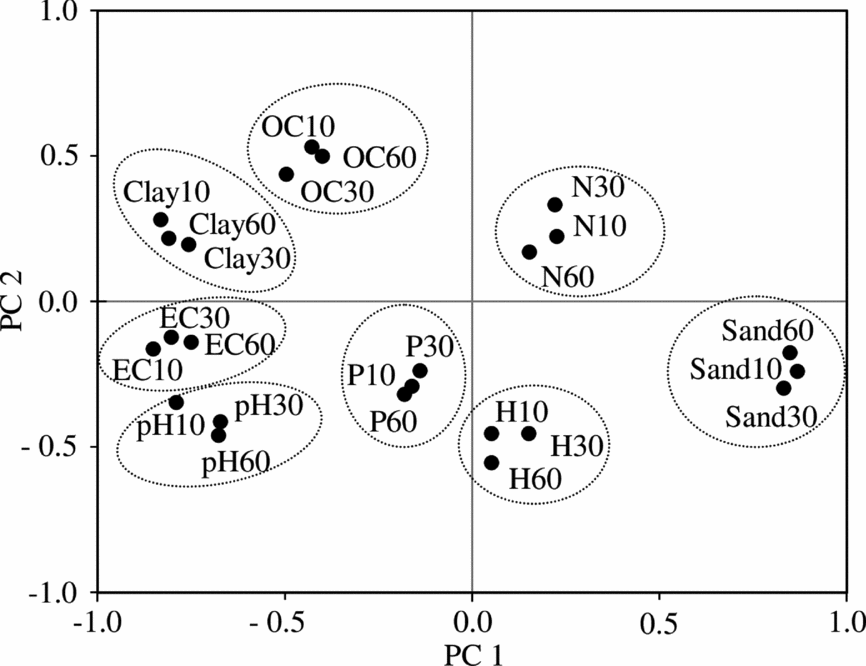
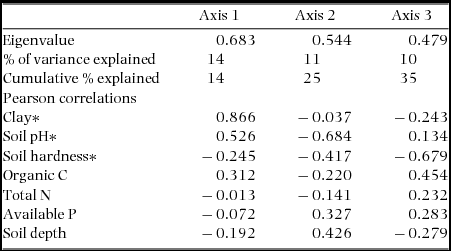
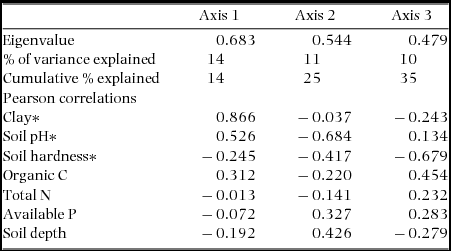
Based on the PCA results (Figure 2), we selected the surface layer (0–10 cm) as a proxy layer for the entire profile for use in the CCA. In conducting the CCA, the basal area of each species was used to define species abundance, and physicochemical soil properties were selected as environmental variables. Additionally, a Monte Carlo randomisation test with 999 runs was used to test the null hypothesis of no relationship between species and soil properties. The intra-set Pearson product-moment correlation coefficients were calculated for environmental variables and CCA axes (Table 3). Environmental variables with a correlation of greater than |0.6| (Table 3) with any of the major axes were interpreted as strong variables that influenced species assemblages in the area. All statistical analyses were performed using PC-ORD (ver. 5.10, MjM Software Design).
Principal component analysis examining the correlations of the 24 soil variables from three different layers in the 30 quadrats (20 × 20 m) in the Taungphila reserved forest. The first two principal components (PCs) explained 59% of the total variance (39% and 20% for PC1 and PC2, respectively). Dotted ovals indicate collinear relationships within individual soil properties among the three layers. Soil properties are represented by closed circles: Sand = percentage of sand, Clay = percentage of clay, pH = soil pH, EC = electrical conductivity, H = soil hardness, OC = percentage of organic C, N = percentage of total N and P = available P. The numbers adjacent to each property represent the soil layer: 10 = surface layer (0–10 cm), 30 = subsurface layer (10–30 cm) and 60 = deeper layer (30–60 cm).
Results from canonical correspondence analysis based on the basal area of woody plant species and seven soil (0–10 cm) variables in the 30 quadrats (20 × 20 m) in the Taungphila reserved forest. Soil variables that are strongly correlated with any of the major axes are indicated by asterisks (i.e. coefficient of correlation greater than |0.6| with any of the major axes).
RESULTS
Vegetation patterns and locally dominant species in secondary succession
The overall density and basal area of the forest were 706 individuals ha−1 and 2.92 m2 ha−1, respectively. Of the individuals, 82% were smaller than 9 cm dbh, and the remaining 18% (i.e. individuals ≥9 cm dbh) comprised 50% of the total basal area in the 30 quadrats. We observed a total of 30 woody plant species from 16 families in the 30 quadrats (Appendix 1). The species-area curve approached an asymptote and the species richness of the entire forest was estimated to be 36 using the first-order jack-knife estimator. Of the observed species, 60% (18 of 30 species) were represented by multiple-stemmed individuals, perhaps resprouts from stumps (Appendix 1). This observation suggested a mode of vegetative regeneration during the secondary succession of the forest.
The 30 quadrats were grouped into six clusters using hierarchical cluster analysis, hereafter referred to as community types 1–6 (Table 1). The mean density of these community types varied from 363 to 1150 individuals ha−1 and the basal area ranged from 1.49 to 4.23 m2 ha−1 (Table 1). Each community type was dominated by a single species: Terminalia oliveri, Terminalia tomentosa, Dalbergia paniculata, Acacia catechu, Acacia inopinata and Millettia multiflora. These dominant species accounted for 47–78% of the total density and 56–83% of the basal area of the community types (Table 1), highlighting the local dominance of single species in the community types. Community types 1–6 were spatially segregated forming a mosaic pattern, i.e. each community type was distributed in patches across the study area (Figure 1).
Edaphic factors and their filtering effects on species assemblages
There was considerable variation in sand content, clay content, soil pH, EC and soil hardness, reflecting the spatial heterogeneity of the soil environment across the study area, but less variation in total N, available P and organic C (Table 2). The soil depth was shallow with an average ± SD thickness of 46 ± 23 cm. The first two components of PCA, which explained 59% of the total variance, indicated that collinear relationships existed within individual soil properties among the three layers (Figure 2). The soil pH and electrical conductivity were strongly and positively correlated, whereas the per cent clay content and per cent sand content exhibited strong negative relationships on the component loadings graph (Figure 2).
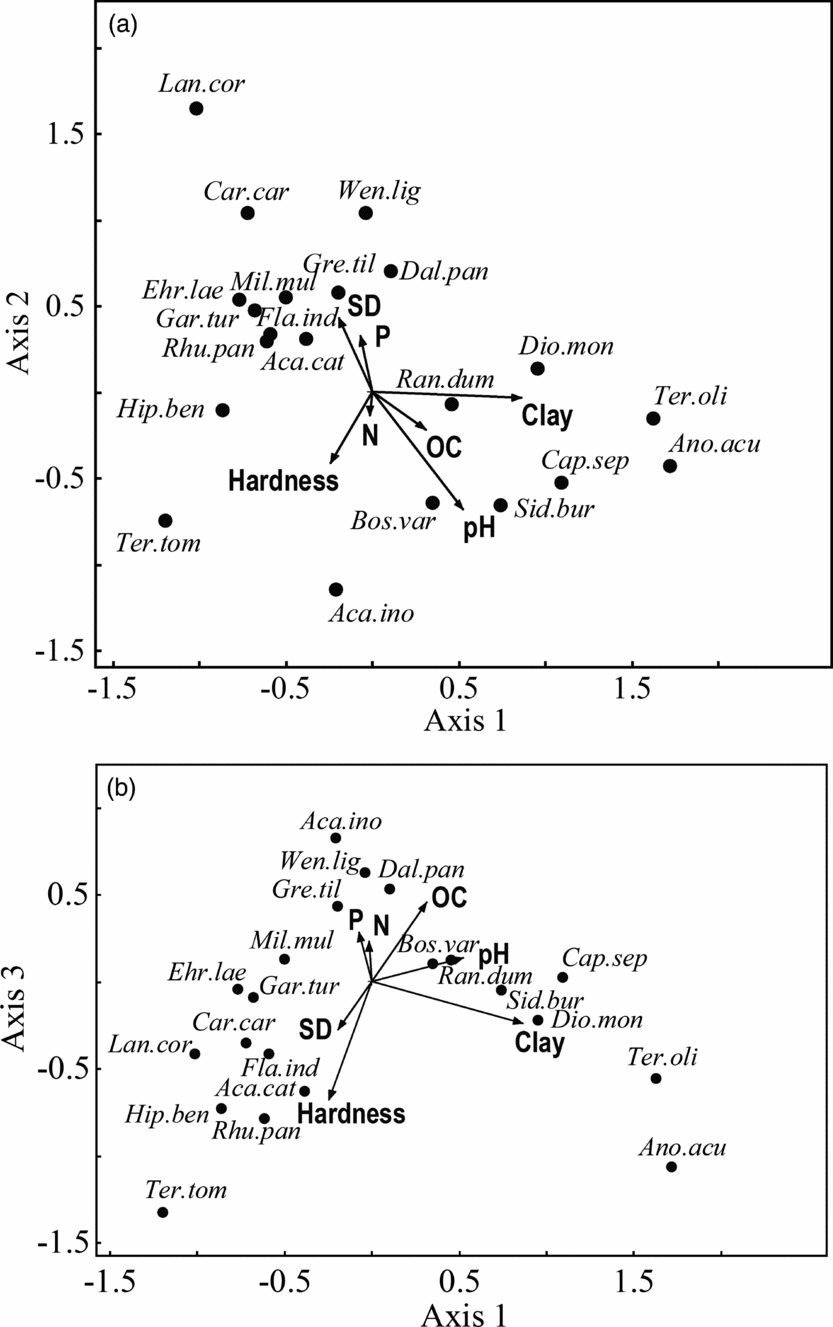
Regarding CCA conducted after the exclusion of collinear soil variables, a Monte Carlo randomization test confirmed a strong species–environment correlation (r = 0.936, P < 0.05). The first three canonical axes explained 35% of the total variation in the species data (Table 3). The first CCA axis was strongly and positively correlated with clay content (i.e. correlations of greater than |0.6|; Table 3). This indicated that soil texture was a major driver of floristic pattern differences in the dry forest. Only a few species, including T. oliveri, scored positively along CCA axis 1 suggesting these species have a limited distribution in higher-clay-content soils (Figure 3a). Species such as A. catechu and M. multiflora that scored negatively along this axis likely preferred sandy soils (or lower-clay-content soils). Soil pH was strongly and negatively correlated with CCA axis 2 (Table 3), implying it is a reasonable factor for explaining the species distribution patterns. Species such as A. inopinata that were located in the lower part of the CCA ordination diagram (Figure 3a) had a strong association with higher soil pH. The third CCA axis was strongly and negatively correlated with soil hardness (Table 3), indicating that species scoring negatively along the axis (e.g. T. tomentosa) were associated with soil hardness (i.e. compaction; Figure 3b). However, species such as D. paniculata likely preferred soil with an average soil texture, lower pH and lower hardness (Figures 3a, b).
Canonical correspondence analysis (CCA) based on the basal area of woody plant species and seven variables of the surface-layer (0–10 cm) soil and soil depth in the 30 quadrats (20 × 20 m) in the Taungphila reserved forest. CCA diagram of axis 1 and 2 showing distributions of species along soil texture (clay content) and pH gradients (a). CCA diagram of axis 1 and 3 showing distributions of species along an additional gradient of soil hardness (b). Species found in fewer than 5% of the quadrats were excluded from the analysis to avoid spurious effects due to rare species (McCune & Grace Reference MCCUNE and GRACE2002). Plant species are represented by closed circles, and species labels are abbreviated by taking the first three letters from the genus name and the first three letters from the species name (see full names in Appendix 1). Soil variables are indicated by arrows: Clay = percentage of clay, pH = soil pH, Hardness = soil hardness, OC = percentage of organic C, N = percentage of total N, P = available P and SD = soil depth.
DISCUSSION
Vegetation patterns and locally dominant species in secondary succession
In this study, we observed a relatively higher overall density of 706 individuals ha−1 (≥3 cm dbh) in a dry scrub forest relative to a prior study of an Indian thorn scrub forest (156 individuals ha−1, >5 cm dbh; Joseph et al. Reference JOSEPH, REDDY, PATTANAIK and SUDHAKAR2008), but a lower density than that observed in Mexican dry forests (3592 stems ha−1, ≥3 cm dbh; White & Hood Reference WHITE and HOOD2004). The observed basal area (2.92 m2 ha−1, ≥3 cm dbh) was lower than that of the same scrub and dry forests (6.0 m2 ha−1 and 20.7 m2 ha−1 in India and Mexico, respectively). This low basal area is the result of a small number of large individuals (i.e. only 18% of individuals were larger than 9 cm dbh). We observed relatively low species richness (30 species) compared with the aforementioned thorn scrub forest of India (35 species) and dry forests of Mexico (up to 93 species). However, the species richness (36 species) estimated using the jack-knife estimator suggests that the sampling design achieved sufficient sampling of the majority of the species in the forest (83% = 100 × 30/36).
The composition of present-day species in our disturbed dry forest seems to have been determined by the pre-disturbance vegetation. This may be due to the incidence of species with multiple-stemmed individuals (Appendix 1) and the resprouting capability of these species (Appendix 1). Similar observations have been made by Imbert & Portecop (Reference IMBERT and PORTECOP2008) in Guadeloupe after a hurricane and by Lévesque et al. (Reference LÉVESQUE, MCLAREN and MCDONALD2011) in Jamaica after experimental cutting. These studies found only minor changes in species composition, likely due to the high proportion of species producing coppice shoots. Additionally, our results demonstrate that the study area was a mosaic of six community types; each included a locally dominant species (Table 1). These locally dominant species, which have a resprouting mechanism, are likely superior competitor species that are successful in the stressful dry-forest environment. Our results suggest that pioneer species neither colonized the entire disturbed area at the beginning of secondary succession nor were subsequently replaced by late-successional species. This observation supported our first hypothesis that secondary succession is not initially led by pioneer species, but instead, by superior competitor species capable of resprouting.
Edaphic factors and their filtering effects on species assemblages
The soil clay content (11% ± 10%; Table 2) was higher than that (3–6%) in tropical dry forests of India reported by Raghubanshi et al. (Reference RAGHUBANSHI, SAGAR and SINGH2003). This could be related to the local geology. However, the organic C (0.89% ± 0.46%), total N (0.06% ± 0.02%) and available P (0.0004% ± 0.0002%) in the study area were lower than the levels (1–3%, 0.10–0.15% and 0.007–0.011%, respectively) found in the same Indian dry forests. The low levels of nutrients were possibly due to low biomass decomposition rates related to the observed low basal area. The soil pH of the study area (8.1 ± 1.4) was markedly higher than that of some other tropical dry forests (e.g. 6.9–7.5 in Mexico; White & Hood Reference WHITE and HOOD2004). The higher soil pH could be due to less water percolation and insufficient leaching of salt compounds (Juo & Franzluebbers Reference JUO and FRANZLUEBBERS2003). The average ± SD soil depth (46 ± 23 cm) in our forest was shallower than that in dry deciduous forests (79 ± 27 cm) of Thailand observed by Murata et al. (Reference MURATA, OHTA, ISHIDA, KANZAKI, WACHIRINRAT, ARTCHAWAKOM and SASE2009). Based on the classification used by Ohnuki et al. (Reference OHNUKI, KIMHEAN, SHINOMIYA and TORIYAMA2008), we did not observe any soft soils (0 < Nc ≤ 5) but identified fairly hard to hard (5 < Nc ≤ 50) soils, indicating a high degree of soil compaction (hardness) in the study area.
Soil water-holding capacity is largely determined by soil texture (Ramade Reference RAMADE1981) with sandy soils mostly having low water-holding capacity, whereas soils with higher clay content often have a higher capacity. Our results highlighted remarkable associations of species, such as A. catechu, D. paniculata, T. oliveri and M. multiflora, with soil texture in terms of the clay content gradient (Figures 3a, b). Similar to water-holding capacity, alkali soils may host specific species communities. In the current study, some sites had unusually high soil pH (i.e. 9–10), and only a few species such as A. inopinata occurred at these sites, perhaps due to the exclusion of other species as a result of the higher pH. Other edaphic factors affected species distributions; for example, soil hardness was associated with specific species such as T. tomentosa (Figure 3b). This is likely because competing species do not grow well in hard soil that limits seedling root contact with the ground or limits seedling survival due to water stress conditions after establishment (Lloret et al. Reference LLORET, CASANOVAS and PEÑUELAS1999). Based on these findings, our second hypothesis that species distributions are primarily determined by the filtering effects of edaphic conditions was adequately supported.
In conclusion, our results indicate that a secondary dry forest can recover from heavy anthropogenic disturbance and, in the case of the study area, can accumulate a low basal area even while in secondary succession for over two decades. Colonization by pioneer species was not evident in the secondary succession forest. The study results also provide insights into site factors that result in the spatial specificity of some species and the potential use of these species in facilitating the recovery of secondary dry forests. Based on the combined inferences from soil–species relationships and the resprouting nature of the species examined, we expect that the dry-forest species retain these soil–species relationships despite heavy disturbances.
ACKNOWLEDGEMENTS
This research would not be possible without the support of the Japanese Government (Monbukagakusho: MEXT) Scholarship Programme. This work was financially supported by JSPS KAKENHI Grant Numbers 22251004 and 23248055. We highly appreciate the Forest Department and the Dry Zone Greening Department of Myanmar for their kind collaborations. We would like to thank Mr Nay Htun, Mr Tin Maung Htun, Mr Paw Oo and Mr Ohn Kyaing for their assistance in the field. Last but not least, the anonymous reviewers are also acknowledged for their valuable comments and suggestions.
Density abundance, multiple stems and basal area of the 30 woody plant species (individuals ≥3 cm dbh) observed in the 30 sample quadrats (20 × 20 m) examined in the Taungphila reserved forest. The species composition of each community type is represented by an importance value (% relative density + % relative frequency + % relative dominance / 3) for each species. Species that Sann et al. (unpubl. data) proved could resprout after experimental cutting of the above-ground biomass are indicated by asterisks.