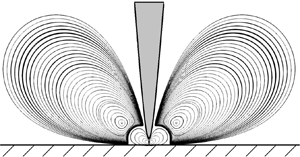



1. Introduction
The formation and evolution of vortices in fluid flows have long been of great interest to fluid dynamicists. In a Stokes flow, Moffatt (Reference Moffatt1964) first theoretically determined and characterised a sequence of counter-rotating vortices in the corner flow between two planes (at least one of which is a solid boundary). Moffatt calculated analytically the size ratio and the intensity ratio of successive vortices. After this seminal work, Moffatt-like eddies have been observed and studied in many other flow settings, such as the flow in a sudden expansion (Alleborn et al. Reference Alleborn, Nandakumar, Raszillier and Durst1997), backward-facing step flows (Biswas, Breuer & Durst Reference Biswas, Breuer and Durst2004) and lid-driven cavity flows (Biswas & Kalita Reference Biswas and Kalita2018). In the context of electrohydrodynamics (EHD) flows, the Moffatt-like eddies were observed only very recently by Perri et al. (Reference Perri, Sankaran, Kashir, Staszel, Schick, Mashayek and Yarin2020, Reference Perri, Sankaran, Staszel, Schick, Mashayek and Yarin2021) in their experiments. Their experimental device consists of a grounded plate and a needle electrode placed vertically above it. Their results showed that the Moffatt-like vortices appeared when a sufficiently high voltage was applied, and the experimental results agreed with the theoretical predictions of the Moffatt-type vortices between two concentric conical surfaces (Malhotra, Weidman & Davis Reference Malhotra, Weidman and Davis2005). Inspired by their work, we are interested in exploring numerically and characterising the Moffatt-type eddies in the EHD flow between a hyperbolic blade electrode and a flat plate electrode. In the following, we will first review works on Moffatt eddies in general, and then summarise studies on the EHD flow in a blade/needle–plate configuration. Finally, we will explain the motivation of this work and define its position in the literature.
1.1. Moffatt eddies
Moffatt eddies refer to a sequence of eddies that develop in a corner between two planes as a result of an arbitrary disturbance imposed at a large distance or near the corner (Moffatt Reference Moffatt1964). Moffatt showed that such eddies in a Stokes flow will form when the angle between the two planes is less than about  $146^\circ$. The formation of these eddies has also been explained mathematically from the perspective of flow singularities in the Navier–Stokes equations at the perfectly sharp corner (Moffatt & Mak Reference Moffatt and Mak1999; Moffatt Reference Moffatt2019). The existence of these vortices was verified in flow visualisation experiments by Taneda (Reference Taneda1979). Meanwhile, the Moffatt-type eddies in different geometries have been observed and studied. A sequence of viscous eddies was found and studied between two spherical surfaces (Davis et al. Reference Davis, O'Neill, Dorrepaal and Ranger1976), and between a cylinder and a plane (Davis & O'Neill Reference Davis and O'Neill1977). The axisymmetric flow of a viscous fluid within rigid conical surfaces was investigated by Wakiya (Reference Wakiya1976), and the largest semi-angle of the cone generating Moffatt-like eddies was found to be
 $80.9^\circ$. Moffatt & Duffy (Reference Moffatt and Duffy1980) examined the pressure-driven flow along a duct with a sharp corner and found that when the corner angle is larger than
 $90^\circ$, the local similarity solution is valid. Weidman & Calmidi (Reference Weidman and Calmidi1999) studied the Stokes flow in a cone bounded by stress-free surfaces and driven by gravity parallel to the conical axis. More recently, Shankar conducted a series of work on the Moffatt-type eddies in a cylindrical container (Shankar Reference Shankar1997, Reference Shankar1998), a semi-infinite wedge (Shankar Reference Shankar2000) and a cone (Shankar Reference Shankar2005). The Moffatt eddies in a circular cone were also examined by Malyuga (Reference Malyuga2005), where the flow is driven by a non-zero velocity applied to the boundary. Malhotra et al. (Reference Malhotra, Weidman and Davis2005) investigated the Moffatt vortices in an asymmetric double-cone geometry. Later, Scott (Reference Scott2013) explored the three-dimensional Moffatt eddies in a trihedral cone formed by three orthogonal planes. Kirkinis & Davis (Reference Kirkinis and Davis2014) predicted the presence of Moffatt vortices in a moving liquid wedge between a gas–liquid interface and a rigid boundary. It can be summarised that theoretical analyses of the Moffatt eddies in different geometries have been of interest for fluid dynamicists for a long time.
In addition to the theoretical work, numerical simulation techniques have also been adopted to study Moffatt eddies. The first numerical computation mentioning Moffatt vortices, to the best of our knowledge, was the work of Burggraf (Reference Burggraf1966) on the lid-driven cavity flow at a moderate Reynolds number (quantifying the ratio of inertia to viscosity). Much later, Magalhães et al. (Reference Magalhães, Albuquerque, Pereira and Pereira2013) performed the numerical simulations of lid-driven cavity flows and found that the small eddies in the corner of a creeping flow agreed well quantitatively with the theory of Moffatt (Reference Moffatt1964). In the numerical simulations of the lid-driven cavity flow by Biswas & Kalita (Reference Biswas and Kalita2016, Reference Biswas and Kalita2018), three eddies of Moffatt type were observed, and their size and intensity ratios corroborated the theoretical values in Moffatt (Reference Moffatt1964). In addition, the Moffatt eddies were also observed and discussed in other numerically simulated flows. Biswas et al. (Reference Biswas, Breuer and Durst2004) investigated numerically two- and three-dimensional laminar backward-facing step flows within a wide range of Reynolds numbers. For the two Moffatt eddies that the authors simulated at a finite Reynolds number, their size ratio agreed well with the theoretical value in Moffatt (Reference Moffatt1964). Moreover, Moffatt eddies have also been observed in a sudden expansion by Alleborn et al. (Reference Alleborn, Nandakumar, Raszillier and Durst1997) (in the limit of creeping flows). Their numerical results of the streamfunction field showed a high degree of resemblance with the theoretical result in Moffatt (Reference Moffatt1964). Additionally, Moffatt vortices can also exist in some multi-physical flows. For example, the Moffatt-type vortices in thermocapillary convection were analysed by Davis (Reference Davis1989) and Kuhlmann, Nienhüser & Rath (Reference Kuhlmann, Nienhüser and Rath1999). As mentioned above, the Moffatt-like eddies in EHD flows have been reported by Perri et al. (Reference Perri, Sankaran, Kashir, Staszel, Schick, Mashayek and Yarin2020, Reference Perri, Sankaran, Staszel, Schick, Mashayek and Yarin2021) in their experiments and simulations. In order to help the reader to understand the EHD flows in general, we will introduce below a literature survey of the EHD flows and then discuss in detail the work of Perri et al. (Reference Perri, Sankaran, Kashir, Staszel, Schick, Mashayek and Yarin2020, Reference Perri, Sankaran, Staszel, Schick, Mashayek and Yarin2021).
1.2. EHD flows in a blade/needle–plate configuration
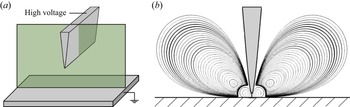
Electrohydrodynamics (EHD) studies the complex interaction between an electric field and a flow field; the flow field is driven by the electric force and at the same time influences the latter. This is an interdisciplinary subject of electromagnetism and hydrodynamics (Castellanos Reference Castellanos1998). It has broad prospects of applications in many scientific and industrial fields. In the study of EHD, the characteristics of the electric field play an important role in determining the dynamics of the electrified flow, such as the geometry of the electrodes and their arrangement. Accordingly, the research on EHD flow can be divided roughly into two categories: uniform electric fields (including parallel plates, concentric rings and balls) and non-uniform electric fields (including needle–plate, blade–plate, wire–plate, needle–ring and sphere–plane) (Suh Reference Suh2012). The configuration of a uniform electric field is beneficial for fundamental studies as it peels off unnecessary components that may complicate the theoretical treatment. This line of research has been followed by many researchers in the past decades, including, most notably, Castellanos and co-workers (Pérez & Castellanos Reference Pérez and Castellanos1989; Castellanos Reference Castellanos1991, Reference Castellanos1998; Vázquez, Pérez & Castellanos Reference Vázquez, Pérez and Castellanos1996; Chicón, Castellanos & Martin Reference Chicón, Castellanos and Martin1997) and Atten and co-workers (Lacroix, Atten & Hopfinger Reference Lacroix, Atten and Hopfinger1975; Atten & Lacroix Reference Atten and Lacroix1979; Malraison & Atten Reference Malraison and Atten1982; McCluskey & Atten Reference McCluskey and Atten1988). However, although much useful flow information has been extracted in studying this (geometrically) simple EHD flow, when it comes to the practical applications of EHD, the non-uniform electric field electrode configuration is more relevant. For example, the needle–plate EHD configuration is widely used in electrospray techniques (Fenn et al. Reference Fenn, Mann, Meng, Wong and Whitehouse1989). In fact, it is easier for the ions to overcome the potential energy barrier and be pushed to the collector using a sharp electrode (Grassi & Testi Reference Grassi and Testi2006). In the electrode structure with a non-uniform electric field, the flow will be strongly non-parallel and non-stationary. In this work, we will focus on the blade–plate configuration, as illustrated in figure 1. We summarise in the following the research on the EHD flow in the blade–plate and needle–plate configurations.
(a) Sketch of the blade–plate electrodes in our EHD flow problem. (b) Streamlines in a two-dimensional cross-section (shaded green in (a)).

The blade–plate EHD flow has been studied in some early experiments by Tobazeon, Haidara & Atten (Reference Tobazeon, Haidara and Atten1984) and Haidara & Atten (Reference Haidara and Atten1985). Atten, Malraison & Zahn (Reference Atten, Malraison and Zahn1997) investigated the EHD flow in a needle–plate geometry both experimentally and theoretically. The electrical current versus the tip–plate distance and the applied voltage were determined experimentally. In addition, their theoretical analysis estimated the axial velocity, although at variance with the experimental results. The linear stability of a laminar EHD flow between a blade and a plate has been analysed using a small-disturbance method by Pérez, Vázquez & Castellanos (Reference Pérez, Vázquez and Castellanos1995), and the results indicated that a smaller charged layer thickness renders the flow more unstable. Their experimental results were consistent qualitatively with their stability analysis, but quantitative differences existed. In the blade/needle–plate EHD flow, the so-called EHD plume structure will emerge, similar to the thermal plumes in the natural convection. Vázquez et al. (Reference Vázquez, Pérez and Castellanos1996) studied and compared the dynamics of the thermal plumes and the EHD plumes. Their results showed that the equations describing the EHD plumes and the thermal plumes are equivalent under some assumptions at very large Prandtl number (ratio of momentum diffusivity to thermal diffusivity). Later, Pérez et al. (Reference Pérez, Traore, Koulova-Nenova and Romat2009) analysed the blade–plate EHD flow driven by the charge injection from a grid point. They found that with the increase of electric Rayleigh number ( $T$, quantifying the ratio between the Coulomb force and the viscous force), three different regimes could be observed: steady laminar, periodic and fully turbulent. Moreover, their results showed that the parameter
 $M$ (which is the ratio between the hydrodynamic mobility to the ionic mobility) did not affect the dynamics of the EHD plume. Wu et al. (Reference Wu, Traore, Louste, Koulova and Romat2013) and Traore et al. (Reference Traore, Wu, Louste, Pelletier and Dascalescu2014) studied numerically the EHD flow between a hyperbolic blade and a plate electrode. In their work, a non-autonomous injection law was considered and was compared with the classical autonomous injection law. It is noted that all the above numerical work ignored the effect of charge diffusion.
Experimental research on the blade/needle–plate EHD flow has been conducted in recent years. Daaboul et al. (Reference Daaboul, Traoré, Vázquez and Louste2017) carried out experiments to investigate the EHD flow of blade–plate geometry based on a particle image velocimetry system. The transition from conduction to injection with the increase of a DC (direct current) voltage was studied, and complex flow patterns related to different charge generation mechanisms were observed. Sankaran et al. (Reference Sankaran, Staszel, Mashayek and Yarin2018) examined the kinetic mechanism of the electrode Faradaic reaction in a vegetable oil between a needle and a plate electrode. Their experiment showed that redox reactions occurred on the needle electrode at a high voltage (about 4 kV), leading to the emergence of a Coulomb force acting on the charged oil and the EHD plume. In addition, the needle–plate EHD flow under a DC or alternating current (AC) electric field was investigated in detail by Sun et al. (Reference Sun, Sun, Hu, Traoré, Yi and Wu2020). The velocity field and current voltage characteristics were discussed and analysed.
In the aforementioned works on the blade–plate or needle–plate EHD configuration, the Moffatt eddies have not been mentioned or characterised. It was Perri et al. (Reference Perri, Sankaran, Kashir, Staszel, Schick, Mashayek and Yarin2020, Reference Perri, Sankaran, Staszel, Schick, Mashayek and Yarin2021) who first discussed the Moffatt eddies in the needle–plate EHD flow. In their experiment, the flow was induced in a canola oil between a high-voltage needle electrode and a grounded plate. Three consecutive counter-rotating Moffatt vortices were observed once the voltage difference was above a threshold, determined to be between  $-$8 and
 $-$12 kV. In addition, the position and structure of the vortices agreed well with the theoretical solutions of the Moffatt vortices between two concentric conical surfaces (Malhotra et al. Reference Malhotra, Weidman and Davis2005). They also observed transient flow phenomena, indicative of a flow bifurcation to another state. Finally, Perri et al. (Reference Perri, Sankaran, Kashir, Staszel, Schick, Mashayek and Yarin2020) also performed numerical simulations of the EHD flow corresponding to their experimental set-up. They presented numerical results on the electric field strength magnitude and charge density. This motivates the current work to investigate further the Moffatt-like eddies in EHD flows by numerical means.
1.3. The current work
From the literature review above, we realise that the Moffatt-like eddies in the blade–plate EHD flow have not been studied thoroughly from a numerical perspective. In this work, we will characterise the intrinsic flow characteristics and properties of the Moffatt-like eddies in the blade–plate EHD flow, supplementing the previous works of Perri et al. (Reference Perri, Sankaran, Kashir, Staszel, Schick, Mashayek and Yarin2020, Reference Perri, Sankaran, Staszel, Schick, Mashayek and Yarin2021) in a needle–plate configuration. More specifically, we will conduct direct numerical simulations (DNS) and global stability analyses of two-dimensional EHD flows between a high-voltage hyperbolic blade electrode and a grounded plate electrode.
In the first part of this work, the steady EHD flow, manifesting itself in the form of Moffatt-like eddies, will be solved numerically using DNS. Different from most previous numerical works reporting Moffatt-like eddies induced by a disturbance at a large distance from the corner, our simulations pertain to the case where the eddies are engendered by the disturbance near the corner. So the intensity of the eddies decreases with increasing distance from the corner. We will compare our numerical results with the theoretical predictions of Moffatt (Reference Moffatt1964). The effect of charge diffusion in the EHD flow will be considered, which was omitted in the numerical simulations of Perri et al. (Reference Perri, Sankaran, Kashir, Staszel, Schick, Mashayek and Yarin2020). In the second part of this work, we will conduct a global stability analysis of the blade–plate EHD flow to probe its global linear dynamics. This is motivated by the consideration of understanding how and when the steady flow may remain stable or become unstable and thus transition to another flow state (Perri et al. Reference Perri, Sankaran, Kashir, Staszel, Schick, Mashayek and Yarin2020). We will show primarily the eigenvectors that can indicate the most important flow region for the perturbative dynamics in this flow. This has become our motivation particularly because we aim to present the results in a more comprehensible manner for the experimentalists working on this flow to explain, e.g. where the disturbances accumulate and develop. There seems to be no previous work in the literature on the stability analysis of this steady EHD flow.
The remainder of this paper is organised as follows. In § 2, we describe the physical problem, present the nonlinear governing equations with boundary conditions, and formulate the framework of the global linear stability analysis. Section 3 introduces the numerical methods. In § 4, we report the numerical results on the Moffatt-like eddies, and analyse their global stability. The conclusion is drawn in § 5, with some discussions on the flow physics. Appendices A and B detail the verification of our numerical simulation and analysis. Appendix C provides a nomenclature of the symbols used in this work.
2. Problem formulation
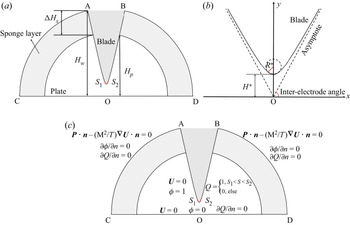
As shown in figure 2(a), we will consider in this work a two-dimensional EHD flow that arises in a dielectric liquid between a flat plate and a blade electrode. The shape of the blade electrode satisfies a hyperbolic equation:
 \begin{equation} \left.\begin{aligned}
x^* & =\sqrt{R^*H^*}\,\mathrm{sinh}(\tau^*),\\ y^* &
=H^*\,\mathrm{cosh}(\tau^*),
\end{aligned}\quad\tau^*\in \mathbb{R}.\right\}
\end{equation}
This is a hyperbola with its centre being the original point  ${\rm O}$, as shown in figure 2(b). In this paper, dimensional variables and parameters are denoted with a superscript
 $^ \ast$. In the above equation,
 $H^*$ represents the distance from the blade tip to the plate electrode,
 $\tau ^*$ defines a particular point on the hyperbola, and
 $R^*$ (red line in figure 2b) is the radius of curvature of the blade tip, which determines the sharpness of the hyperbolic blade. Additionally, we label the angle between the asymptote of the hyperbolic blade and the bottom plate as the inter-electrode angle, following Perri et al. (Reference Perri, Sankaran, Staszel, Schick, Mashayek and Yarin2021), as shown in figure 2(b).
(a) The computational domain in our numerical simulations. The white region is the physical flow domain, and the hatching lines denote the sponge layer, which is used to damp the reflection of the outgoing waves. (b) A sketch of the hyperbolic blade electrode. (c) Specification of the boundary conditions. See the paragraph above (2.2) for the meanings of the variables.

In the current work, the dielectric liquid is assumed to be incompressible and Newtonian, which is characterised by constant permittivity  $\varepsilon ^ *$, density
 $\rho ^*_0$, and viscosity
 $\mu ^*$. A constant electric potential
 $\phi _0^*$ is imposed on the blade electrode, and the plate electrode is grounded, forming a non-uniform electric field between the blade and the plate. Charges are injected from the blade electrode, with the ionic mobility
 $K^\ast$ and charge diffusion constant
 $D_\nu ^ *$. In theory, there are two main mechanisms for charge generation, i.e. the conduction mechanism and the injection mechanism. In the conduction scenario, charges are generated in the liquid as a result of the dissociation–recombination process of a solute or impurity present in the liquid. When the electric field is stronger than a critical value, charge injection can occur, where charges are produced by the electrochemical reaction between the interface of the electrode and the neutral impurities (Atten Reference Atten1996; Daaboul et al. Reference Daaboul, Traoré, Vázquez and Louste2017). Thus in the case of a strong electric field, even though the conduction mechanism may also be at work, the charge injection mechanism will play a leading role. Since this paper considers a strong electric field, we assume an injection mechanism only, that is, unipolar charges with strength
 $Q^\ast _0$ are issued from a fixed region on the hyperbolic blade between points
 $S_1$ and
 $S_2$; see the red portion in figure 2(a). This is also the consideration in the numerical simulations of Perri et al. (Reference Perri, Sankaran, Kashir, Staszel, Schick, Mashayek and Yarin2020).
In order to facilitate the subsequent presentation, we non-dimensionalise the governing equations by appropriate physical scales. The length is non-dimensionalised by  $H^*$ (distance from the blade tip to the plate electrode), the time
 $t^\ast$ by
 ${H^*}^2/(K^\ast \,\Delta \phi ^\ast _0)$ (where
 $\Delta \phi ^\ast _0$ is the potential difference applied to the electrodes), the electric potential
 $\phi ^\ast$ by
 $\Delta \phi ^\ast _0$, the electric density
 $Q^\ast$ by
 $Q^\ast _0$ (injected charge density), the velocity
 ${\boldsymbol {U}^\ast }$ by
 $K^\ast \,\Delta \phi ^\ast _0/H^*$, the pressure
 $P^\ast$ by
 $\rho ^*_0{K^\ast }^2\,\Delta {\phi ^\ast _0}^2/{H^*}^2$, and the electric field
 ${\boldsymbol {E}^\ast }$ by
 $\Delta \phi ^\ast _0/H^*$. Therefore, the non-dimensional equations for the EHD flow read (Castellanos Reference Castellanos1998)
 $$\begin{gather} \boldsymbol{\nabla} \boldsymbol{\cdot} \boldsymbol{U} = 0, \end{gather}$$
 $$\begin{gather}\frac{{\partial \boldsymbol{U}}}{{\partial t}} + (\boldsymbol{U} \boldsymbol{\cdot} \boldsymbol{\nabla})\boldsymbol{U} ={-} \boldsymbol{\nabla} P + \frac{{{M^2}}}{T}\,{\nabla^2}\boldsymbol{U} + C{M^2}Q\boldsymbol{E}+\boldsymbol{F}_{su}, \end{gather}$$
 $$\begin{gather}\frac{{\partial Q}}{{\partial t}} + \boldsymbol{\nabla} \boldsymbol{\cdot} [(\boldsymbol{E} + \boldsymbol{U})Q] =\frac{1}{{Fe}}\,{\nabla^2}Q+F_{sq}, \end{gather}$$
 $$\begin{gather}{\nabla^2}\phi ={-} CQ, \end{gather}$$
 $$\begin{gather}\boldsymbol{E} ={-} \boldsymbol{\nabla} \phi, \end{gather}$$
where
 \begin{equation} M = \frac{\sqrt{\varepsilon ^ */\rho _0^ * }}{K^ * },\quad T = \frac{{{\varepsilon ^ * }\,\Delta \phi _0^ * }}{{{K^ * }{\mu ^ * }}},\quad C = \frac{{Q_0^ * {H^*}^2}}{{\Delta \phi _0^ *\,{\varepsilon ^ * }}},\quad Fe = \frac{{{K^ * }\Delta \phi _0^ * }}{{D_\nu ^ * }}. \end{equation}
The forcing terms  $\boldsymbol {F}_{su}$ and
 $F_{sq}$ are considered due to the artificial viscosity in the sponge layer. They damp the waves and their reflections near the outflow boundary, and will not affect the flow dynamics in the physics domain, to be described shortly. Note that these equations are in principle the same as those used by Perri et al. (Reference Perri, Sankaran, Kashir, Staszel, Schick, Mashayek and Yarin2020), except that the geometries are different in the two works, and we additionally consider the charge diffusion effect (
 $({1}/{{Fe}})\,{\nabla ^2}Q$) in (2.2c). More specifically, the first two equations are the continuity equation and Navier–Stokes equations with additional Coulomb force terms. The last three equations are the Maxwell's equations in the so-called quasi-electrostatic limit (which refers to the case where the charge relaxation time or the electromagnetic waves’ transition time is much shorter than the flow characteristic time; see § 1.2 in Castellanos Reference Castellanos1998).
In the above equations,  $M$ is defined as the ratio between the hydrodynamic mobility and the ionic mobility. The electric Rayleigh number
 $T$ determines the ratio between the Coulomb force and the viscous force, which quantifies the strength of the imposed electric field. The parameter
 $C$ measures the ion injection intensity, and
 $Fe$ is the inverse of the charge diffusion coefficient. The boundary conditions are summarised in figure 2(c) and table 1. We will conduct DNS of these equations to solve for their steady solutions, which are the Moffatt-like eddies in the EHD flow to be presented.
Boundary conditions for numerical simulation of nonlinear blade–plate EHD flow.

2.1. Linearisation
We are also interested in the perturbative dynamics of the steady solution to the nonlinear equations. We will apply the classical global linear stability theory (Theofilis Reference Theofilis2003, Reference Theofilis2011) to study the linearised EHD flows in the blade–plate geometry.
In the linear stability analysis, we evoke Reynolds decomposition of the flow state, which writes the total flow state as the sum of a base flow and a perturbative component, that is,  $\boldsymbol {U}=\bar {{\boldsymbol {U}}}+\boldsymbol {u}$,
 $P=\bar {P}+p$,
 $Q=\bar {Q}+q$,
 $\phi =\bar {\phi }+\varphi$ and
 $\boldsymbol {E}=\bar {\boldsymbol {E}}+\boldsymbol {e}$. The base flow is steady in the current analysis (for example,
 $\bar {{\boldsymbol {U}}}=\bar {{\boldsymbol {U}}}(x,y)$ is not a function of time). Inserting this decomposition into (2.2) and subtracting the base flow, we arrive at the linearised equations for the perturbed variables
 $\boldsymbol {f}=(\boldsymbol {u},p,q,\varphi,\boldsymbol {e})^{\rm T}$:
 $$\begin{gather} \boldsymbol{\nabla} \boldsymbol{\cdot} \boldsymbol{u} = 0, \end{gather}$$
 $$\begin{gather}\frac{{\partial \boldsymbol{u}}}{{\partial t}} + (\boldsymbol{u} \boldsymbol{\cdot} \boldsymbol{\nabla})\bar {\boldsymbol{U}} + (\bar {\boldsymbol{U}} \boldsymbol{\cdot} \boldsymbol{\nabla})\boldsymbol{u} ={-} \boldsymbol{\nabla} p +\frac{{{M^2}}}{T}\,{\nabla^2} \boldsymbol{u} + C{M^2}(q\bar{\boldsymbol{E}} + \bar Q\boldsymbol{e})+\boldsymbol{F}_{su}, \end{gather}$$
 $$\begin{gather}\frac{{\partial q}}{{\partial t}} + \boldsymbol{\nabla} \boldsymbol{\cdot} [(\bar{\boldsymbol{E}} + \bar {\boldsymbol{U}})q+(\boldsymbol{e} + \boldsymbol{u})\bar Q] = \frac{1}{{Fe}}\,{\nabla^2}q+F_{sq}, \end{gather}$$
 $$\begin{gather}{\nabla^2}\varphi ={-} Cq, \end{gather}$$
 $$\begin{gather}\boldsymbol{e} ={-} \boldsymbol{\nabla} \varphi. \end{gather}$$
The boundary conditions for the perturbations are listed in table 2. The above linearised equations can be written in a compact form as
 \begin{equation} \frac{\partial \boldsymbol{f}}{\partial t}=\boldsymbol{L} \boldsymbol{f}, \end{equation}
where  $\boldsymbol {L}$ represents the linearised operator in the blade–plate EHD flow. Since we consider the steady state as the base flow, a wave-like solution for the perturbation can be assumed, which reads
 \begin{equation} \boldsymbol{f}(x,y,t)=\tilde{\boldsymbol{f}}(x,y)\,{\rm e}^{\omega t}. \end{equation}
This expression, inserted into the linear equation (2.5), leads to an eigenvalue problem
 \begin{equation} \omega\tilde{\boldsymbol{f}}=\boldsymbol{L}\tilde{\boldsymbol{f}}, \end{equation}
where  $\omega$ is the complex eigenvalue, with its real part denoting the temporal growth rate of perturbations (i.e. positive
 $\omega$ means growth of the disturbance, and negative
 $\omega$ decay of the disturbance), and its imaginary part representing the phase speed. Correspondingly, the eigenvector is
 $\tilde {\boldsymbol {f}}$.
Boundary conditions for numerical simulation of linear blade–plate EHD flow.

Waves are generated because of the impingement of the charged flow on the plate electrode, and they propagate towards the outer boundary in the computational domain. In order to minimise the reflections of outgoing disturbances from the boundary, a sponge region is applied, shown as hatching lines in figure 2(a). There are different ways to implement the sponge region, and we follow the method of Chevalier, Lundbladh & Henningson (Reference Chevalier, Lundbladh and Henningson2007). An additional volume force is added to the governing equations
 \begin{equation} \boldsymbol{F}_{su}={-}\lambda (r)\,\boldsymbol{u}\quad \text{and}\quad F_q={-}\lambda (r)\,q. \end{equation}
The parameter  $\lambda$ is defined by
 \begin{equation} \lambda (r)= \lambda_{max}\boldsymbol{\cdot} S\left( \frac{r-r_{start}}{\varDelta_{rise}}\right), \end{equation}
where  $\lambda _{max}$ is the maximum strength of the damping,
 $r_{start}$ is the radial position where the sponge region starts, and
 $\varDelta _{rise}$ corresponds to the rise distance of the damping function. The smooth step function
 $S$, using
 $x$ as the argument, reads
 \begin{equation}
S(x)=\left\{\begin{array}{@{}ll} 0, & x\leq 0,\\
1/(1+\exp({1/(x-1)+1/x})), & 0< x<1, \\ 1, & x\geq 1.
\end{array}\right. \end{equation}
3. Numerical methods
In this paper, the computational flow solver Nek5000 (Fischer, Lottes & Kerkemeier Reference Fischer, Lottes and Kerkemeier2008) is used to perform the numerical simulations, which is based on the Legendre polynomial-based spectral-element method (Patera Reference Patera1984). This method has the advantages of both geometrical flexibility of finite-element methods and accuracy of spectral methods. The  $P_N-P_{N-2}$ formulation is used for the spatial discretisation, that is, within each element, the velocity is expressed as a linear combination of Lagrangian basis functions of order
 $N$ on the Gauss–Lobatto–Legendre nodes, whereas the pressure is discretised by Lagrangian interpolants of order
 $N-2$ on the Gauss–Legendre quadrature points. In the current work, we take
 $N=7$ for most cases. The time discretisation scheme adopted in Nek5000 is the semi-implicit scheme
 $BDF_k/EXT_k$, in which the viscous terms are discretised implicitly based on a backward differential formula of order
 $k$, and the nonlinear convection term is advanced explicitly by an extrapolation scheme of order
 $k$. In this work,
 $k=2$ is applied.
For the linear stability analysis, the implicitly restarted Arnoldi method (IRAM; Lehoucq & Sorensen Reference Lehoucq and Sorensen1996) is adopted to compute the eigenpairs of the linear system. IRAM is an iterative eigenvalue solver based on the projection of the problem on an orthogonal basis, in which process a Krylov subspace  $\boldsymbol {K}_n$ of dimension
 $n$ is created. The Krylov subspace of the exponential propagator
 $\mathcal {M}$ and the initial vector
 $\boldsymbol {f}_0$ is defined as
 $\boldsymbol {K}_n(\mathcal{\boldsymbol M},\boldsymbol {f}_0)=\{\boldsymbol {f}_0,\mathcal {M} \boldsymbol {f}_0,\ldots,\mathcal {M}^{n-1}\boldsymbol {f}_0\}$. This Krylov subspace converges at the eigenvector corresponding to the eigenvalue with the largest modulus. This simple iteration is known as the power method, which is simple to perform, but converges slowly and can obtain only the leading eigenpair of the problem. In order to obtain more eigen-information from the iteration, a Gram–Schmidt orthogonalisation process is applied, and the residual information is collected. Eventually, a small-dimensional Hessenberg matrix
 $\boldsymbol{\mathsf{H}}$ is formed to approximate the eigen-information of the exponential propagator
 $\mathcal {M}$, and its eigenpairs can be calculated easily. We use the LAPACK package (Anderson et al. Reference Anderson1999) for IRAM.
4. Results and discussions
In this section, we present the results of DNS and global stability analysis of EHD flows in the blade–plate configuration. At this point, it is instructive to specify the parameter range considered in this work. The typical value of  $Fe$ (inverse of charge diffusion) for the real dielectric fluids lies within the range
 $10^3$–
 $10^4$ (Pérez & Castellanos Reference Pérez and Castellanos1989), thus we choose an intermediate value
 $Fe = 5\times 10^3$ in this work, except in the section where we study its effect. Previous works often neglected this charge diffusion term (Pérez et al. Reference Pérez, Traore, Koulova-Nenova and Romat2009; Wu et al. Reference Wu, Traore, Louste, Koulova and Romat2013; Perri et al. Reference Perri, Sankaran, Kashir, Staszel, Schick, Mashayek and Yarin2020), but it has been shown that the charge diffusion has a non-negligible effect on the linear stability and bifurcation in EHD flows (Zhang et al. Reference Zhang, Martinelli, Wu, Schmid and Quadrio2015; Zhang Reference Zhang2016; Feng et al. Reference Feng, Zhang, Vázquez and Shu2021). Since a strong injection regime has been considered in this work, we take
 $C = 5$. The typical value of
 $M$ is higher than
 $3$ for most dielectric liquids (Pérez & Castellanos Reference Pérez and Castellanos1989), and
 $M=50$ is used in the following. The remaining parameters will be specified in each case to be presented. We also mention that we have used many symbols to denote various flow parameters and define the geometry. For a clearer understanding of the results below, it is useful to consult table 11 in Appendix C for the nomenclature.
4.1. Moffatt eddies
Inspired by the experimental work on the EHD flow in the needle–plate configuration, where the Moffatt-like vortices were observed (Perri et al. Reference Perri, Sankaran, Kashir, Staszel, Schick, Mashayek and Yarin2020, Reference Perri, Sankaran, Staszel, Schick, Mashayek and Yarin2021), we will explore the Moffatt-like eddies in the two-dimensional blade–plate EHD flow. As our flow is in a Cartesian coordinate, the results can be compared to the theoretical prediction by Moffatt (Reference Moffatt1964) for the vortices in a wedge formed by two flat plates and induced by a disturbance near the corner. For a better presentation of the results, in the following, we will first summarise the theoretical results of Moffatt (Reference Moffatt1964).
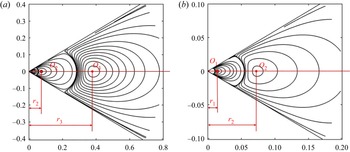
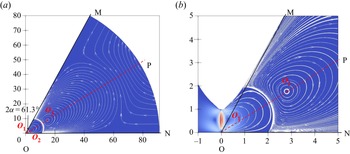
According to the theory developed in Moffatt (Reference Moffatt1964), the flow field in the case of corner angle  $2\alpha =61.3^\circ$ is plotted in figure 3. A sequence of geometrically and dynamically similar vortices is formed, and their centres all fall on the corner bisector. We mark their centres as
 $O_1, O_2, O_3$ (counted from the corner), and denote the distances from the centre to the corner as
 $r_1, r_2, r_3$, respectively. Theoretically, the radial coordinates of the vortex centres of Moffatt are in an equal ratio sequence and satisfy the relationship (Moffatt Reference Moffatt1964)
 \begin{equation} \frac{r_{n+2}}{r_{n+1}}=\frac{r_{n+1}}{r_n}=\frac{r_{n+2}-r_{n+1}}{r_{n+1}-r_n}=\rho, \end{equation}
where  $\rho$ is the ratio dependent only on the angle
 $2\alpha$, and
 $r_n$ is the distance between the corner and the centre of the
 $n$th eddy, counting from the corner. For the case
 $2\alpha =61.3^\circ$, it can be calculated from (3.6) in Moffatt (Reference Moffatt1964) that
 $\rho =5.22$. Therefore, we have in this case
 ${r_{3}}/{r_2}={r_{2}}/{r_1}={(r_{3}-r_{2})}/{(r_{2}-r_1)}=5.22$.
(a) Theoretically predicted streamlines in corner eddies for the corner angle  $2\alpha =61.3^\circ$, based on the theory of Moffatt (Reference Moffatt1964). The flow is induced by a disturbance near the corner. (b) A close-up view of the corner.

Besides, the intensity of two successive eddies follows a constant ratio as well, which according to Moffatt (Reference Moffatt1964) reads
 \begin{equation} \frac{|v_{\theta}|_{n+1/2}}{|v_{\theta}|_{n+3/2}}=\varOmega, \end{equation}
where  $\varOmega$ is also dependent only on the angle
 $2\alpha$, and
 $v_{\theta }$ is the azimuthal velocity. We use
 $|v_{\theta }|_{n+1/2}$ to denote the absolute value of the local maximum azimuthal velocity of the
 $n$th vortex (which can represent the intensity of the vortex). Similarly, the value of
 $\varOmega$ can be obtained theoretically (Moffatt Reference Moffatt1964), and it is equal to
 $710.56$ in the case
 $2\alpha =61.3^\circ$, that is,
 ${|v_{\theta }|_{1+1/2}}/{|v_{\theta }|_{2+1/2}}={|v_{\theta }|_{2+1/2}}/{|v_{\theta }|_{3+1/2}}=710.56$. These equations summarise the flow quantities that we will probe and compare to in our numerical simulations of EHD flows.
4.1.1. Formation of the eddies in the blade–plate EHD flow
In the following, we present and characterise the Moffatt-like eddies in the blade–plate EHD flow. Appendix A furnishes a detailed verification step of the domain size and grid resolution in our computations. We focus on characterising the generation and evolution of the Moffatt eddies in this subsubsection. The parameters here are  $T=500$,
 $C=5$,
 $M=50$,
 $Fe=5\times 10^3$ and
 $R=0.05$.
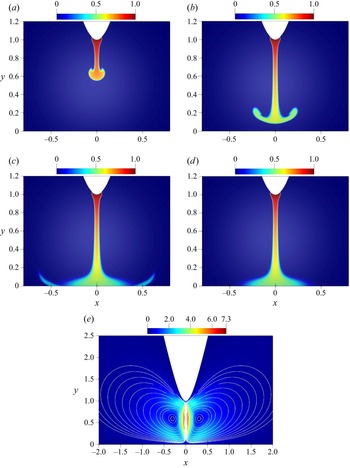
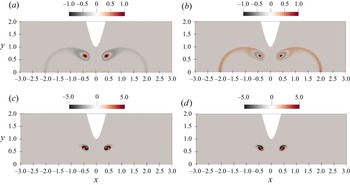
Figures 4(a–d) show that charges are injected from the blade tip and move towards the plate electrode driven by the potential difference, then impinge on the flat plate, leading to the formation of two steady symmetrical vortices in the central region; see figure 4(e). This result is similar to previous numerical simulations in Wu et al. (Reference Wu, Traore, Louste, Koulova and Romat2013) and Pan, He & Pan (Reference Pan, He and Pan2021). It is noted that the flow pattern of the EHD flow here resembles the thermal plume (Vázquez et al. Reference Vázquez, Pérez and Castellanos1996; Lesshafft Reference Lesshafft2015) and the impinging jet flow (Park et al. Reference Park, Suh, Jeon and Kim2004; Meliga & Chomaz Reference Meliga and Chomaz2011).
Evolution of the charge density distribution between the blade injector and the plate electrode at (a)  $t=0.1$, (b)
 $t=0.2$, (c)
 $t=0.4$, (d)
 $t=1.0$. (e) The velocity field at final steady state, and the streamlines. The white region in the middle is due to the clustering of the streamlines. The parameters are
 $T=500$,
 $C=5$,
 $M=50$,
 $Fe=5\times 10^3$ and
 $R=0.05$.

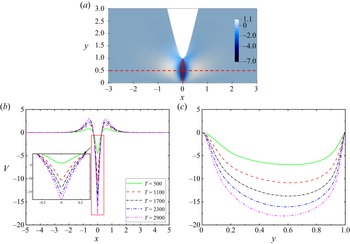
Figure 5(a) shows the distribution of the vertical velocity  $V$ at the final steady state in the case
 $T=500$. Figure 5(b) displays the profile of
 $V$ for different electric Rayleigh numbers
 $T$ probed at the middle horizontal line between the blade and the plate, as shown by the red dashed line in figure 5(a). It indicates that the vertical velocity is symmetrical with respect to the central vertical axis. Its absolute value is largest at the central vertical axis and then rapidly decreases towards both sides. Somewhere around
 $x=0.5$ at the centre of the vortices, the velocity amplitude reaches another local maximum and then gradually decreases to zero with increasing
 $x$. In figure 5(c), the vertical velocity
 $V$ along the central vertical axis (the solid red line in figure 5a) is plotted. We find that the fluid accelerates rapidly near the blade injector (
 $y=1$) and decelerates due to the impingement on the plate. In addition, as expected, increasing
 $T$ increases the absolute vertical velocity because the Coulomb force is proportional to the potential difference, leading to a larger velocity, as shown in both figures 5(b,c).
(a) Contour of vertical velocity at final steady state ( $V$) at
 $T=500$. Vertical velocity profiles at different
 $T$ versus (b)
 $x$ at
 $y=0.5$, (c)
 $y$ at
 $x=0$. The other parameters are the same as in figure 4.

In order to obtain a global view of the velocity amplitude in the flow, figure 6(a) presents the evolution of the maximum velocity magnitude  $|\boldsymbol {U}|_{max}$ in the whole domain. As we can see, its value also increases with increasing
 $T \in [500,2900]$. The typical characteristics of the EHD flow structure discussed above are consistent with those obtained from previous numerical simulations (Park et al. Reference Park, Suh, Jeon and Kim2004; Wu et al. Reference Wu, Traore, Louste, Koulova and Romat2013) and experiments in the injection regime (Yan et al. Reference Yan, Louste, Traoré and Romat2013; Daaboul et al. Reference Daaboul, Traoré, Vázquez and Louste2017; Sun et al. Reference Sun, Sun, Hu, Traoré, Yi and Wu2020). Figure 6(b) depicts
 $|\boldsymbol {U}|_{max}^{s}$, (where the superscript ‘s’ represents the saturated
 $|\boldsymbol {U}|_{max}$ of the final steady state; see figure 6a) as a function of
 $T$ from 500 to 10 000. We find that with the increase of
 $T$,
 $|\boldsymbol {U}|_{max}^s$ increases monotonically in this range of
 $T$. The growth of
 $|\boldsymbol {U}|_{max}^s$ gradually slows down when
 $T$ is large.
(a) Evolution of the maximum velocity norm. (b) Saturated maximum velocity magnitude at the steady state versus  $T$. The other parameters are the same as in figure 4.

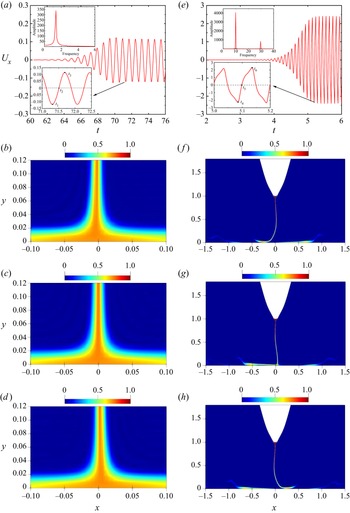
In Perri et al. (Reference Perri, Sankaran, Kashir, Staszel, Schick, Mashayek and Yarin2020), the authors observed transient EHD flows, suggestive of flow bifurcation to another state. In our numerical simulations, we can also observe an unsteady flow when increasing  $T$ in the blade–plate EHD flow. We present the oscillation behaviour at
 $T=3\times 10^4$ in figures 7(a–d) and
 $T=4\times 10^4$ in figures 7(e–h). As shown in figure 7(a), the time evolution of
 $U_x$ sampled at a point
 $(0,0.5)$ at a large
 $T=3\times 10^4$ transitions from stable to periodic oscillation. The corresponding charge density distributions at different times in the half-period, namely
 $t_1$,
 $t_2$ and
 $t_3$ (see bottom inset of figure 7a), are depicted in figures 7(b–d). Note that the magnitude of the oscillating
 $U_x$ is small in this case. Figures 7(b–d) at first sight look the same. Nevertheless, one has to look at them closely to observe that the vertical structure of the charge jet swings from left to right by scrutinising its position relative to the central axis. At larger
 $T=4\times 10^4$, the oscillation becomes more violent. It can be seen from figure 7(e) that the amplitude of the oscillating
 $U_x$ at the point
 $(0,0.5)$ increases (note the range of the
 $y$-axis). The oscillation also seems to deviate from a single-frequency behaviour (unlike the smaller
 $T=3\times 10^4$ in figure 7a) due to the stronger nonlinearity at the larger
 $T$. In addition, the swing of the charge jet is more obvious, which can be seen in figures 7( f–h). Additionally, we display the result of the FFT of
 $U_x$ in the stable oscillation stage, as shown in the insets of figures 7(a,e). One can see that the dominant frequencies are 1.36 and 9.89 for
 $T=3\times 10^4$ and
 $T=4\times 10^4$, respectively. In the latter case, there is another spike at the frequency
 ${\approx }30$. Note that when we calculated the FFT of the velocity signal at
 $(0.5,0.1)$ for
 $T=4\times 10^4$, we observed two frequencies at around 10 and 20 (not shown), which is more consistent with the weakly nonlinear phenomenon (that the dominant frequency
 $f$ interacts with itself to generate
 $2f$).
Evolution of the  $x$-velocity of the point
 $(0,0.5)$ (a,e) and charge density distribution at different times in blade–plate EHD flow at
 $T=3\times 10^4$ (a–d) and
 $T=4\times 10^4$ (e–h). For the two insets in each of (a) and (e), the bottom one zooms in to the oscillation period, and the top one shows the fast Fourier transform (FFT) of the oscillation signal when its amplitude is stable. Distribution of charge density at (b)
 $t=t_1$, (c)
 $t=t_2$, (d)
 $t=t_3$ at
 $T=3\times 10^4$, and at ( f)
 $t=t_4$, (g)
 $t=t_5$, (h)
 $t=t_6$ at
 $T=4\times 10^4$ (where
 $t_1$–
 $t_6$ are denoted in the insets of (a,e)). One has to look very closely to notice the small oscillation in (b–d). The other parameters are the same as those in figure 4. Full videos are provided in the supplementary material https://doi.org/10.1017/jfm.2022.943.

4.1.2. Characteristics of the Moffatt-like eddies in the blade–plate EHD flow, compared to Moffatt (Reference Moffatt1964)
After a pair of small vortices is formed near the tip due to the charge injection (in the range  $x\in [1,2]$), two larger pairs of vortices are formed further away from the corner region, driven by the viscous force. (Note that the viscous force includes both flow viscosity and charge diffusion, to be discussed shortly.) Now we take the case
 $R=0.3, T=500$,
 $Fe=5\times 10^3$ as an example to illustrate the properties of the Moffatt-like eddies in our blade–plate EHD flow. Figure 8 shows the streamline patterns in the nonlinear simulations of the steady EHD flow. It can be observed from the velocity vectors on the streamlines that the adjacent vortices are counter-rotating. We draw the asymptote of the hyperbola passing the origin O (i.e.
 $(0,0)$), labelled as OM (seen more clearly in figure 8b). The half-line denoting the plate electrode is labelled as ON. We connect the origin O to the centre of the third vortex
 $O_3$ and mark the half-line OP. With these notations,
 $\angle {\rm MON}=61.3^\circ$ is the inter-electrode angle (as denoted in figure 2b), which can be calculated exactly by
 $\angle {\rm MON}=\arctan (1/\sqrt {R})$. To some extent, these vortices resemble those in Moffatt (Reference Moffatt1964) with the included angle
 $2\alpha =61.3^\circ$ between two rigid boundaries, but differences exist, especially, in the ‘corner’ area around the original point, due to the specific configuration of the blade–plate electrodes.
Streamlines in blade–plate EHD flows with  $R=0.3$ (
 $2\alpha =61.3^\circ$): (a) the whole flow domain; (b) zoom-in around the near field. The other parameters are
 $T=500$,
 $Fe=5\times 10^3$,
 $C=5$ and
 $M=50$. Points
 $O_1,O_2,O_3$ are the centres of the three vortex structures. The red dashed half-line OP connects points O and
 $O_3$.

It can be seen from figure 8(b) that the centre  $O_2$ of the second vortex falls almost on the line OP with a slight deviation, and the centre of the vortex 1 (point
 $O_1$) does not locate on the line OP, but above it. It can be extracted that the coordinates of the three vortex centres are
 $O_1\ (0.278,0.544)$,
 $O_2\ (2.794,1.764)$,
 $O_3\ (14.908,8.853)$ in this case. In our blade–plate EHD flow, the distances between the centres of the three vortices and the original point O are respectively denoted as
 $r_1$,
 $r_2$ and
 $r_3$ (counted from the corner). Even though these notations are the same as those in (4.1) for the Moffatt eddies, confusion can be dispelled easily within the context. We obtain their values as
 $r_1=0.611$,
 $r_2=3.304$,
 $r_3=17.339$. We find that
 $r_3/r_2=5.25$, which is close to the theoretical prediction 5.22. However,
 $r_2/r_1=5.41$, discernibly different from the theoretical solution. This is mainly because of the geometrical differences mentioned above in the ‘corner’ region. Besides, it is noted that in the theory of Moffatt eddies (Moffatt Reference Moffatt1964), the calculated flow is a solution of the Navier–Stokes equations in the absence of volume forces. However, in the EHD case, there is a Coulomb force concentrated around the axis of symmetry of the geometry. The off-axis extension of the Coulomb force by diffusion and Coulomb repulsion generates a finite region where the volume force is non-zero. These are not the assumptions of the solution of Moffatt eddies, which may also contribute to the discrepancy for the first vortex between our result and that in Moffatt eddies.
As shown in figures 9(a–c), we present the values of the azimuthal velocity  $v_\theta$ on the line OP. Note that the direction of
 $v_\theta$ is perpendicular to OP. The local maximum of the amplitude of
 $v_\theta$ is denoted as
 $|v_\theta |_{n+1/2}$, where
 $n$ means the number of the vortex counting from the corner. The
 $r$-axis measures the radial distance from the original point on the OP line. We can find the ratios of eddy intensity (the theoretical value is
 $710.56$) as
 \begin{equation} \frac{|v_{\theta}|_{1+1/2}}{|v_{\theta}|_{2+1/2}}=\frac{0.496}{0.00306}=162.09,\quad \frac{|v_{\theta}|_{2+1/2}}{|v_{\theta}|_{3+1/2}}=\frac{0.00306}{4.436\times10^{{-}6}}=689.81. \end{equation}
Similar to the size ratio, the intensity ratio of vortices 2 and 3 is closer to the theoretical solution, while the ratio of vortices 1 and 2 is noticeably different. It is also noted that in figure 9(c), the position corresponding to  $v_{\theta } = 0$ is the position of the centre of vortex 3. Figure 9(d) presents the whole view of
 $v_\theta$ along OP. The value of
 $v_{\theta }$ first decreases (and its amplitude increases) due to the potential difference between the plate and the blade electrodes, then increases and reaches the first local maximum in the first vortex. The remaining two local maxima can be understood similarly with the help of the flow field shown in figure 8.
The azimuthal velocity distribution along the line OP in the section near the local maximum value. The inter-electrode angle is  $61.3^\circ$. (a) Vortex 1; (b) vortex 2; (c) vortex 3; (d) a full view of
 $v_\theta$ along the line OP. The parameters are the same as in figure 8.

4.1.3. Effects of parameters: inter-electrode angle, intensity of the electric field, charge diffusion
In order to characterise the Moffatt-like eddies in the EHD flow in detail, we study the effects of several parameters in this subsubsection.
We first change the inter-electrode angle to see the change in the Moffatt-like eddies in the blade–plate EHD flows. The inter-electrode angle can be adjusted by changing the radius of curvature  $R$. The investigated values of the inter-electrode angles are
 $77.4^\circ, 72.5^\circ$ and
 $66^\circ$, which correspond to the radii of the hyperbolic function
 $R=0.05$,
 $R=0.1$ and
 $R=0.2$ (as in (2.1)), respectively. The comparison between the results of numerical simulations and theoretical analyses is presented in table 3. It can be seen that with the decrease of the inter-electrode angle (or larger
 $R$),
 $r_1$,
 $r_2$ and
 $r_3$ all decrease, indicating that the sizes of vortices shrink. Besides, the local maximum azimuthal velocities of vortices 2 and 3 (
 $|v_{\theta }|_{2+1/2}$ and
 $|v_{\theta }|_{3+1/2}$, respectively) increase with decreasing
 $2\alpha$, and that of vortex 1 (
 $|v_{\theta }|_{1+1/2}$) decreases as
 $2\alpha$ decreases. We suspect that these trends of the local maximum azimuthal velocity may not be generalisable since the results may depend on the specific setting in our flow configuration; especially, we fix the
 $y$-coordinates of
 $S_1$ and
 $S_2$ (depicted in figure 2) for the ion injection. From table 3, we can also see that the maximum vertical velocity
 $|U_y|_{max}^s$ increases as
 $R$ increases. In addition, the results show that the size and intensity ratio of the second vortex over the third vortex at different inter-electrode angles have good agreement with the theoretical solutions, which are at a large distance from the corner (so less affected by the corner geometry), indicating that the Moffatt-like eddies observed in the (relative) far field of blade–plate EHD flow closely obey the similarity solutions presented by Moffatt (Reference Moffatt1964). Furthermore,
 $\angle {\rm PON}$ is close to
 $\alpha$ for all
 $R$, meaning that the centre of vortex 3 falls almost on the bisector of the inter-electrode angle.
Properties of Moffatt vortices at different  $R$ for
 $T=500$ and
 $Fe= 5\times 10^3$. The other parameters are
 $C=5$ and
 $M=50$.

Next, we study the effect of the electric Rayleigh number  $T$, which quantifies the strength of the electric field. In table 4, we summarise the numerical results of
 $R=0.3$ and
 $T=500,1000,1500$, respectively. We can observe that
 $r_1$,
 $r_2$ and
 $r_3$ all decrease as
 $T$ increases, meaning that the vortex centres are approaching the corner as we increase the intensity of the electric field. In addition,
 $|v_{\theta }|_{1+1/2}$,
 $|v_{\theta }|_{2+1/2}$ and
 $|v_{\theta }|_{3+1/2}$ all increase with the increase of
 $T$, which has the same trend as
 $|U_y|_{max}^s$, indicating that a higher electric field leads to stronger intensity of the eddies. Furthermore, one can see that the size and intensity ratio of vortices 2 and 3 do not change significantly and conform to the law of Moffatt eddies as we change
 $T$ from 500 to 1500. Also, in all the cases, the angle
 $\angle {\rm PON}$ approaches half of the inter-electrode angle
 $\alpha$.
Properties of Moffatt vortices at different  $T$ for
 $Fe= 5\times 10^3$ and
 $R=0.3$ (
 $2\alpha =61.3^\circ$). The other parameters are
 $C=5$ and
 $M=50$.

Finally, we investigate the influence of charge diffusion on the viscous eddies by changing  $Fe$ (note that smaller
 $Fe$ means stronger charge diffusion effect). In the above sections, we take
 $Fe= 5\times 10^3$, corresponding to a relatively small charge diffusion effect. Three additional values of
 $Fe$ (
 $Fe=500, 200, 100$) are considered, to observe more clearly the effect of charge diffusion. As shown in table 5, from the coordinates of the vortex centres in the table, we find that even though the
 $y$-coordinates of the centres of the vortices remain almost the same, the
 $x$-abscissas of the centres of the vortices tend to move away from the original point, when we decrease the value of
 $Fe$. This can be explained by the fact that the stronger diffusion motion of the charges from the centre towards the two sides drives the fluid to move to both sides (to be discussed with figure 10), so that the vortex extends farther away, resulting in a larger vortex size. Similar to the observation in the previous cases, the ratios of size and intensity between vortices 2 and 3 are in good agreement with those in Moffatt (Reference Moffatt1964), especially when the charge diffusion effect is strong (or
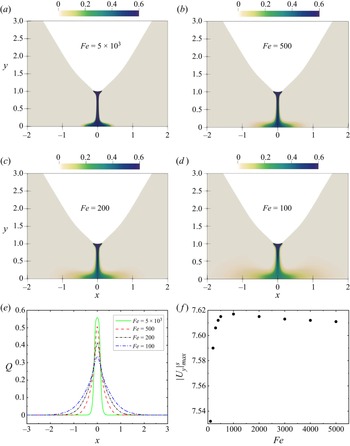
 $Fe$ is small). We present the distribution of charge density in figure 10, where the diffusion motion of charges can be observed clearly. From figures 10(a–d), we find that at smaller
 $Fe$, more charges diffuse from the centre to both sides. Figure 10(e) displays the charge density distribution at the horizontal line
 $y=0.1$, and it further illustrates that with the decrease of
 $Fe$, the charge density in the centre reduces, and it expands towards both sides.
Distribution of the charge density of final steady state between the blade injector and the plate electrode at  $T=500$,
 $R=0.3$, and (a)
 $Fe=5\times 10^3$, (b)
 $Fe=500$, (c)
 $Fe=200$, (d)
 $Fe=100$, and (e) along the horizontal line
 $y=0.1$. ( f) Maximum vertical velocity magnitude
 $|U_y|_{max}^s$ at the steady state versus
 $Fe$. The other parameters are
 $C=5$ and
 $M=50$.

Properties of Moffatt vortices at different  $Fe$ for
 $T= 500$ and
 $R=0.3$ (
 $2\alpha =61.3^\circ$). The other parameters are
 $C=5$ and
 $M=50$.

In terms of vortex intensity  $v_{\theta }$ in table 5, it seems that the value of
 $v_{\theta }$ first increases from
 $Fe=100$ to
 $Fe=500$, and then decreases from
 $Fe=500$ to
 $Fe= 5\times 10^3$, which has a similar trend with the maximum vertical velocity
 $|U_y|_{max}^s$. We then plot the maximum vertical velocity
 $|U_y|_{max}^s$ versus
 $Fe$ in a larger range of
 $Fe$ at
 $T=500$, as shown in figure 10(e). We can observe from the figure that when
 $Fe$ is large (or small charge diffusion effect),
 $Fe$ has an insignificant effect on the velocity. When
 $Fe$ is small (say from
 $Fe = 100$ to
 $Fe = 1000$),
 $|U_y|_{max}^s$ increases with increasing
 $Fe$, corresponding to the decreasing charge diffusion effect. Physically, since charge diffusion is a diffusive force after all, a small charge diffusion effect will hinder the flow motion less. So we observe a large
 $|U_y|_{max}^s$ when the charge diffusion is small (or large
 $Fe$). On the other hand, charge diffusion can also contribute to the movement of the charges in the flow domain. A stronger charge diffusion effect will dispense the charged ions more to the other parts of the flow domain, leaving fewer charges in the centre region where the
 $|U_y|_{max}^s$ happens. That is probably why we observe a smaller
 $|U_y|_{max}^s$ when
 $Fe$ is small (or the charge diffusion effect is strong). Thus the effect of charge diffusion is complex, and we indeed observe a maximal effect at an intermediate value of
 $Fe$ for
 $|U_y|_{max}^s$. In general, the variation of
 $|U_y|_{max}^s$ (from 7.53 to 7.62) in a large range of
 $Fe$ (from 100 to 5000) is small.
In a nutshell, the effect of charge diffusion can influence the formation and evolution of the Moffatt eddies. This is an additional factor compared to the situation in the original Stokes flows. The charge diffusion term was neglected in the numerical simulations of Perri et al. (Reference Perri, Sankaran, Staszel, Schick, Mashayek and Yarin2021). Our results indicate the generic existence of Moffatt-like eddies in multi-physical flows (EHD flow in our case) and their complex dependence on those parameters.
4.2. Linear global stability analysis of the blade–plate EHD flows
The previous subsection detailed the numerical results of Moffatt-like eddies in the blade–plate EHD flow using DNS. Next, we will conduct global stability analyses of these steady solutions. Since the main flow motion occurs in the central region near the blade tip, where the eigenmodes also concentrate (to be presented), a small computational domain is adopted in this subsection in order to gain higher computational efficiency. More specifically, we set  $H_p=5$ and
 $\Delta H_s=2$ for
 $T\in [500,2900]$, and
 $H_p=20$ and
 $\Delta H_s=10$ for
 $T\in [10\,000,40\,000]$; see figure 2(a) for the definitions of
 $H_p$ and
 $\Delta H_s$. Additionally, in the linear stability analysis, the disturbance generated near the blade tip and the original point will propagate to the far field. Because of the finite size of the domain and the imposition of the boundary conditions, reflection of the linear waves at the domain boundary is inevitable. In order to minimise the reflection effect, we consider a sponge zone in the far field; see again figure 2(a), following Chevalier et al. (Reference Chevalier, Lundbladh and Henningson2007) and Appelquist et al. (Reference Appelquist, Schlatter, Alfredsson and Lingwood2015). A series of validation cases has been carried out and the results are shown in Appendix B, including verifying the mesh independence and ensuring that the computational domain and the sponge region are large enough to not affect the results in the physical region around the origin. In this subsection, the parameters are
 $R=0.05$,
 $C=5$,
 $M=50$ and
 $Fe=5\times 10^3$ for most cases.
We use the steady state of the nonlinear simulation of the blade–plate EHD flow discussed above as the base flow  $(\bar {{\boldsymbol {U}}},\bar {Q}, \bar {\phi }, \bar {\boldsymbol {E}})$, and carry out its global linear stability analyses by adding small disturbances on the base flow (§ 2.1). We will present below the eigenvalues
 $\omega$ and eigenvectors
 $\tilde {\boldsymbol {f}}$, introduced in (2.7). We first plot the least stable eigenvalues at
 $T=500$ obtained using the IRAM, as shown in figure 11(a). The first seven least stable modes are presented, and they are symmetric with respect to the line
 $\omega _i=0$. Figure 11(b) presents the growth rate (
 $\omega _r$) of the least stable eigenvalue as a function of
 $T$. All the growth rates are negative, indicating that perturbations decay within the range
 $T=500\sim 2900$ for the steady base state. In this range, the imaginary part of the least stable eigenvalue is zero, indicating that this mode is non-oscillating. It can also be seen from the figure that with the increase of
 $T$, the decay rate decreases. This means that increasing
 $T$ renders the linear system less stable, but the destabilising effect of increasing
 $T$ becomes weaker at larger
 $T$. Moreover, we note that in the global stability analysis of the confined impinging jet reported by Meliga & Chomaz (Reference Meliga and Chomaz2011), the variation of the disturbance growth rate by increasing Reynolds number (their governing parameter) follows a trend similar to the one that we observe here. This may be related to the similar flow phenomenon (impingement of the flow field) in the two cases. Then we investigate the influence of
 $Fe$ (the inverse of the charge diffusion coefficient) on the global stability of the EHD plume. As shown in figure 11(c), increasing
 $Fe$ (decreasing charge diffusion) destabilises the linearised flow in the blade–plate EHD geometry. We mention in passing that for each data point in figures 11(b,c), a nonlinear DNS was first performed to obtain the base state, and then a global linear stability analysis of the base state was conducted. This is because the base state is dependent on the parameters.
(a) Least stable eigenvalues of the blade–plate EHD flow at  $T=500$,
 $Fe=5\times 10^3$. Growth rate of leading global mode in the blade–plate EHD flow versus (b)
 $T$ at
 $Fe=5\times 10^3$, (c)
 $Fe$ at
 $T=500$. The other parameters are
 $C=5$,
 $M=50$ and
 $R=0.05$.

The eigenvectors  $u$,
 $v$ and
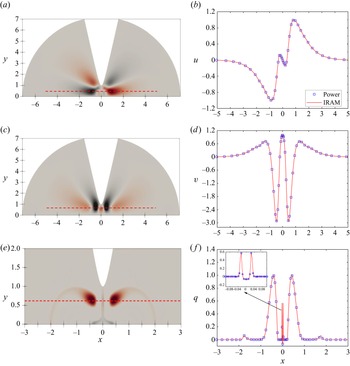
 $q$ of the leading mode in the blade–plate EHD flow are presented in figure 12. In figures 12(b,d, f), we compare the leading eigenvectors at a certain line obtained by the power iteration method and the IRAM. The two agree with each other, which further validates our linear computations. We can see from figures 12(a,c,e) that the perturbations are symmetric with respect to the central line
 $x=0$. This is a trivial observation because of the symmetry of the base flow in our case. In other flows, a self-excited axisymmetric mode was observed in the confined thermal plume by Lesshafft (Reference Lesshafft2015). In addition, it has been found that the leading mode of the confined impinging jet is antisymmetric (Meliga & Chomaz Reference Meliga and Chomaz2011). In figure 12(e), it is worth noting that in addition to the perturbation of charge density distribution in the central region resembling the nonlinear structure (figure 4d), there are also two tadpole-shaped structures on the sides. This special structure may stem from the strong convection nature of the charge density equation (2.4c). We find that the positions of the heads of the ‘tadpole’ (
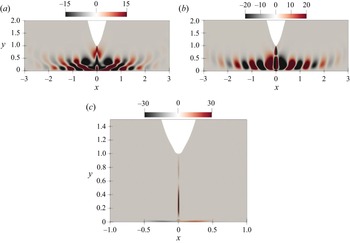
 $[\pm 0.42,0.65]$) are approximately the same as the maximum values of the positive vertical velocity in the base flow, that is, the positions where the fluids move up the fastest after impinging the plate; see figure 5(b). Additionally, in figures 12(c) and 12(d), we notice that the vertical velocity disturbance also has a local large absolute value. By examining the pressure perturbation, we find that this position is where the positive and negative pressure convert, as shown in figure 13(a). Furthermore, the distribution of electric potential perturbation
 $\varphi$ is shown in figure 13(b), which is related to the perturbation
 $q$. Note that in all the eigenvectors that we have studied here, the most important structures are located near the blade tip region, validating the consideration of using a smaller computational domain in the linear analysis.
Eigenvectors of most unstable mode for blade–plate EHD flow at  $T=500$, for (a) horizontal velocity
 $u$, (c) vertical velocity
 $v$, (e) charge density
 $q$. The eigenvectors can be arbitrarily scaled. Comparison between the results obtained by the power method (symbols) and IRAM (solid lines) for (b)
 $u$ at
 $y=0.5$, (d)
 $v$ at
 $y=0.65$, ( f)
 $q$ at
 $y=0.65$, with the maximum values of the eigenvectors scaled to unity. The parameters are the same as in figure 11(a).

Eigenvectors of most unstable mode for blade–plate EHD flow at  $T=500$, for (a) pressure perturbation
 $p$, (b) electric potential perturbation
 $\varphi$. The parameters are the same as in figure 11(a).

Figure 14 displays the charge density eigenvectors of mode 2 to mode 5 at  $T=500$. It can be seen that the second and third eigenmodes are similar to the leading one (figure 12e), which are all stationary eigenmodes (see figure 11a), and the difference is only in the positive and negative regions around the heads of the tadpoles. Figures 14(c,d) show the eigenvectors of charge density for a pair of complex conjugate eigenvalues with equal real parts and opposite imaginary parts. It is interesting to see that these oscillating eigenmodes (with non-zero imaginary part) possess two symmetrical tai chi shapes on both sides of the central axis.
Eigenvectors of charge density of mode 2 to mode 5 for blade–plate EHD flow at  $T=500$. The eigenvalues are (a)
 $-0.0883+0i$, (b)
 $-0.245+0i$, (c)
 $-0.333+0.252i$, and (d)
 $-0.333-0.252i$. The parameters are the same as in figure 11(a).

Next, we also discuss an unstable flow at a higher  $T=4\times 10^4$. This is the oscillating flow as we have analysed in figure 7. To enable stability analysis, we solve for its steady unstable solution of the nonlinear governing equation using the selective frequency damping method (Akervik et al. Reference Akervik, Brandt, Henningson, Hœpffner, Marxen and Schlatter2006), which damps the high-frequency content in the equation to stabilise the flow. The unsteady base flow and the base charge density are presented in figure 15. We can see that now the charge density is a single steady jet impinging on the plate electrode, unlike the oscillating behaviour in figure 7. One can understand that this unstable flow will transition to another flow state, which can be analysed by a stability analysis. Such a methodology can also be applied to analyse the transient flow phenomenon in Perri et al. (Reference Perri, Sankaran, Kashir, Staszel, Schick, Mashayek and Yarin2020). We present its eigenvectors of the leading mode in figure 16. It can be seen that the patterns of eigenvectors of the leading mode in this case are quite different from those in the low
 $T$ case. The eigenvalues for the leading modes at
 $T=4\times 10^4$ are calculated as
 $3.364 \pm 61.592i$, meaning that the linear growth rate is 3.364 and the flow is indeed unstable. In addition, the eigenfrequency (which is the imaginary part of the eigenvalue) is 61.592. This value can also be approximately related to the DNS results in figure 7(b), which indicated that the dominant circle frequency of the flow oscillation is
 $9.89\approx 61.592/(2{\rm \pi} )$.
The steady unstable base flow for blade–plate EHD flow at  $T=4\times 10^4$, for (a) the velocity field, (b) the charge density distribution. The other parameters are the same as those in figure 11(a).

Eigenvectors of most unstable mode (imaginary part of the eigenvalue is positive) for blade–plate EHD flow at  $T=4\times 10^4$, for (a) horizontal velocity
 $u$, (b) vertical velocity
 $v$, (c) charge density
 $q$. The other parameters are the same as those in figure 11(a).

Finally, we present in figure 17 the results of linear stability analysis at large  $T\in [10\,000,40\,000]$ to showcase the variation of the growth rate and the eigenfrequency in a large range of
 $T$ covering the linear critical condition. The growth rate versus
 $T$ is displayed in figure 17(a), which shows that the critical
 $T_{c}$ for the onset of global linear instability is between 15 000 and 20 000, and very close to
 $T=20\,000$. When
 $T$ is larger than this critical condition, the time-periodic oscillation occurs (see also figure 17b). Figure 17(b) depicts the frequency of the leading global mode at different
 $T$, obtained by both nonlinear simulations and linear stability analyses. Note that the eigenfrequency is
 $2{\rm \pi}$ times the actual frequency of oscillation. We can observe that the two methods generate consistent results. A peculiar phenomenon occurs of a sudden increase of the frequency when
 $T$ is varied from 30 000 to 35 000. To explain this, we resort to figure 7, where we have plotted the time series of the flow oscillation at a point
 $(0,0.5)$ and the representative flow snapshots. We can observe clearly that when
 $T=30\,000$, the oscillation is slow and almost monotonic with a single frequency, from figure 7(a). The amplitude of the oscillation is also small. On the other hand, when
 $T$ is increased to 40 000, from figure 7(b), we can see that the oscillation is featured by two dominant frequencies and is also more drastic. The charge beam strikes the flat plate forcefully and triggers nonlinear effects in the flow, as evidenced by the second spike in the FFT result in the inset of figure 7(b). From these observations, we conclude that the sudden increase of the frequency seems to more likely stem from the confinement effect in the centre region. That is, at a larger
 $T$, the stronger charge jet will hit the flat plate more violently and get reflected, leading to the more drastic oscillation with an increased frequency. This phenomenon may deserve further investigation in the future.
(a) Growth rate and (b) frequency of the leading global mode in the blade–plate EHD flow of  $T$ in the interval
 $[10\,000,40\,000]$. The other parameters are
 $C=5$,
 $M=50$,
 $R=0.05$ and
 $Fe=5\times 10^3$.

5. Conclusions
In this work, we performed numerical simulations and conducted linear global stability analyses of the Moffatt-like eddies in two-dimensional blade–plate EHD flows, motivated by the recent experimental and numerical work of Perri et al. (Reference Perri, Sankaran, Kashir, Staszel, Schick, Mashayek and Yarin2020, Reference Perri, Sankaran, Staszel, Schick, Mashayek and Yarin2021) in a different setting. Driven by a unipolar strong injection, an impinging flow motion occurs, issuing from the blade tip (subjected to a high voltage) to the grounded flat plate electrode due to the Coulomb force. The impingement of the EHD flow on the plate helps to form vortices in the space between the two electrodes. The vortices are studied and compared to the theoretical results of Moffatt (Reference Moffatt1964), despite the different geometries and the additional Coulomb force in our EHD flow. The existence of the Moffatt-like eddies in the EHD flow has been proven, and their characteristics have been investigated.
We first presented the evolution of the EHD flow and its nonlinear behaviour. The results show that the first pair of vortices near the tip is formed due to the charge injection under the effect of the Coulomb force, and two larger pairs of vortices further away from the corner are formed because of the viscous force in the flow. We then analysed the sequence of eddies (in the current work, three vortices are resolved) using the case of the inter-electrode angle being  $61.3^\circ$ as an example. Our quantitative results indicate that the ratios of size and intensity of the two successive eddies in the far field (the second and third vortices) can be compared favourably to the theoretical results of Moffatt (Reference Moffatt1964). Differences exist for the ratios of size and intensity of the two successive eddies in the near field, which is due to the unclosed corner in our geometry.
We also studied the influence of the inter-electrode angle by changing the radius of the curvature of the hyperbolic blade to further validate the properties of EHD Moffatt-like eddies. We found that the above conclusion (that the ratios of size and intensity between the second and third vortices agree well with the results in Moffatt Reference Moffatt1964) is generally valid for all the inter-electrode angles investigated in this work. In addition, we also investigated the effect of the electric field intensity ( $T$) on the Moffatt-like eddies. Our results show that increasing
 $T$ renders the centres of the vortices closer to the corner and increases the intensity of vortices. In addition, at a sufficiently large
 $T$, a (periodic) flow oscillation occurs, meaning that the flow may transition to another type of state. This result is qualitatively consistent with the experimental observation of Perri et al. (Reference Perri, Sankaran, Kashir, Staszel, Schick, Mashayek and Yarin2020), who also reported a transient flow experiencing bifurcation. Furthermore, we found that increasing the charge diffusion effect can increase the size of vortices in this EHD flow. It can be explained that the charge diffusion drives the lateral movement of the fluid towards the far field, thus extending the vortex. This effect was not studied in the numerical simulations of Perri et al. (Reference Perri, Sankaran, Kashir, Staszel, Schick, Mashayek and Yarin2020).
In the end, we investigated the linear global stability of the steady flows in this EHD flow by adopting the implicitly restarted Arnoldi method. In order to improve the computational efficiency, a smaller computational domain was chosen, and a sponge layer was applied to damp the reflection of the outgoing waves. The eigenvectors of the leading mode at the steady flow ( $T=500$) and the periodic oscillatory flow (
 $T=40\,000$) are presented, and they show evidently different patterns. Furthermore, it is interesting to find that with the increase of charge diffusion, the flow becomes more stable. The leading global eigenvector of the charge density field shows a tadpole-shaped structure whose amplitude is consistent with the base flow characteristics. Finally, linear stability analyses on high-
 $T$ EHD flows have been conducted to investigate the flow instability, and the critical
 $T_c$ is found to be slightly smaller than 20 000. When
 $T$ is sufficiently large, we also observe a strong flow oscillation with an increased frequency, which might be due to the confinement effect of the geometry in the centre region.
Future work can consider investigating numerically the EHD Moffatt-like eddies in the needle–plate configuration (in a cylindrical coordinate), which is the geometry adopted in the experiments of Perri et al. (Reference Perri, Sankaran, Kashir, Staszel, Schick, Mashayek and Yarin2020, Reference Perri, Sankaran, Staszel, Schick, Mashayek and Yarin2021). This will enable a more consistent and quantitative comparison to their results. Another future work can consider determining more accurately the linear instability criterion and bifurcation diagram in the transition process of this EHD flow. The stability analysis of the oscillating flow can be further refined by analysing the time-averaged flow of the oscillating jet at a large  $T$, which may be compared favourably to the experimental results (following the previous research on the cylindrical wake flow, e.g. Barkley Reference Barkley2006).
To sum up, our work takes a step further to characterise quantitatively and in detail the Moffatt-like eddies in blade–plate EHD flow, with favourable comparisons with Moffatt's original result, supplementing the recent work of Perri et al. (Reference Perri, Sankaran, Kashir, Staszel, Schick, Mashayek and Yarin2020, Reference Perri, Sankaran, Staszel, Schick, Mashayek and Yarin2021) to study this new phenomenon in EHD. It demonstrates numerically the relevance of Moffatt's theoretical results in multi-physical flows. We hope that the current work can facilitate the observation of Moffatt-like eddies in other multi-physical flows in the future.
Supplementary movies
Supplementary movies are available at https://doi.org/10.1017/jfm.2022.943.
Funding
Financial support from the Ministry of Education, Singapore, is acknowledged (WBS no. R-265-000-689-114). X.H. is supported by a doctoral research scholarship from the National University of Singapore and a scholarship from the China Scholarship Council. The computational resources of the National Supercomputing Centre, Singapore, are acknowledged.
Declaration of interests
The authors report no conflict of interest.
Appendix A. Verification of the domain size and the grid resolution in the simulations of Moffatt-like eddies
This appendix determines the size of the computational domain in our numerical simulations of the Moffatt-like eddies. We take  $R=0.05$ (corresponding to
 $2\alpha =77.4^\circ )$ and
 $T=500$,
 $Fe= 5\times 10^3$,
 $C=5$,
 $M=50$ to verify that the computational domain is large enough to obtain accurate results. We investigate three vortices, requiring a large computational domain that needs to be resolved. In addition, the inter-electrode angle is also a factor influencing the computational domain. We consider three sizes of the computational domain, namely G70, G80 and G90, corresponding to
 $H_w=70,80,90$, respectively; see figure 2(a) for
 $H_w$. The ratio
 $r_3/r_2$ is evaluated in three different geometry sizes, as shown in table 6. We can see that the results calculated in G70, G80 and G90 are close to the theoretical solution, and the errors relative to the theoretical solution are all lower than
 $1\,\%$. Considering the calculation efficiency and the accuracy of the results, we choose G80 to perform the numerical simulations in this part.
Independence of computational domain size validation at  $Fe= 5\times 10^3$,
 $T=500$,
 $R= 0.05$ (
 $2\alpha =77.4^\circ$),
 $C=5$ and
 $M=50$.

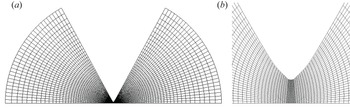
We then perform the mesh independence test for the simulations. It is noted that the spectral elements mesh depends on two factors, one being the number of spectral elements  $N_e$, and the other the polynomial order
 $N$. We test six sets of grid sizes, as shown in table 7. The ratio
 $r_3/r_2$ at
 $R=0.3$,
 $T=500$ and
 $Fe= 5\times 10^3$ has been calculated for different meshes. We can see that relative errors of MM2–MM6 to the theoretical solution are all less than
 $1\,\%$, and MM4 is adopted in this section. In addition, the distribution of the Legendre spectral elements is shown in figure 18.
(a) Distribution of the Legendre spectral elements for the numerical simulation of Moffatt eddies in the blade–plate EHD flow. (b) Zoom-in display of the mesh refinement in the central region.

Grid independence validation at  $Fe= 5\times 10^3$,
 $T=500$,
 $R= 0.3$ (
 $2\alpha =61.3^\circ$),
 $C=5$ and
 $M=50$.

Since we use an electrode configuration (blade–plate) similar to that of the experiment of Perri et al. (Reference Perri, Sankaran, Kashir, Staszel, Schick, Mashayek and Yarin2020) (needle–plate), we perform a comparison with experimentally reported values on peak vertical velocity here. The liquid used in the experiment (Perri et al. Reference Perri, Sankaran, Kashir, Staszel, Schick, Mashayek and Yarin2020) was food-grade canola oil, and its physical properties were listed in their table 1: kinematic viscosity  $\nu ^*=9\times 10^{-5}\,{\rm m}^2\,{\rm s}^{-1}$, mass density
 $\rho ^*=900\,{\rm kg}\,{\rm m}^{-3}$, relative dielectric permittivity
 $\epsilon _r^*=3.14$, and conductivity
 $\sigma ^*= 4\times 10^{-10}\,{\rm S}\,{\rm m}^{-1}$. The diffusion coefficient for the charges is
 $D_\nu ^*=1\times 10^{-11}\,{\rm m}^2\,{\rm s}^{-1}$. The distance between the needle tip and the plate in the experiment was
 $H^*=1.8\,\mathrm {mm}$. In addition, the experiments were performed at
 $300\,\mathrm {K}$, and the inter-electrode angle is
 $76^\circ$. Therefore, the corresponding values of the non-dimensional parameters in our scaling method for
 $\varPhi _0^*=12$ kV (that is, a typical value in the experiment) can be calculated as
 $C_0=10$,
 $M=500$,
 $T=10\,000$,
 $R=0.06$ and
 $Fe=5\times 10^5$. The maximum vertical velocity in our numerical results is 48.43, corresponding to the dimensional value
 $125\,{\rm mm}\,{\rm s}^{-1}$. The maximum vertical velocity is about
 $45\,{\rm mm}\,{\rm s}^{-1}$, indicated from figure 5 in Perri et al. (Reference Perri, Sankaran, Kashir, Staszel, Schick, Mashayek and Yarin2020). The discrepancy may be due mainly to the different geometry of the two works as well as the three-dimensional effect in the experiments (whereas we conducted two-dimensional simulations).
Appendix B. Verification of the domain size and the grid resolution in the global stability analysis
When conducting linear global stability analysis for the blade–plate EHD flow, we adopt a smaller computational domain, and a sponge layer is used to prevent the reflections of the outgoing disturbances from the far field boundary. Here, we perform the verification of the domain size and the grid independence to ensure the credibility of the results. In this appendix, the value of  $T$ is 2900, which is the largest value studied in our linear stability analysis. The other parameters are
 $C=5$,
 $M=50$,
 $R=0.05$ and
 $Fe=5\times 10^3$. Note that in the global stability analysis, two steps are involved: one should first obtain the nonlinear steady base flow and then conduct its stability analysis. We present below the verification of both steps.
We first consider the computational domain size, which should be sufficiently large. This is confirmed by examining the saturated maximum velocity magnitude  $|\boldsymbol {U}|_{max}^s$ appearing in the flow for five different geometry sizes, as shown in table 8. The notation
 $H_p$ (controlling the size of the physical domain) can be found in figure 2(a). In addition, the size of the sponge region remains the same, namely
 $\Delta H_s=2$ (also see figure 2a). From table 8, we can see that the relative error between G3 and G5 is less than
 $0.5\,\%$. Thus we choose G3 as our computational domain, that is,
 $H_p=5$.
Independence of computational domain size validation at  $T=2900$. The other parameters are
 $C=5$,
 $M=50$,
 $R=0.05$ and
 $Fe=5\times 10^3$.

We then determine the size of the sponge region. The strategy is to keep the size and the grid resolution of the physical area unchanged ( $H_p=5$), and test four values of sponge region with different sizes, i.e. different
 $\Delta H_s$, as shown in table 9, and the number of elements in the sponge area changes in proportion to the size. The saturated maximum velocity magnitudes
 $|\boldsymbol {U}|_{max}^s$ of nonlinear EHD flow with different sponge layers are shown in table 9; we can see that the size of the sponge layer has almost no effect on the nonlinear results. Since the sponge region acts mainly on the linear wave, we compare the energy evolution of the linear EHD plume with different sponge regions, as shown in figure 19. According to the results presented in table 9 and figure 19, S2 is adopted. To summarise, we have decided a proper computational domain with
 $H_p=5$ and
 $\Delta H_s=2$.
Energy evolution of linear blade–plate EHD flow with different sponge zones at  $T=2900$. The parameters are the same as in table 8.

Independence of sponge region size validation at  $T=2900$. The parameters are the same as in table 8.

We next verify the independence of numerical results with respect to the grid resolution. We test seven sets of grid sizes, as shown in table 10. The saturated maximum velocity magnitude  $|\boldsymbol {U}|_{max}^s$ inside the flow domain has been calculated for different meshes. It can be seen that relative errors of M2–M7 compared to M7 are all less than
 $1\,\%$, indicating that results converge at these mesh sizes. Thus, considering both the computational accuracy and efficiency, we generate results with the mesh M4 in most cases in the results section. We note that when calculating the results for larger
 $T$, a larger computational domain is adopted (
 $H_p=20$ and
 $\Delta H_s=10$), and a refined mesh (
 $N_e=2950$,
 $N=9$) is used.
Grid independence validation at  $T=2900$. The parameters are the same as in table 8.

Appendix C. Nomenclature
This work deals with a multi-physical flow with many different symbols to denote flow parameters and the geometry. They are summarised in table 11.
Symbols used in this paper for the parameters and geometry.