On his second visit to Japan in 1854, Commodore Matthew Perry brought a miniature steam locomotive that ran on a mile-circumference track.Footnote 1 Curious onlookers were impressed not only by the novelty of the design, but especially with its rapidity: one impromptu rider sitting atop the train “clung with a desperate hold to the edge of the roof… and described the experience ‘as though it were flying'” (Ericson Reference Ericson1996, p. 4).Footnote 2 Eighteen years and a revolution later, the Meiji emperor opened the country's first railway between Tokyo and Yokohama, which cut the daylong journey by foot to less than an hour by train (Free Reference Free2008, pp. 11, 85).
Among the many technological and institutional changes sweeping Japan in the late nineteenth century, the railroad has been credited with a leading role in promoting industrialization and economic growth.Footnote 3 This view emphasizes the benefits of improved transportation infrastructure, such as lower transit costs, market integration and expansion, and intersectoral linkages (Rostow Reference Rostow1960, pp. 36–58). Casual observation of Japan's economic performance seems to corroborate this view. From 1872, when the country's first railway was completed, and 1907, when the government completed its takeover of major trunk lines, the domestic rail network expanded from 29 to 7,152 kilometers; the number of locomotives from 10 to 1,924; and annual passengers carried from 495,000 to 101 million.Footnote 4 At the same time, national income tripled in real terms (Maddison Reference Maddison2003).Footnote 5
Correlation, however, is not causation, and numerous studies have argued that railroads accelerate economic development, usually with counterfactual comparisons of social savings or indirect measures of economic activity like population growth.Footnote 6 While these approaches are persuasive, there remain some ambiguities such as how the arrival of the railway directly affects firms and industries or how these would have behaved differently in the absence of locomotive technology. Such questions are especially relevant to countries that may have well-developed shipping transport links like Japan. This gap in our knowledge is in part due to a lack of historic firm-level data as well as difficulty in finding appropriate analogues with which to compare economic outcomes.
Another factor to consider is that railroad access may have differential consequences on the connected locations themselves. While railroads may increase national economic activity, redistribution of the latter between regions may also occur. That is, besides increased specialization by locality, economic geography suggests that agglomeration forces can draw business activity away from newly accessible areas (aka, periphery) toward already established manufacturing centers (Krugman Reference Krugman1991a).Footnote 7 This theoretical prediction may apply to Meiji Japan, where there were already large disparities in population and commerce between major cities like Tokyo and Osaka and prefectures in outlying areas. Taking account of differences between regions should clarify the distributional effects of the railroad and other spatially oriented technologies at a country's early stage in development.Footnote 8
The aims of this article are twofold: to examine the railroad-growth relationship through the lens of firm activity; and to highlight the variable effects of railway access across industries and regions. To do so, I rely on a comprehensive prefecture-level data set and a difference-in-differences methodology that exploits the variation in the timing of railroad network expansion across Japanese prefectures. These data are disaggregated at the major industry level and provide figures for firm number and capitalization, thus providing a sharper view of regional activity than that based on national accounting data, government records, and case studies of firms or industries.
The analysis shows that railway access led to higher average firm capital levels, an indication of firm scale, and that the effect on firm numbers was highly redistributive among regions. Among prefectures with larger initial populations, rail access increased net firm establishment, particularly in the manufacturing sector. In contrast, prefectures with longer coastlines, which may proxy for access to coastal shipping, saw their firm numbers fall after the railway arrived. Together, these findings are consistent with improved transport providing the means to expand the size of firms due to wider market access. At the same time, railways allowed production to move away from smaller markets given greater availability of labor and finance in more developed areas.
POLITICAL AND ECONOMIC MOTIVATIONS FOR JAPANESE RAILWAYS
For the Japanese government, better transport infrastructure (railroads) meant centralization of political control, more responsive national defense, and the ability to spread economic growth to outlying areas (Aoki et al. Reference Eiichi, Imashiro, Kato and Wakuda2000, p. 15; Crawcour Reference Sydney and Yamamura1997, pp. 58–61). Up to the 1860s Japan in effect was a collection of semi-autonomous feudal domains ruled by powerful local families who were vassals of the Tokugawa shogun based in Tokyo (then known as Edo). Lower-ranked samurai in the western territories of Choshu and Satsuma helped to reinstall the emperor as head of government in 1868, who in turn sought advice from a small group of industrialists and technocrats to administer a modernization program. To consolidate its authority, the new Meiji government redrew the political and administrative map of Japan and formed the modern system of 47 prefectures. It also focused on connecting local population centers with the main cities of Tokyo and Osaka via telegraphs and railroads. Improved communications and transport allowed for speedier movement of the new conscript army to pacify restless areas and to prepare for possible attack from western colonial powers. For the private sector, railways were viewed as a profitable venture in no small part because of the rate of return guarantees offered by the government.Footnote 9 As railroad investments required larger sums than could be provided by any single private investor, these enterprises made active use of domestic bond markets and the newly established equity exchanges. To ensure that with the private sector delivered the transport network it wanted, the government issued a number of laws in the 1880s and 1890s that standardized railway construction. It also identified which government-planned lines could be bid on by private investors. Localities could also petition for amendments or extensions to the railroad plan after 1892, when the Railway Construction Law was passed. Public-private collaboration continued until the nationalizations of 1906 and 1907. These put the trunk lines in the public sector leaving only urban tramlines and ancillary extensions in the private sector.
While railroads are seen as major engines of growth for the Japanese economy, many regions were already linked commercially before the Meiji period via coastal shipping and some land routes (Yamamoto Reference Hirofumi and Yamamoto1993, p. 5; Lockwood Reference Lockwood1954, p. 105). Coastal freight, the principal cargoes being rice, cotton, cloth, and other dry bulk goods, relied on preindustrial technology and most ships had flat bottoms and single sails; for example, to sail the thousand kilometers between Tokyo and the western island of Kyushu required at least a month's passage.Footnote 10 Land transport was much more limited, with few roads connecting different regions, and even slower.Footnote 11 Prior to the introduction of the railroad, which reduced the one-day journey to less than an hour, overland travel conditions were described as highly variable and virtually unchanged for a millenium (Free Reference Free2008, p. 11).Footnote 12 In the decades that followed, rail freight quickly dominated other forms of domestic transport even as the latter experienced rapid growth along with the rest of the economy (Lockwood Reference Lockwood1954, pp. 107–08).Footnote 13
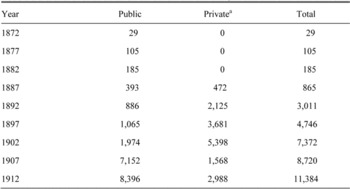
Railroad construction in Japan began in 1872 with a 29 kilometer stretch between Tokyo and its nearest deep sea port Yokohama. Two years later, in 1874, a similar length of track was laid between Osaka and the port city Kobe, which were approximately 500 kilometers to the west of Tokyo. The government, which provided funding for these projects, had anticipated that the two major cities of Tokyo and Osaka would be connected by rail quickly. Yet, financial obstacles meant that the Tokaido route between them was only completed in 1889. Given the costs of modernization, deteriorating balance of payments, pacifying rebellious samurai, and controlling inflation, the central government found it difficult to continue investing in railroad infrastructure (Crawcour Reference Sydney and Yamamura1997, p. 59; Yamamoto Reference Hirofumi and Yamamoto1993, p. 12; Aoki et al. Reference Eiichi, Imashiro, Kato and Wakuda2000, p. 11).Footnote 14 The railroad network's expansion began in earnest in the 1880s when the government allowed the private sector to enter the industry and lay its own tracks in local areas and the parts of the country not served by the public network (see Table 1).Footnote 15 On the main island of Honshu, both public and private railroads expanded by radiating away from Tokyo and Osaka toward the other major cities. On the islands of Hokkaido, Shikoku, and Kyushu, privately owned and resource extraction-oriented short tracks dominated.Footnote 16
LENGTH OF JAPANESE RAIL NETWORK, KILOMETERS

aincludes long-distance and local rail and tram networks.
Source:
Japan Statistical Association (2007), series 8-4 and 8-14.
It is easy to find examples of localities and sectors that benefitted from railway access. For instance, after the Shin'etsu railroad was completed in 1893, highly perishable raw silk from the central Nagano area could be carried to the closest train station 40 kilometers away instead of five times that distance to the capital. When the line was extended to the Suwa district itself, “production…increased dramatically and the cocoon collection area expanded” to cover most of sericultural area in central Japan (Aoki et al. Reference Eiichi, Imashiro, Kato and Wakuda2000, pp. 21–22; Ericson Reference Ericson1996, pp. 42–48). Elsewhere consumption of coal, which largely relied on railroad or mixed rail-sea transport for distribution, grew as the network expanded. Countering these examples, however, is the iron and steel sector, which despite obvious industrial linkages to rail construction and transport arguably did not benefit much because of an initial reliance on imported materials. Only after the 1907 railway nationalization that guaranteed demand for domestically produced iron and steel did this sector enjoy any spillovers (Ericson Reference Ericson1996, pp. 32, 38).
Given the debate and largely anecdotal accounts about the impact of railroads on Japanese economic development; ongoing scholarship based on other countries' railroad experience; and industrial and prefectural differences, it seems appropriate to reexamine whether the relationship between Japan's expanding rail system and economic activity was coincident or causal.Footnote 17 Scholars of Japanese railroads have typically eschewed statistical or economic estimates the railway's impact on the economy.Footnote 18 In contrast, there is an extensive literature for other countries. It suggests that the railroad improved economic welfare as measured through cost savings, consumer surplus, urbanization, agglomeration, productivity, and market access.Footnote 19 Many of these studies, especially those using the social savings approach, rely on static counterfactuals to support the claim of welfare gains, which can pose an epistemological problem in attributing causality.Footnote 20
Alternative methods that use time-series data and do not rely on static comparisons have also demonstrated a link between railroads and growth. David Donaldson (forthcoming) uses a general equilibrium trade model and highly detailed price data to estimate the direct impact of an expanding railway system on the colonial Indian economy. This allows the author to calculate reductions in trade costs and regional price differences as well as gains in income, which he finds amounting to a 16 percent increase due to rail access, much higher than Fogel's (Reference Fogel1964) estimate of 4.7 percent for the United States in 1890. Donaldson and Richard Hornbeck (Reference David and Hornbeck2013) examine county-level land values and transport accessibility to assess the impact of railways, and estimate a decrease in value of nearly two-thirds without them. Jeremy Atack et al. (Reference Jeremy, Bateman, Haines and Margo2010) focus on population growth and urbanization as possible consequences of railroad development, and find evidence that railroads “caused” urbanization in the American Midwest.
Looking specifically at the relationship between railroads and firm scale, Atack, Michael Haines, and Robert Margo (Reference Jeremy, Haines and Margo2008) find that American establishments were more likely to be factories, employing sixteen or more workers, in counties that gained access to rail between 1850 and 1870, when the United States was itself undergoing a “transport revolution” via rail.Footnote 21 The authors attribute this effect to productivity increases from increased labor division found in larger establishments, and use a difference-in-differences estimator to identify the causal impact. In terms of research design, the current article is most similar to the approach taken by the latter study, with the data and methodology described below.
RESEARCH DESIGN
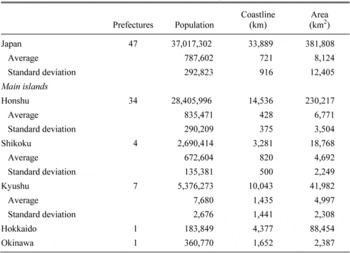
This article uses prefectural data compiled by the imperial statistical agency attached to the Japanese Cabinet Office (Japan Statistical Association 1962) to analyze the impact of Japanese railways on industries and across regions. Starting with 1883 the agency produced annual volumes of prefecture-level statistics, with coverage of land, population, industry, and health across the country (later including its colonies). The data, which are also disaggregated by major industry groups, include the total number of enterprises in each prefecture and their total invested capital by prefecture. Table 2 presents population and geographic data for Japan and its major islands in the year 1882, immediately prior to the nationwide rollout of the railway.
I constructed an annual data set for each prefecture from 1883 to 1912 covering all major industry groups along with prefecture population. I added coastline length, surface water area, and land area culled from the Historical Statistics of Japan.Footnote 22 A third source of data is the Ekimei Jiten handbook (Chuo Shoin Reference Chuo1995), which provides a comprehensive list of all rail stations established in the country, their founding dates, locations by city and prefecture, and other identifying information. I use the earliest year a station was opened in each prefecture to determine access, and verified these dates with secondary sources.Footnote 23

I use a difference-in-differences methodology, comparing the annual measures of firm activity in each prefecture before and after it gains railroad access to those with no change to their rail access over the same period.Footnote 24 Following the economic geography and transaction cost literatures, which predict that railroad access increases factor and goods mobility through lower transportation costs and wider market access, this methodology examines whether one observes an increase in firm activity after the introduction of the rail. In other words, one can test the hypothesis that the number of firms and levels of invested capital would increase when areas become connected to the network. Moreover, capitalization levels should differ by sector: because of scale economies, manufacturing would be more affected by rail access than the primary sector. Similarly, one expects increased total capitalization in the services sector, which includes the rapidly expanding financial industry during this period, to facilitate local industrial investment.Footnote 25 Finally, changes in firm activity will depend on pre-access market size, leading to agglomeration in larger markets and dispersion in smaller ones. The reduced form OLS model follows, with separate regressions for each major industry group:
-
yit = β0 + β1·x1it + β2·x2i + β3·x3t + β4·x4it + εit , where
-
yit = firm activity for prefecture i in year t
-
x1it = rail access dummy variable for prefecture i in year t
-
x2i = prefecture-fixed effect
-
x3t = year-fixed effect
-
x4it = interaction of rail access and control variables for prefecture i in year t
-
εit = error term
To measure the effect on firm activity, the dependent variable yit is one of three measures: the total annual number of firms in each of the prefectures, indexed by i; the total capitalization of firms by prefecture; and the average capital per firm in each prefecture. These three variables capture extensive (firm number, total industry capital) and intensive (average firm capital) firm activity over time. The dependent variables are available for the economy as a whole and for each of the major industry groups, with the results from the latter allowing one to determine their relative contribution to the national economy.
The main control variables of interest are the term x1it , which takes the value of zero for all years prior to rail access in prefecture i and the value of one in post-access years, and the interaction terms x4it that account for initial conditions at the prefecture level that are exogenous to the arrival of the railroad.Footnote 26 These variables include the prefectural population in 1882, prefectural coastline length, surface water area, and land area. Prefectural population in 1882 can be interpreted as a crude proxy for local market demand and agglomeration potential. Similarly, coastline length and surface water are used to proxy for access to coastal and inland water transport, which may act as substitutes or complements to rail transport. Land area is used to control for differences in the time needed for rail construction and market density, given the inclusion of initial population. Finally, fixed effects for prefecture and year are also included in the model to allow for local or temporal variation.
This article uses the years between 1883 and 1893 to identify a treatment period, and thus separates the country's prefectures into two groups: a treatment group of 18 prefectures that gained access during this period, and a control group of 18 prefectures that gained access after 1893.Footnote 27 The starting year was selected based on the earliest available data while the end year was selected for three reasons: first, it precedes the Sino-Japanese War (1894/95), which contributed to a dramatic expansion of the public investment in armaments and public works and may have had knock-on effects to firm activity that differed substantively from previous years. Second, the 1893 Commercial Code led to a reclassification of enterprise ownership, which makes the numbers reported not directly comparable to earlier years. Lastly, this year also marks the promulgation of the previous year's Railway Construction Act, which increased the scope of private investment in railways. In terms of historical significance, this period also coincides with the first wave of railway expansion and the onset of industrialization.
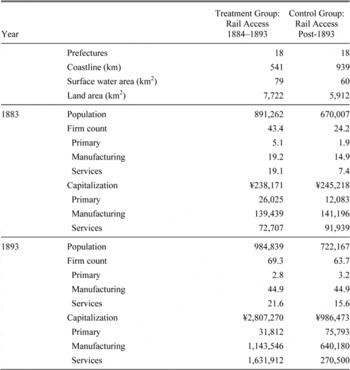
For a causal interpretation of estimates based on the difference- in-differences methodology, two conditions should be met. The first is in the choice of control and treatment groups, which must be similar in aspects aside from the treatment (i.e., rail access). This seems reasonable given the government's aim to connect all prefectures to the national system, which was largely accomplished by the end of the Meiji period.Footnote 28 While commercial activity and population size were considerations of the government in deciding the placement of railways, they were not determining factors.Footnote 29 Thus, separating control and treatment prefectures becomes effectively an issue of timing, and prefectural differences were largely due to geography. In particular, official documents indicate that terrain difficulty was the primary impediment to railway construction to certain prefectures, with those gaining earlier access located along the low-lying plains and coast.Footnote 30 This natural variation allows for division of the prefectures into control and treatment groups based on year of access and other time-invariant features. Table 3 compares the control and treatment prefecture groups with a breakdown of various characteristics.
To increase the comparability of prefecture groups in the analysis, estimates from specifications that exclude prefecture outliers are reported along with those including all prefectures. Outliers are identified as prefectures in either the top or bottom 5 percent of any of the following variables: population in 1882, coastline length, surface water area, and land area. An additional robustness check uses only prefectures located on the main island of Honshu, which had railways that did not require other forms of transport to reach the major cities of Tokyo and Osaka and their nearby ports, and is the location of the major pre-Meiji land routes.
The second condition for a causal interpretation is that the decision to extend the railway network was not itself determined by the measured outcomes of firm activity. In other words, entrepreneurs intending to establish firms or expand operations should not have influenced the decision to introduce rail access to a particular location. As mentioned above, geographic considerations figured prominently in the timing and selection of prefecture access, with considerable delays occurring due to land gradient and government preoccupation with possible invasion along the eastern coast of Honshu (facing the Pacific Ocean). Prior to the 1892 Railway Construction Act, private rail companies needed to submit applications to construct and manage railways planned by the railway ministry, with no guarantee of approval. Official reports from the railroad ministry indicate that the main priorities of railway construction were to facilitate transportation between regions, to increase national security, and to promote industry.Footnote 31 That is, the government's objective to establish a railroad network at the start of the Meiji period was not explicitly for commercial development.Footnote 32

In practical terms, extensions of the system north and west of Honshu connected population centers usually along the most geographically and cost-efficient paths and were meant to (and did) facilitate troop movements and securing the Pacific coastline, which was considered more vulnerable to foreign invasion.Footnote 33 Moreover, before the creation of the national parliament in 1890 and the passage of the 1892 Railway Construction law, there was no explicit local and commercial lobbying for the placement of railroad track.Footnote 34 To address concerns about endogeneity, the analysis uses data up to the year 1893 and includes specifications that only use as a control group prefectures that did not gain rail access until after the period of analysis. There is also a robustness check that includes only those prefectures whose capital cities gained access the same year as the prefecture in general.
RESULTS
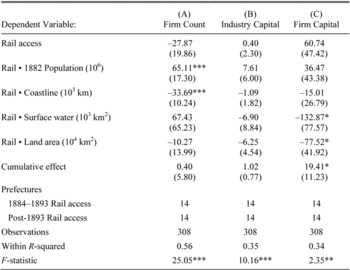
The baseline results from the regression model are presented in Table 4 and include all 47 prefectures in the country. The three columns have different measures of industrial activity (firm numbers, industry capital, average firm capital) as the dependent variable, respectively, and use the difference-in-differences framework with a treatment window of 1884 to 1893. Across these specifications, the coefficient for rail access alone varies in sign and statistical significance, and the cumulative effect of rail access is not statistically significant in any specification.Footnote 35 However, the coefficient on the interaction of rail access and initial population is positive and statistically significant. Thus, in cross section, prefectures with larger populations saw increased firm numbers in the years following rail access. At the same time, longer coastlines are negatively associated with firm numbers, which suggests the relocation of firms away from the coast toward inland areas and possible substitution away from coastal shipping. The statistically insignificant cumulative effect indicates that, perhaps surprisingly, overall firm numbers were not affected by rail access, even if distributional differences can be observed from various interaction terms.
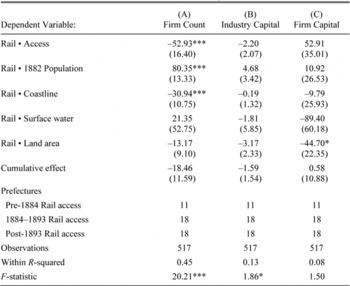
The reader might worry that prefectures in the control and treatment groups may not be comparable given intergroup differences in construction matter, I exclude prefecture outliers as described in the previous section as well as the subset of prefectures that gained rail access before the treatment window, allowing a cleaner interpretation of the rail access effect. Results in the restricted sample, shown in Table 5, are consistent with those from the full set of prefectures, with a positive coefficient on the interaction of rail access and initial population and a negative coefficient for the interaction of rail access and coastline length on the number of firms (column A).
DIFFERENCE-IN-DIFFERENCES RESULTS, ALL PREFECTURES

* Significant at the 10 percent level.
** Significant at the 5 percent level.
*** Significant at the 1 percent level.
Notes:
All specifications include prefecture- and year-fixed effects and cover the years between 1883 and 1893. Robust standard errors are clustered by prefecture. Industry capital level is in nominal ¥1,000,000 while average firm capital is in ¥1,000. Cumulative effect calculated using averages of 1882 population, coastline, and surface area across included prefectures.
Source:
See the text.
DIFFERENCE-IN-DIFFERENCES RESULTS, RESTRICTED SAMPLE

* Significant at the 10 percent level.
** Significant at the 5 percent level.
*** Significant at the 1 percent level.
Notes:
All specifications include prefecture- and year-fixed effects and cover the years 1883 to 1893. Robust standard errors are clustered by prefecture. Industry capital level is in nominal ¥1,000,000 while average firm capital is in ¥1,000. Cumulative effect calculated using averages of 1882 population, coastline, and surface area across included prefectures.
Source:
See the text.
The main difference with the previous table is in the specification using average firm capital level as the dependent variable (column C), where the geographic features of surface water and land area interacted with rail access are negative and statistically significant. This suggests that areas with less inland water access and shorter overland distances had higher firm capital investment following the introduction of railways, which is consistent with firm scale increasing in denser markets and that rail may have complemented alternative transport types. The cumulative effect is also positive and significant in these specifications, indicating on average rail access led to firm capital investment that was higher by ¥19,412, representing a near doubling of average firm capital levels across prefectures.
DIFFERENCE-IN-DIFFERENCES RESULTS, PRIMARY SECTOR

* Significant at the 10 percent level.
** Significant at the 5 percent level.
*** Significant at the 1 percent level.
Notes:
All specifications include prefecture- and year-fixed effects and cover the years 1883 to 1893. Robust standard errors are clustered by prefecture. Industry capital level is in nominal ¥1,000,000 while average firm capital is in ¥1,000. Cumulative effect calculated using averages of 1882 population, coastline, and surface area across included prefectures.
Source:
See the text.
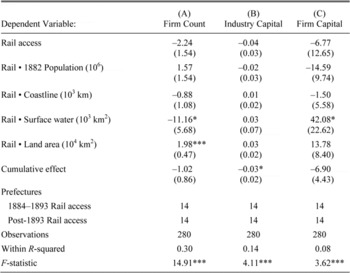
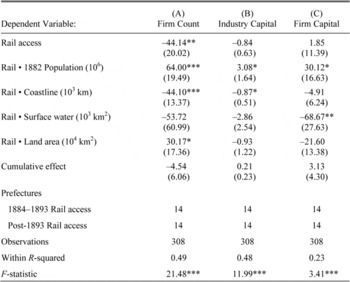
Since it is likely that the impact of rail access varied across major industry groups, regressions using the same specifications as in Table 5 were performed on the primary, manufacturing, and services sectors.Footnote 36 For the primary sector, shown in Table 6, rail access interacted with surface water area decreases firm counts (column A) and increases average firm capital (column C), while the interaction with land area increases firm counts only. For both dependent variables, the cumulative effect is negative, but not statistically significant. In contrast, total industry capital levels (column B) do not appear to be impacted by rail access and its interactions with other control variables, but its cumulative effect is weakly negative. These results suggest railroads facilitated extensive growth of primary sector firms in areas with fewer alternative transport options due to distance or inland water access, although the overall impact was negligible across specifications. For manufacturing, shown in Table 7, rail access affected the distribution of firm activity both at the extensive and intensive margins. That is, prefectures with higher initial populations gained a disproportionate share of firms and capital investment following the introduction of railways, while the net cumulative effects are not statistically significant. This finding is consistent with agglomeration economies, where firms increase in number and scale in larger markets at the expense of more remote areas, and corroborates the findings from Atack, Haines, and Margo (Reference Jeremy, Haines and Margo2008) regarding American factory establishment. That overall firm numbers and scale did not significantly differ may be due to the early stage of development, as heavier industries did not become prominent in the economy until the early 1900s. Both coastline length and surface water area are negative and occasionally significant for the three dependent variables, which suggests that areas with less coastal or inland water transport benefitted more from railways. As seen in previous tables and anecdotal accounts of the coal and textile industries, an interpretation of this result is that the different forms of transport acted as complements to each other, not substitutes.
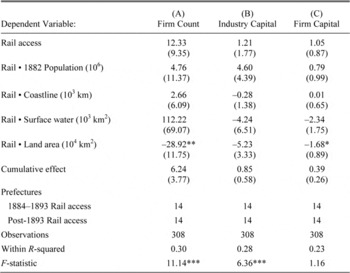
The results for the services sector, in Table 8, indicate that railways, when interacted with initial population and water transport access, did not significantly affect extensive or intensive firm activity. This can be seen in the insignificant cumulative effects across all three specifications. Among the interaction terms, prefectures with larger land areas had fewer and smaller firms once the railways were introduced. These estimates differ from those using the full set of prefectures (not shown), which have significant cumulative effects of railways. This difference may reflect the activity of financial firms, which form a large component in number and capital within the services sector, but were more concentrated in Tokyo and Osaka and the pre-1884 rail accessible prefectures surrounding them.
To check the robustness of these results, the prefectures in the control and treatment groups are restricted in two alternative ways. Since railways may have entered a prefecture in a year prior to reaching its capital city, which was usually the local economic center, one way to mitigate endogeneity concerns about nonstrategic construction of railways per the government's plan is to analyze only prefectures that had coincident years of entry in both the prefecture and its capital.
DIFFERENCE-IN-DIFFERENCES RESULTS, MANUFACTURING SECTOR

Notes:
* Significant at the 10 percent level.
** Significant at the 5 percent level.
*** Significant at the 1 percent level.
Notes:
All specifications include prefecture- and year-fixed effects and cover the years 1883 to 1893. Robust standard errors are clustered by prefecture. Industry capital level is in nominal ¥1,000,000 while average firm capital is in ¥1,000. Cumulative effect calculated using averages of 1882 population, coastline, and surface area across included prefectures.
Source:
See the text.
Along with the exclusion of outlier prefectures, this allows for more precise estimates of the railroad effect, and further reduces the number of treated prefectures from fourteen to eight.Footnote 37 The second robustness check limits analysis to prefectures located on the main island of Honshu, which isolates the effect of rail network expansion to prefectures with direct rail links with the major cities of Tokyo and Osaka and overlaps with the pre-Meiji major road networks. Both the treatment and post-1893 control group decrease to eleven and nine, respectively.Footnote 38
DIFFERENCE-IN-DIFFERENCES RESULTS, SERVICES SECTOR

* Significant at the 10 percent level.
** Significant at the 5 percent level.
*** Significant at the 1 percent level.
Notes:
All specifications include prefecture- and year-fixed effects and cover the years 1883 to 1893. Robust standard errors are clustered by prefecture. Industry capital level is in nominal ¥1,000,000 while average firm capital is in ¥1,000. Cumulative effect calculated using averages of 1882 population, coastline, and surface area across included prefectures.
Source:
See the text.
The results from the robustness checks, which are not shown, correspond with those in the earlier tables, but are larger in magnitude and at a higher level of statistical significance. For example, average firm capital across all sectors increases markedly in post-rail access years, between ¥33,855 and ¥41,819 for a cumulative effect and much larger than the period average of about ¥16,000 for rail inaccessible prefectures in those specifications. In terms of distribution, prefectures with higher initial population gain a disproportionate number of firms, while those with longer coastlines see fewer. Total industry capital is also positive and weakly significant among Honshu prefectures.
Among primary sector firms, the interactions of rail access with surface water and land area generally carry the same signs as before but are less significant, and the cumulative effect is insignificant across all specifications. In contrast, average firm capital is much greater for manufacturing firms following the introduction of railways, and initial population is positively associated and significant with all firm activity measures. Interacted with rail access, larger land area is associated with additional, but smaller firms, while coastline length and surface water give results varying in sign and significance. Finally, firm activity in the services sector is also more significant than in the unrestricted specifications, with both robustness checks giving a positive cumulative effect of railways on average firm capital. As before, the interaction of rail access with land area is negative and significant across specifications, indicating possible concentration of financial intermediaries and resources.
CONCLUSION
The findings from the difference-in-differences analysis suggest that for the economy as a whole rail access had a positive impact on firm capital. Since this capital is correlated with both scale and future productivity, this result is consistent with improved transport leading to increased production to serve a widened market, and corroborates findings from other studies on establishment size. Rail access also led to more efficient production, with a redistribution of firms from smaller to larger markets as measured by initial prefectural population, despite the overall number of firms not changing significantly. This result confirms the prediction of economic geography models that following declines in transport costs manufacturing tends to concentrate in areas with bigger sources of factor inputs and demand. Estimates for major industry groups bolster these findings, with considerable movement of manufacturing firms to more populous prefectures and areas with less coastal access, possibly to take advantage of labor released from the traditional sectors located inland (for example, textile production in central Honshu). Coastline length and surface water area, both used to proxy for water transport access, are consistently negative when interacted with rail access for manufacturing firms. It is likely that railroads augmented existing transport methods, increasing firm activity in areas poorly served either by coastal or inland water shipping, or enabled access to raw materials that would have been too difficult or costly to transport otherwise. Firm activity in the services sector also increased on average from rail access, with higher levels of firm capital and, to a lesser extent, total industry capital.
In terms of economic significance, translating increases in capitalization to output may be problematic at the subnational level. This is particularly true given that many of the specifications exclude Tokyo and Osaka in order to satisfy the comparability condition of the difference-in-differences framework, and these two cities were the major centers of economic activity in the country. Nevertheless, if capital shares from the different groupings of prefectures are representative of overall capital investment, and this in turn contributes to productivity, then the results can still be used to gauge the impact on the national economy.Footnote 39 Thus, some natural extensions of this work would be to specify the transmission of investment into output levels or to use disaggregated price data in prefectures both prior to and following rail access.
Finally, while agglomeration may occur naturally with changes in technology and transaction costs, entrepreneurs may not have been able to take advantage of the improved infrastructure due to certain features of the Japanese rail system and its use. These include private monopolies of regional tracks and the precedence of passenger over freight traffic, which led to excess demand for freight services (Nagao Reference Nagao1929, pp. 18–19). A consequence of this was that railways were not obliged to provide discounts for bulk shipping, and thus reduced the incentive to produce more than what was locally demanded, which is one of the qualifications of the Krugman model.Footnote 40 Determining the types of goods shipped from certain locations to others and whether there were relationships between the rail companies and individual firms may show how competitive the market was for rail freight.
Taken as a whole, the analysis supports key features of the narrative about Japanese economic development and the impact of improved transportation at large. Over the course of a few decades, Japan moved steadily into more capital-intensive manufacturing, and railways facilitated that by allowing for larger firms and the more efficient location of activities. With a national rail network in place by the turn of the century, the economy could focus on industries that fully exploited the infrastructure and thus better integrate into the international economy. Although the redistributive effects suggest that the railroad's contribution to overall economic growth is unclear in the short term, concentrating firm numbers and resources within sectors and across regions may have had a longer lasting impact.