Introduction
The mammalian kidney is a complex organ that has evolved to control a wide range of physiological processes. These processes include blood volume, blood pressure, osmotic pressure, waste removal, and metabolite homeostasis. Normal kidney development requires reciprocal formation of the ureteric bud and metanephric mesenchyme. This is followed by an iterative branching process and cascade of signaling to maintain a renewable pool of progenitor cells, which produce the differentiated cells that perform the diverse functions of the kidney. Reference Little and McMahon1,Reference Jain, Encinas, Johnson and Milbrandt2
The duration and end of nephrogenesis vary across species. In humans and nonhuman primates, birth and the end of human nephrogenesis occur at similar time points; nephrogenesis ends at about 35 weeks of gestation humans. Reference Hinchliffe, Sargent, Howard, Chan and van Velzen3 Species that deliver litters of offspring often have a variable period of natural postnatal nephrogenesis. Reference Hartman, Lai and Patterson4 Nephron number varies by species, strain, sex, and environmental and genetic factors. Reference Charlton, Springsteen and Carmody5 Human nephron number is highly variable (200,000–2.7 million), based on studies at autopsy. Reference Keller, Zimmer, Mall, Ritz and Amann6–Reference Hayman and Johnston10 A wide range of nephron numbers has also been observed in human neonatal autopsy, suggesting this range is established during nephrogenesis. Reference Zhang, Quinlan and Hoy11
Nephron number may determine susceptibility to numerous renal pathologies,Reference Luyckx and Brenner12–Reference Bertram, Douglas-Denton, Diouf, Hughson and Hoy14 and nephron loss can accelerate the development of chronic kidney disease (CKD).Reference Brenner and Mackenzie15 It is thus important to consider the causes of low nephron number and loss and to understand why such a wide range in nephron number remains in humans. There is increasing evidence that genetics and epigenetic factors determined by maternal health and nutrition are critical determinants of nephrogenesis. Fetal development is constrained by energy available from the mother, regulated by placental function. Evolutionary selection pressure governed by reproductive fitness has prioritized brain growth over fetal and early postnatal kidney development,Reference Chevalier16 with over 50% of resting metabolic rate being allocated to the brain through the first year of life. Thus, maternal undernutrition, environmental stress, or infection lead to intrauterine growth restriction or premature delivery and downregulation of DNA methylation in nephron progenitor cells. The molecular mechanisms necessary to develop a healthy kidney have been mainly studied in rodent models. However, until recently, there were few direct comparisons between renal development in rodents and in humans.Reference Lindstrom, McMahon and Guo17,Reference Lindstrom, Tran and Guo18
Nephron loss is typically overcome through hypertrophy and hyperfiltration of the remaining nephrons, evidenced by maintenance of whole kidney glomerular filtration rate (GFR). Hypertrophy is a short-term adaptation to maintain metabolic homeostasis through reproductive years. However, there are physical constraints on adaptive hypertrophy, limited by tubular surface area necessary for transport and resistance to flow resulting from increasing tubular length.Reference Wessely, Cerqueira, Tran, Kumar, Hassey and Romaker19 This constraint is overcome in the largest mammals (whales) by packaging 100 million nephrons into small unipapillary units that contain short tubules.Reference Maluf and Gassman20 Beyond reproductive years, increasing cellular oxidative injury resulting from accumulating stressors (ischemia, hypoxia, infection) promotes continued nephron loss that is superimposed on senescence, reflected by a 50% reduction in nephron number in the normal aging population.Reference Lane21,Reference Denic, Lieske and Chakkera22
Despite our growing understanding of renal development and the role of the gestational environment in establishing renal health, we still lack an integrated view of individual nephrons in the context of the intact, functioning organ. Current nonbiased methods for estimating glomerular number require destruction of the kidney, limiting their potential in longitudinal analysis and use in vivo. The development of noninvasive imaging techniques to track the number of functioning nephrons throughout the life cycle would provide key information to predict the progression of CKD and to measure the effectiveness of new interventions.
New radiological tools are being developed to address these challenges and provide a noninvasive means of tracking and measuring nephron mass in vivo. This technology has the potential to provide new insights into renal development and its role in disease progression later in life. Observations available through this technology include nephron number, glomerular volume and hypertrophy, and possibly single-nephron function. This review will outline the current state of this new technology and provide a view of its potential applications in preclinical science and clinical investigations.
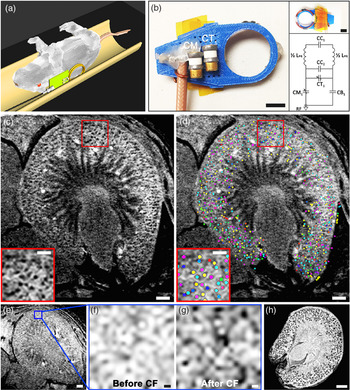
In vivo 3D cationized ferritin-enhanced MRI Reference Baldelomar, Charlton, Beeman and Bennett40 (CFE–MRI) to detect renal glomeruli. (A and B) Sprague–Dawley rats (n = 8) were imaged on a plastic bed and a custom RF probe was designed for single kidney imaging. “C” are capacitors in the resonator circuit and “L” are inductors. (C) In vivo MRI of a rat kidney after intravenous (IV) injection of cationized ferritin (CF) revealed dark punctate labeling in the kidney cortex, consistent with CF labeling on the GBM. A typical image is shown. (d) A custom algorithm identified CF-labeled glomeruli against tissue background, mapping them in 3D within the whole kidney, marked here using a random color map. (e–g) A control experiment of a rat before and after CF administration revealed spurious background variations in cortex before CF administration and distinct punctate labeling afterward. (h) Ex vivo MRI of the same kidney also revealed dark punctate labeling within the rat kidney cortex validating CF labeling onto the GBM. Scale bars: b, both insets = 10 mm; c–e = 1 mm; c and d, insets = 0.5 mm; f and g = 0.1 mm; h = 1.5 mm. Reproduced with permission from Baldelmar et al. Reference Baldelomar, Charlton, Beeman and Bennett40

Ex vivo approaches to measuring nephron number and glomerular size
The most extensively developed approaches to measure nephron number and glomerular size are based on design-based stereology. Reference Bertram, Soosaipillai, Ricardo and Ryan23,Reference Cullen-McEwen, Armitage, Nyengaard, Moritz and Bertram24 Tissue is prepared and sectioned for microscopy, and the sizes of the structures, such as glomeruli, that are observed on the slides are analyzed to infer average volumes of the structures in the original tissue. This can be performed in excised organs or from biopsy tissue by systematically and randomly sampling the tissue. The dissector–fractionator technique has revealed population-based differences in nephron number and hyperfiltration in humans Reference Kanzaki, Puelles and Cullen-McEwen25 and has been used extensively to study animal models of human diseases.
To avoid the sectioning required by stereology, new imaging approaches were recently developed to supplement biopsy data and to measure nephron number. Magnetic resonance imaging (MRI) is most often based on the detection of water protons in tissue, primarily from water, using magnetic fields. The subject or sample is placed inside a large magnetic field. Typical magnetic field strengths used for clinical MRI range from 1.5 to 7T. Preclinical MRI systems often employ much larger field strengths for high signal-to-noise and improved image contrast and resolution. MRI provides a wide range of image contrast techniques to image soft tissue and does not require ionizing radiation. MRI also provides high resolution in both preclinical and clinical systems.
Cationized ferritin (CF) was introduced as an intravenously injected contrast agent to detect and image glomeruli throughout the kidney by MRI. Reference Bennett, Zhou and Sumner26 Charged nanoparticles, including ferritin, had been used for decades to investigate the structure and function of the basement membrane using electron microscopy (EM). CF was originally created as a tracer for EM by Danon, Reference Danon, Goldstein, Marikovsky and Skutelsky27 who showed that it could bind to anionic sites. The ferritin molecule is detected in EM because of its electron-dense iron oxide core. This same iron oxide core is often magnetic, making it detectable by MRI. Reference Bennett, Zhou and Sumner26,Reference Brooks, Vymazal, Goldfarb, Bulte and Aisen28,Reference Bulte, Douglas and Mann29 This technique, CF-enhanced MRI (CFE–MRI), has been used to count every glomerulus in healthy rat kidneys, Reference Beeman, Zhang and Gubhaju30 ex vivo, and was used to measure the intrarenal distribution of glomerular volumes. CFE–MRI was also used to count and measure every glomerulus in the mouse kidney, Reference Baldelomar, Charlton and Beeman31 and glomerular volumes were mapped to reveal spatial variation in glomerular size. These findings have been confirmed by multiple groups. Reference Heilmann, Neudecker and Wolf32,Reference Chacon-Caldera, Geraci and Kramer33 Both rat and mouse measurements using CFE–MRI were validated by dissector–fractionator stereology.
CFE–MRI has also been performed in intact human donor kidneys, Reference Beeman, Cullen-McEwen and Puelles34 where CF was injected directly into the renal artery and the kidney was flushed with saline before it was fixed and imaged. CFE–MRI in human kidneys provided a three-dimensional view of the renal glomerular morphology, showing heterogeneous glomerular hypertrophy and regions of nephron loss likely associated with the patient’s untreated hypertension. Regions of nephron loss were correlated with histology from the same regions, demonstrating both vascular and glomerular sclerosis.
These initial studies focused on changes in nephron number and glomerular morphology with both chronic and acute kidney disease. In Bennett et al., Reference Bennett, Zhou and Sumner26 the distribution of CF in the kidney was redistributed due to early glomerular pathology in a rat model of focal and segmental glomerulosclerosis, before presentation of proteinuria. In mice, CFE–MRI has been applied to detect and map glomerular hypertrophy in the oligosyndactylism (Os/+) model of nephron reduction. Reference Baldelomar, Charlton and Beeman31 More recently, we showed that acute kidney injury in a neonatal rabbit model caused a detectable loss of glomeruli with vascular reorganization. Reference Charlton, Baldelomar and deRonde35 Thus, tracking changes in CF labeling by MRI may be an important tool to understand the impact of damage during development and its impact of renal health later in life.
There are some important considerations in validating CFE–MRI using other techniques, such as the dissector–fractionator stereology employed in these early studies. CFE–MRI can only measure glomeruli that are perfused, while histological approaches also detect glomeruli that are not. If the two are directly compared when there are under- or unperfused glomeruli, MRI measurements will be lower. Structural and functional factors, such as oncotic pressure, capillary perfusion rates, and glomerular basement membrane (GBM) structure, which affect CF accumulation in the GBM, are poorly understood, so it is possible that glomerular uptake is modulated by disease processes that modulate the CFE–MRI in ways that have not been described. Finally, GBM damage or proteinuria may cause leakage of the CF into the tubules, leading to diffuse rather than punctate labeling of glomeruli observed by MRI. In studies of development, the GBM charge structure and glomerular filtration vary with gestational age. In all of these cases, it is important to understand the parameters involved in CF labeling through continued investigations. It is also critical to establish the toxicology of CF, which appears minimal in healthy animals but must be investigated with each new model.
X-ray–CT has been recently demonstrated for the measurement of renal microstructure Reference Perrien, Saleh and Takahashi36 and mapping nephron number Reference Xie, Koukos and Barck37 in the intact kidney, ex vivo. A primary advantage of CT is its simplicity and speed of use and low cost compared to MRI. A disadvantage is the use of ionizing radiation, which can limit its use in vivo or in clinical applications. Nonetheless, CT offers high-resolution imaging of labeled structures ex vivo that can then be co-registered with soft tissue anatomy using other imaging modalities.
Light sheet microscopy after whole-organ optical clearing has been used to measure glomerular number and capillary tuft size in intact mouse kidneys. Reference Klingberg, Hasenberg and Ludwig-Portugall38 This attractive approach has the advantage of automation and visualization of the entire glomerulus at microscopic resolution in the whole organ or in samples of large organs.
In vivo approaches to directly measure nephron number and glomerular size
Established and emerging tools to measure nephron number ex vivo have made it possible to infer the inter and intrasubject heterogeneity in nephron number and glomerular volume. These tools are beginning to address critical gaps in our knowledge of kidney structure and how it relates to function in the kidney, in vivo. These questions include (1) What is the relationship between glomerular number and size with individual nephron filtration? (2) What is the spatial distribution of nephron number and glomerular size and its relationship to pathology? and (3) Does the rate of glomerular senescence change in health and kidney disease? Clinically, it is possible to estimate nephron number in vivo using a combination of X-ray/CT and biopsy. Reference Sasaki, Tsuboi and Okabayashi39 This type of work is beginning to provide a critical link between nephron number and renal function. Several publications have demonstrated that MRI can be used to detect individual glomeruli in a living animal. Reference Bennett, Zhou and Sumner26,Reference Baldelomar, Charlton, Beeman and Bennett40–Reference Clavijo Jordan, Beeman, Baldelomar and Bennett43 The early work in this area using CFE–MRI was limited to specific regions of the kidney. In one report, a wireless amplifier was developed to locally increase signal in the kidney to allow for co-registration of single nephrons during filtration and function. Reference Qian, Yu and Chen42 More recently, two publications have reported measurements of individual glomeruli in vivo in the entire kidney by CFE–MRI in both rats and in mice. Reference Baldelomar, Charlton, Beeman and Bennett40,Reference Baldelomar, Charlton, deRonde and Bennett41 In vivo CFE-MRI in the rat is shown in Figure 1. This approach was also used in a longitudinal experiment, demonstrating that CFE–MRI can potentially be used to monitor changes in nephron number over time in response to therapy or to track renal development.
A primary challenge with CFE–MRI in vivo is sensitivity. Deoxyhemoglobin in the blood is paramagnetic and can cause a magnetic susceptibility artifact in the capillaries that reduces the dynamic range for detecting glomeruli labeled with CF. To address this, ferritin can be modified to incorporate more iron, Reference Bulte, Douglas and Mann29,Reference Meldrum, Heywood and Mann44–Reference Jordan, Caplan and Bennett46 and the metal oxide core of the CF can be modified to make it more readily detectable without the susceptibility artifact. Reference Clavijo Jordan, Beeman, Baldelomar and Bennett43 However, other detection strategies come with trade-offs in product yield or imaging speed, so the first demonstration of CFE–MRI did not use these approaches. The key to CFE–MRI is to control motion and to ensure that the radiofrequency (RF) coil is sufficiently sensitive over the entire kidney.
Outlook for developmental nephrology: structure and function
Here, we have described emerging tools to directly measure nephron endowment, both ex vivo and in vivo. X-ray–CT provides rapid image acquisition and phenotyping, ex vivo. Tools such as X-ray–CT combined with biopsy have the advantage of being rapidly deployed in the clinic, with a disadvantage of invasiveness, use of ionizing radiation, and potential for sample bias. MRI-based approaches overcome the need for ionizing radiation and provide combined soft tissue contrast and can be used both ex vivo and in vivo. CFE–MRI requires injection of a contrast agent which must be deemed safe before it can be used in the clinic. While in vivo measurement of nephron number is in its infancy, new image acquisition sequences for rapid imaging, in addition to improved hardware and image processing, have the potential to make these MRI tools practical for routine use. As the technique matures, other pulse sequences will be deployed to reduce sensitivity to the CF-induced susceptibility artifact, and the physics of the local magnetic environment will be better understood to potentially reveal even more information. There are also unique opportunities to combine glomerular and tubular morphology with other image acquisition strategies to provide a complete view of microstructure, gross anatomy, and physiology in the kidney in vivo. This combined information can be used to study the development of nephron loss over time, a primary feature of both acute and CKDs and progressive kidney diseases during development.
The recent refinement of image visualization and segmentation, through analytical tools or by artificial intelligence, makes it possible to extract large amounts of information from three-dimensional images of tissue. Some emerging techniques, such as susceptibility tensor imaging, Reference Xie, Dibb and Cofer47,Reference Xie, Bennett, Liu, Johnson, Zhang and Lee48 promise to provide new information that can be used as a surrogate for tissue microstructure. In the kidney, this can facilitate combined maps of glomeruli, tubules, vasculature, and interstitium from a combination of co-registered images. It may also be possible to directly co-register these images to optical imaging or to information obtained by other radiological imaging modalities. It is important in each case to extensively validate these new tools and to eventually standardize some acquisition protocols across institutions to provide a high level of reproducibility. The availability and ease of use of new tools will likely drive new approaches in data science to integrate information from all of these contrast mechanisms and modalities to offer a new, quantitative view of the kidney in large numbers of subjects. In development, these tools may be eventually combined in longitudinal studies. The adoption and creation of new machine learning will be critical to this effort.
A remaining challenge is to translate measurements of nephron endowment number for in vivo imaging in humans. Reference Denic, Elsherbiny and Rule49 A clinical measure of nephron number or glomerular volume would potentially allow for individualized therapies tailored to observations in specific patients and could provide an entirely new view of human renal development.
Acknowledgements
None.
Financial support
The authors received funding from the National Institutes of Health: R01DK110622 (KB and JRC), R01DK111861 (KB and JRC). JRC is supported by the American Society of Nephrology Carl W. Gottschalk Research Scholar Grant.
Conflict of interest
K.B. and J.C. own Sindri Technologies LLC. K.B. co-owns Nephrodiagnostics, LLC. K.B. and E.B. own XN Biotechology, LLC. K.B. has a sponsored research agreement with Janssen Pharmaceuticals.
Ethical standards
All described experiments were performed with approval from an Institutional Animal Care and Use Committee in compliance with the NIH Guide for the Care and Use of Laboratory Animals.