Introduction
It is a matter of current debate whether global climate change (GCC) will affect the transmission dynamics and expansion of the geographical range of parasitic infections in human and animal populations (Marcogliese, Reference Marcogliese2001; Gitay et al., Reference Gitay, Suárez, Watson and Dokken2002; Parmesan, Reference Parmesan2006). GCC is expected to affect key environmental variables such as temperature, which in temperate latitudes plays a major role in influencing the infection dynamics of metazoan parasites in marine, coastal and freshwater hosts (Chubb, Reference Chubb1979; Kennedy, Reference Kennedy1993; Klimpel et al., Reference Klimpel, Seehagen and Palm2003; Zander, Reference Zander2003, Reference Zander2004, Reference Zander2005; Fellis & Esch, Reference Fellis and Esch2004; Simková et al., Reference Simková, Jarkovský, Koubková, Barus and Prokes2005). Data collected by Poulin (Reference Poulin2006) on larval digeneans from snails and experimental data by Koprivnikar & Poulin (Reference Koprivnikar and Poulin2009a) suggest an increase in cercarial production with a corresponding rise in temperature as a consequence of GCC. However, there are species with a restricted temperature range where cercarial production ceases or decreases, as in Maritrema novaezealandensis, Euhaplorchis californiensis or Acanthoparyphium spinulosum (Koprivnikar & Poulin, Reference Koprivnikar and Poulin2009a; Koprivnikar et al., Reference Koprivnikar, Lim, Fu and Brack2010). Therefore, it would be reasonable to expect that in some cases a rise in cercarial numbers with temperature would result in an increase in the number of metacercariae encysting in fish, which in turn would increase the risk of parasite-induced host mortality. However, it is difficult to separate the potential effect of GCC from natural patterns of variation in the infection dynamics of metazoan parasites through time.
In contrast to temperate latitudes, information on variables influencing the infection dynamics of metazoan parasites in freshwater, coastal and marine fish from tropical or subtropical latitudes is scarce (Leong, Reference Leong1986; Fiorillo & Font, Reference Fiorillo and Font1999; Steinauer & Font, Reference Steinauer and Font2003; Vincent & Font, Reference Vincent and Font2003; Vidal-Martínez & Poulin, Reference Vidal-Martínez and Poulin2003; Pech et al., Reference Pech, Aguirre-Macedo, Lewis and Vidal-Martínez2010). In these latitudes, levels of parasitic infections correlate with key environmental variables such as rainfall and temperature (Fiorillo & Font, Reference Fiorillo and Font1999; Steinauer & Font, Reference Steinauer and Font2003; Violante-González et al., Reference Violante-González, Aguirre-Macedo and Vidal-Martínez2008; Pech et al., Reference Pech, Aguirre-Macedo, Lewis and Vidal-Martínez2010). Studies on fish parasite infections in the Yucatán Península, México (Jiménez-García & Vidal-Martínez, Reference Jiménez-García and Vidal-Martínez2005) have demonstrated the importance of seasonality in the infection parameters of parasites in tropical ecosystems, suggesting a link between rainfall or temperature, the presence of new host cohorts and also maximum variability in infectivity. Subsequently, Pech et al. (Reference Pech, Aguirre-Macedo, Lewis and Vidal-Martínez2010) using time series analyses, showed that changes in rainfall patterns lead to changes in the proportion of hosts infected with a number of parasite species, whereby immediate or lagged conditions favoured an increase in the levels of infection. On the other hand, Aguirre-Macedo et al. (Reference Aguirre-Macedo, Vidal-Martínez and Lafferty2011) found no significant correlation between the percentage of infected snails with digenean parthenitae, relative to seasonality, rainfall or snail size before or after environmental disturbances such as hurricanes. Hence, there is much to learn about the effect of environmental disturbances on the parasite communities of aquatic hosts in tropical environments.
In wild host populations and under natural environmental conditions, parasites are usually aggregated or overdispersed within or on their hosts. Such aggregation is calculated from the k parameter of the negative binomial distribution whereby only a few hosts become heavily infected (Anderson, 1993; Pal & Lewis, Reference Pal and Lewis2004). The question then arises as to what the ‘normal’ level of parasite mean abundance and aggregation in hosts is through time under ‘normal’ environmental conditions, and whether aggregation varies with GCC, especially under extreme climatic events. In the present study, we consider how temporal temperature and rainfall patterns influence long-term fluctuations in both parasite mean abundance and aggregation, using the model proposed by Pal et al. (Reference Pal, Abu-Madi and Lewis2008). As a model of study we analysed data on three parasite species from the Mayan cichlid fish Cichlasoma urophthalmus, a native euryhaline species in the Yucatán Península, southern México. These three parasite species were the digeneans Oligogonotylus manteri and Ascocotyle (Phagicola) nana, both at the metacercarial stage, encysted in the intestine and muscle, respectively, and the adult fish louse Argulus yucatanus, present on the skin and fins of C. uropthalmus. Both digeneans have indirect life cycles, with O. manteri and A. (Ph.) nana reaching sexual maturity in fish (C. urophthalmus) and birds (Casmerodius albus and Phalacrocorax olivaceus), respectively, and the hydrobiid snail, Pyrgophorus coronatus as the first intermediate host (Scholz et al., Reference Scholz, Lavadores, Vargas, Mendoza, Rodriguez and Vivas1994; Jiménez-García & Vidal-Martínez, Reference Jiménez-García and Vidal-Martínez2005). Argulus yucatanus is a crustacean ectoparasite with a direct life cycle.
Materials and methods
Study site and sampling procedures
From April 2005 to September 2010 data were obtained monthly on the prevalence and mean abundance of, O. manteri (Digenea: Cryptogonimidae), A. (Ph.) nana (Digenea: Heterophyidae) and A. yucatanus (Crustacea: Branchiura) parasitizing the Mayan cichlid from Celestun, a coastal lagoon located on the north-western corner of the Yucatán Península (20°45′N, 90°25′W), south-eastern México. Environmental data were provided by the ‘Comisión Nacional del Agua’ (National Water Commission, México) from its weather station in Celestun (at a distance of 2 km from the lagoon). The lagoon, up to 22 km long, and on average 2.1 km wide, is a tropical and dynamic brackish water ecosystem receiving freshwater from groundwater discharges that vary with rainfall (Herrera-Silveira, Reference Herrera-Silveira1994). Although the regional climatic conditions are not always well defined in the study area, three seasons occur, namely a dry season with low precipitation levels (March to May, 0–50 mm and 14–38°C), a rainy season (June to October, >500 mm and 21–35°C) and a winter frontal storm ‘Nortes’ season (November to February, 20–60 mm). The latter is characterized by relatively strong winds (>60 km/h), marked and rapid daily decreases in air temperature (31 to 8°C) and a small amount (20–60 mm) of cool (9–18°C) rainfall (Hernández-Guevara et al., Reference Hernández-Guevara, Pech and Ardisson2008).
Samples of C. urophthalmus ranging from 100 to 240 mm in standard length were caught with hook and line in the middle region of the lagoon, with a sample size of 15 fish per month. The organs of each fish, especially the skin, fins, muscle, body cavity and the alimentary tract and its offshoots, were examined for parasites within 12 h of fish collection. The number of parasites was recorded, and some were fixed in hot 4% formaldehyde solution for specific identification, following standard procedures described by Vidal-Martínez et al. (Reference Vidal-Martínez, Aguirre-Macedo, Scholz, González-Solís and Mendoza-Franco2001). Significant differences in the standard length of fish were found through time by a one-way ANOVA (P< 0.05). However, the use of hook and line for fishing produced selectivity for fish between 4 and 5 years old. Thus, as most fish (90%) were within these age categories, we removed the fish younger than 4 and older than 5 years from the data sets. This strategy made all samples comparable through time, since all fish were adults between 4 and 5 years old and there were no significant differences in their standard length over time (one-way ANOVA; P > 0.05).
Data analysis
Values of prevalence and mean abundance of infection (sensu Bush et al., Reference Bush, Lafferty, Lotz and Shostak1997) of the three parasite species O. manteri, A. (Ph.) nana and A. yucatanus were used to determine the k parameter, which is the spatial aggregation parameter of the negative binomial distribution (NBD) for each parasite species in the C. urophthalmus sample. The value of k was calculated following the procedures of Pal et al. (Reference Pal, Abu-Madi and Lewis2008), using an aggregation, distribution and dichotomy (ADD) model. The procedure for the calculation of k using the method by Pal et al. (Reference Pal, Abu-Madi and Lewis2008) is essentially different from the traditional NBD where an estimate of k is made from the m (mean intensity) and v (variance). However, both estimates of k produce similar values. Consequently, both k estimates can be compared by using a chi-square test to determine the significance of differences between observed and expected frequencies of parasites in the host population. Expected frequencies in the chi-square test are derived from negative binomial probability values (Bliss & Fisher, Reference Bliss and Fisher1953). However, k calculated in the traditional way of Bliss & Fisher (Reference Bliss and Fisher1953) is relatively insensitive to variations in the degree of aggregation. In contrast, using the ADD model, the aggregation of parasites above the threshold in the host sub-population is evaluated by using an inequality model which is indexed by a scale-free parameter δ (δ ≥ 1) that provides an accurate measure of parasite aggregation.
In addition, a single spectral analysis of the Fourier series was used to simultaneously relate potential periodic cycles of mean abundance and k values for all three parasite species with rainfall (mm/day) and temperature (°C) per month. This analysis requires data points that are equally spaced in time (Press et al., Reference Press, Teukolsky, Vatterling and Flannery1996), with data for the three parasite species recorded on a monthly basis. Temporal data sets were transformed into sine curves of the same amplitude, or harmonic frequencies of different amplitudes and phases that collectively smooth the original time series (Scharlemann et al., Reference Scharlemann, Benz, Hay, Purse, Tatem, Wint and Rogers2008) and are presented as a periodogram. Harmonic frequencies, measured as spectral densities (strength of the frequency signal), represent temporal trends in the variance (Platt & Denman, Reference Platt and Denman1975). Cyclical patterns were shown at fixed monthly intervals and the results expressed as linear combinations of a set of waves to detect whether or not recurrent cyclic patterns of mean abundance or k for each parasite species were associated with temporal environmental changes. Any marked peaks in frequency were interpreted as the temporal scale of maximum variability in mean abundance and k. Spectral density values of mean abundance, k, temperature and rainfall were then used to calculate cross-correlation coefficients. Cross-correlation analysis is a widely used statistical tool to quantify temporal associations between variables. Such a correlation provides a measure of the similarity between two different data sets at different time lags and determines the extent to which data sets exhibit correlated periodic variations. Time lags refer to delayed responses of dependent variables following fluctuations in independent variables (Olden & Neff, Reference Olden and Neff2001). The time lag with the highest correlation coefficient was taken as an accurate time lag between the two time series (Wei, Reference Wei1990) and cross-correlation coefficients were calculated for a significance of P< 0.05 (Thiel et al., Reference Thiel, Romano, Schwarz, Kurths and Timmer2004).
Results
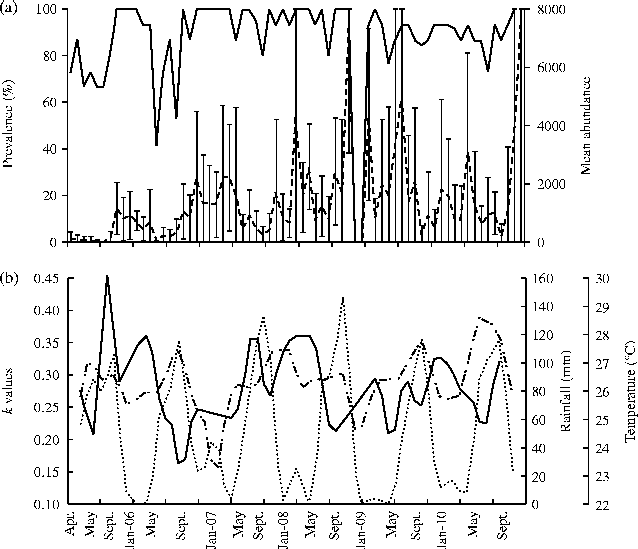
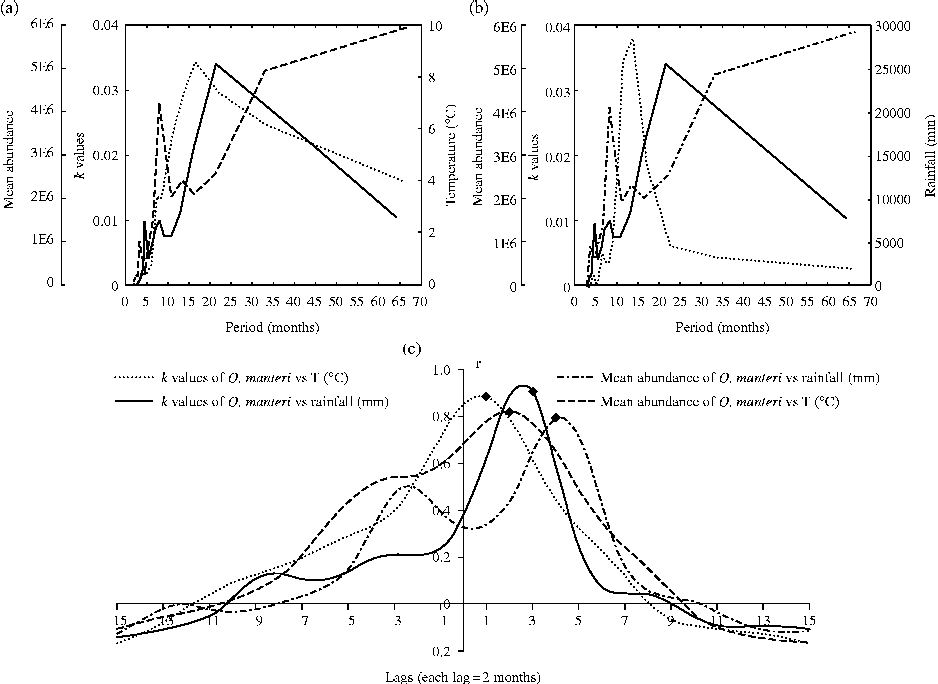
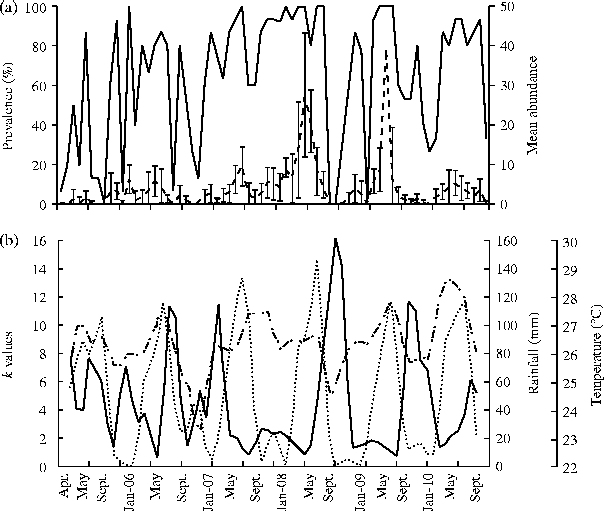
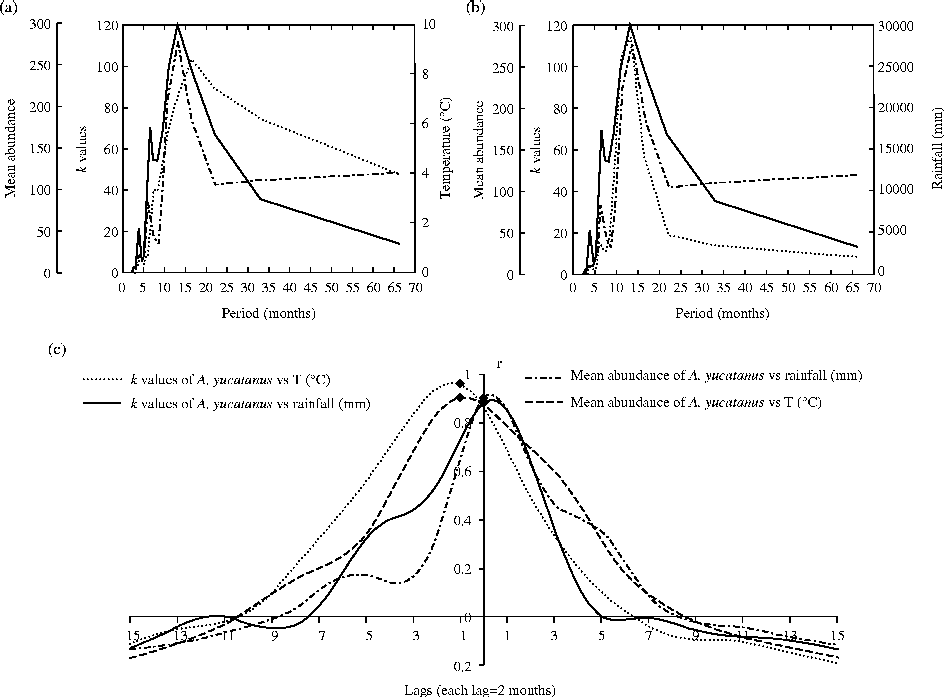
The values of prevalence and mean abundance ( ± standard deviation, SD) of O. manteri and A. (Ph.) nana in the intestine, and of A. yucatanus on the body surface of C. urophthalmus from April 2005 to September 2010 are shown in Reference Aguirre-Macedo, Vidal-Martínez and Laffertyfigs 1a, Reference Bush, Lafferty, Lotz and Shostak5a. Since the focus of the present paper was on the potential association between environmental variables and the level of aggregation of the parasites, we concentrate on the description of the patterns related to mean abundance and k values, leaving aside the patterns related to prevalence for the three parasites species studied. There was no apparent pattern between the mean abundance of O. manteri (fig. 1a) and the values of temperature or rainfall (fig. 1b). In contrast, the peaks in the values of k for metacercariae of O. manteri were apparently high when the values of rainfall were low in both the rainy (June to October) and ‘Nortes’ (November to February) seasons (fig. 1b). These patterns become more meaningful when spectral analyses of temperature, rainfall, mean abundance and k were used over a 65-month period. The first peaks in temperature and rainfall at 5 and 6 months were followed by a large peak in mean abundance and a small peak in k values at 5 and 7 months, respectively (fig. 2a and b). A further peak in temperature and in rainfall occurred at 8 and 10 months and were followed by peaks in both mean abundance and k values of O. manteri. However, the highest peak in k occurred at 24 months, apparently following preceding peaks in temperature or rainfall. In contrast, the peak in mean abundance occurred at 33 months and not at 24 (fig. 2a and b). The cross-correlation analysis showed significant values for lags 1–4 (1 lag = 2 months), demonstrating that from a peak in temperature and rainfall, significant increases in mean abundance and k occurred within the following 2 to 8 months, respectively (fig. 2c).
(a) The prevalence (—) and mean abundance ± SD (- - -) and (b) k values (—) of Oligogonotylus manteri in Cichlasoma urophthalmus, relative to rainfall (……) and temperature (– - –).

Spectral densities of k values (—) and mean abundances (– - –) of Oligogonotylus manteri in Cichlasoma urophthalmus relative to (a) temperature (- - -) and (b) rainfall (…). (c) Cross-correlations between mean abundances and k values with respect to temperature and rainfall, with significance at P< 0.05 (♦).
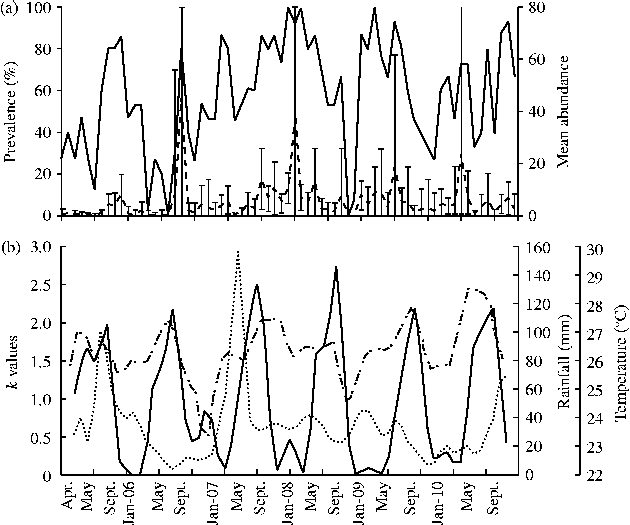
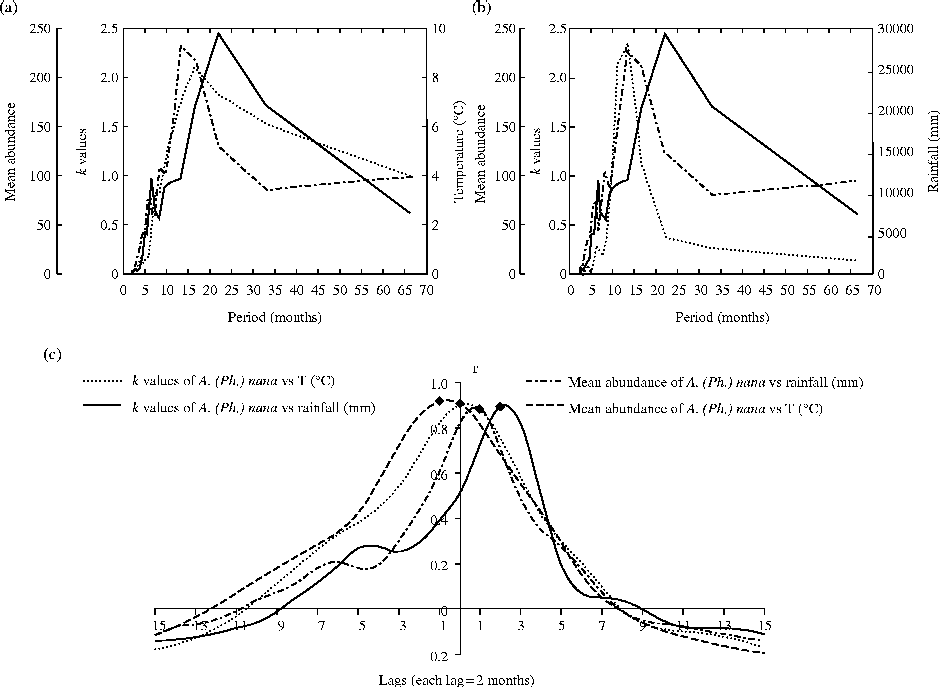
The prevalence, mean abundance and k values of A. (Ph.) nana in the intestine of C. urophthalmus are shown in fig. 3a and b, together with the temperature and rainfall throughout the whole sampling period. There were no clear patterns for A. (Ph.) nana with respect to peaks in mean abundance or k occurring in response to peaks in temperature or rainfall (fig. 3a and b). However, using spectral analysis, the peak in mean abundance apparently followed those of both temperature and rainfall on a yearly basis. In contrast, k for A. (Ph.) nana showed only two peaks occurring every 6 and 24 months, respectively (fig. 4a and b). As in the case of O. manteri, the highest peak in k for A. (Ph.) nana occurred at 24 months, following preceding peaks in either temperature or rainfall (fig. 4a and b). Since the peaks in temperature, rainfall, mean abundance and k occurred almost simultaneously, the cross-correlation analysis (fig. 4c) showed significant values for lags − 1 to 1 (1 lag = 2 months).
(a) The prevalence (—) and mean abundance ± SD (- - -) and (b) k values (—) of Ascocotyle (Phagicola) nana in Cichlasoma urophthalmus, relative to rainfall (……) and temperature (– - –).
Spectral densities of k values (—) and mean abundances (– - –) of Ascocotyle (Phagicola) nana in Cichlasoma urophthalmus relative to (a) temperature (- - -) and (b) rainfall (…). (c) Cross-correlations between mean abundances and k values with respect to temperature and rainfall, with significance at P< 0.05 (♦).
The prevalence, mean abundance and k values for the ectoparasite A. yucatanus are shown in fig. 5a and b, together with the temperature and rainfall values throughout the whole sampling period. In this case, there was no apparent association between the mean abundance and the environmental variables. However, when the values of temperature or rainfall increased, the k values also increased (fig. 5b). In the spectral analysis, the first peaks in temperature and rainfall at 4 and 6 months, respectively, were followed by small peaks in mean abundance and k at 4 and 6 months (fig. 6a and b). A further increase in temperature and rainfall occurred at 10–12 months and was followed by peaks in mean abundance and k values of A. yucatanus (fig. 6a and b). The cross-correlation analyses of temperature, rainfall, mean abundance and k values of A. yucatanus showed significant values at lags − 1 and 0 (fig. 6c). Thus, following a peak in temperature and rainfall, a significant increase in mean abundance and k occurred almost immediately.
(a) The prevalence (—) and mean abundance ± SD (- - -) and (b) k values (—) of Argulus yucatanus in Cichlasoma urophthalmus, relative to rainfall (……) and temperature (– - –).
Spectral densities of k values (—) and mean abundances (– - –) of Argulus yucatanus in Cichlasoma urophthalmus relative to (a) temperature (- - -) and (b) rainfall (…). (c) Cross-correlations between mean abundances and k values with respect to temperature and rainfall, with significance at P< 0.05 (♦).
Discussion
The present findings demonstrate that both larval digeneans O. manteri and A. (Ph.) nana exhibit their highest frequency peaks in mean abundance between 6 and 12 months, respectively, while peaks in k occurred every 24 months. In contrast, the highest-frequency peaks in both mean abundance and k for the ectoparasite A. yucatanus occurred every 10–12 months. Such a temporal difference in the peaks of mean abundance and k is likely to be due to the accumulation of larval digeneans of O. manteri and A. (Ph.) nana over time. The results also show that under a ‘normal’ rainfall and hurricane regime within the Yucatán Península, all three species of parasites respond almost immediately to the peaks in temperature and rainfall, with higher levels of infection occurring in the fish host.
To what extent do the results obtained for these three parasites in Celestun coastal lagoon apply to other coastal lagoons of the Yucatán Peninsula? Taking O. manteri as an example, in the present study we found peaks in mean abundance of up to 6000–8000 metacercariae in Celestun. Such high levels of infection with O. manteri are typical of other coastal lagoons of the Yucatán Península. For example, Salgado-Maldonado & Kennedy (Reference Salgado-Maldonado and Kennedy1997) found the mean number of individuals for the coastal lagoons El Vapor (Campeche) and Rio Lagartos (Yucatán) to be 2392 ± 9692 and 7775 ± 9854, respectively, where O. manteri was the numerically dominant species. In contrast, Jiménez-García & Vidal-Martínez (Reference Jiménez-García and Vidal-Martínez2005) found that O. manteri in C. urophthalmus in Mitza (86 km from Celestun lagoon) had mean intensities of up to 1500 metacercariae. However, Mitza is a 25-year-old gravel quarry created by the extraction of limestone for the construction industry, close to Chelem coastal lagoon, and, even when colonized by the mollusc P. coronatus and by C. urophthalmus, due to its man-made origin it cannot be considered a typical coastal lagoon of the Yucatán Península. Therefore, the temporal dynamics of O. manteri at Celestun, and certainly the dynamics of the other two parasite species, can be considered as representative of these parasites in other coastal lagoons of the Yucatán Península.
The synchronicity in the frequency peaks of both mean abundance and aggregation for O. manteri and A. (Ph.) nana (figs 2a, b and 4a, b) is probably related to both digenean species utilizing the same first intermediate host, the snail P. coronatus (Scholz et al., Reference Scholz, Lavadores, Vargas, Mendoza, Rodriguez and Vivas1994). Thus, by using P. coronatus as an intermediate host, both digeneans coincide spatially with C. urophthalmus when the cercariae of both species are released, and also when C.urophthalmus ingests this mollusc as part of its normal diet. In addition, O. manteri uses C. urophthalmus as both an intermediate and a definitive host (Scholz et al., Reference Scholz, Lavadores, Vargas, Mendoza, Rodriguez and Vivas1994; Ditrich et al., Reference Ditrich, Scholz, Aguirre-Macedo and Vargas-Vazquez1997), a strategy that should again increase the probability of transmission, resulting in the high levels of infection observed in C. urophthalmus (fig. 1a). Based on the above, the most likely explanation for the observed patterns of increase in the frequency peaks for mean abundance and k for these digeneans is that the seasonal increase in temperature should trigger the release of a large number of cercariae from the snail host, which subsequently encyst in the fish. Similar patterns of increase in the number of cercariae released due to an increase in temperature have been reported for other larval digeneans, such as Acanthoparyphium sp. (Koprivnikar & Poulin, Reference Koprivnikar and Poulin2009a) in New Zealand, Himasthla rhigedana and Parorchis acanthus in California (Fingerut et al., Reference Fingerut, Zimmer and Zimmer2003), Centrocestus formosanus in Taiwan (Lo & Lee, Reference Lo and Lee1996) and other larval digeneans (for further information, see Poulin & Mouritsen, Reference Poulin and Mouritsen2006). However, in Yucatán, rainfall increases from June to October, decreasing the salinity of coastal lagoons to 15.30 ± 6.85 PSU, and increasing water speeds through discharges from underground currents into the springs. This, in turn, results in an increase in the suspension of soft/fine sediment through the water column around the water springs (pers. obs.), inducing stress conditions for the snail and probably preventing the release of cercariae from the snail host. Additionally, this increase in the turbidity of the water could also affect the success of the cercariae in reaching their fish host. Thus, the gradual seasonal increase in temperature would induce the release of cercariae from the snail host, while the rainfall during the rainy season could affect cercaria production and performance seasonally every year. Similar patterns have been reported from experimental exposure of snails infected with digenean parthenitae of Acanthoparyphium spinulosum (Lei & Poulin, Reference Lei and Poulin2011) and Maritrema novaezealandensis (Studer & Poulin, Reference Studer and Poulin2012), decreasing the production of cercariae with a decrease in salinity.
Where do the heavily infected fish with larval digeneans go? The time series data presented here do not allow us to explore the possibility of parasite-induced host mortality as a potential mechanism, which is currently being studied elsewhere (Vidal-Martinez et al., in process). However, we can speculate that the decrease in the values of k after 24 months (figs 2a, b and 4a, b) suggests that the few hosts with heavy metacercarial infections of O. manteri are being removed from the population. High numbers of this digenean could impede the absorption of nutrients from the digestive tract of the fish (Simá-Álvarez et al., 1994), thus increasing the likelihood of mortality, or the probability of the fish host being consumed by piscivorous birds. These heavily infected fish are more likely to be the first to die off at the highest frequency peak of 24 months, resulting in more random parasite distributions. This explanation concurs with the recent meta-analysis by Robar et al. (Reference Robar, Burness and Murray2010) who suggested that parasite-induced host mortality is more prevalent in tropical latitudes compared to temperate ones.
Apart from the potential influence of parasite-induced host mortality, host immunity or metacercariae senescence could also result in a decrease in the values of mean abundance or k of O. manteri after the 24-month peaks (fig. 2a and b). Again, we can only speculate about the potential influence of these mechanisms, since they have been observed in wild fish exposed to metacercariae elsewhere (e.g. Lysne et al., Reference Lysne, Hemmingsen and Skorping1997; Voutilainen et al., Reference Voutilainen, Huuskonen and Taskinen2010) as well as in experimental infections (Sandoval-Gio et al., Reference Sandoval-Gio, Rodríguez-Canul and Vidal-Martínez2008; Martínez & Merino, Reference Martínez and Merino2011). Whether more heavily infected hosts die off in a regular cyclical manner in response to changes in key environmental variables under tropical conditions requires further investigation, particularly to consider whether such changes would significantly influence the slope of the relationship between parasite prevalence and mean abundance (Anderson & Gordon, Reference Anderson and Gordon1982; Stanko et al., Reference Stanko, Krasnov and Morand2006).
In the case of A. (Ph.) nana, the frequency peaks in mean abundance were annual, while the peaks in k occurred every 24 months (fig. 4a and b). Thus, the temporal dynamics of the mean abundance appear to be typically annual, responding to the frequency peaks in temperature and rainfall and accumulating gradually up to 24 months. In fact, it seems likely that the patterns observed in A. (Ph.) nana may resemble those of O. manteri due to the strong influence of the numerical dominance of the latter. Definitively, it is unlikely that A. (Ph.) nana could be contributing to the potential removal of the heavily infected C. urophthalmus from the population as in the case of O. manteri. Furthermore, the low mean abundance values of A. (Ph.) nana (fig. 3a) suggest that C. urophthalmus could not be the preferential second intermediate host, since many other fish species (cichlids and non-cichlids) are infected by this species as metacercaria (Scholz et al., Reference Scholz, Vargas-Vázquez, Aguirre-Macedo and Vidal-Martínez1997; Vidal-Martínez et al., Reference Vidal-Martínez, Aguirre-Macedo, Scholz, González-Solís and Mendoza-Franco2001).
In the case of the crustacean parasite A. yucatanus, lower levels of mean abundance compared to those of O. manteri are unlikely to induce fish mortality (fig. 5a). Values of k (0.19–6.7) in C. urophthalmus showed wider ranges than those reported by Webb (Reference Webb2008) for Argulus sp. occurring the freshwater tilapia fish Oreochromis niloticus (k= 0.54–1.26), or those obtained by Poulin & FitzGerald (Reference Poulin and FitzGerald1989) for Argulus canadensis in juvenile sticklebacks (k= 1.03). However, apart from behavioural responses of the fish host, A. yucatanus as an ectoparasite is more directly exposed to changes in environmental factors. In the present study, the most striking finding was the strong synchronicity between rainfall peaks at Celestun and peaks of the aggregated distribution of A. yucatanus (fig. 6b). A possible explanation is that both the ectoparasite and its host respond to temperature and rainfall at the same time, and that there is a spatial relationship between the location where the reproductive activities of the host take place and where infective stages of A. yucatanus are produced. The reproductive peak for C. urophthalmus occurs between May and July, when both temperature and rainfall are also at their highest. As in many cichlids, C. urophthalmus shows a high degree of parental care (Martínez-Palacios & Ross, Reference Martínez-Palacios and Ross1992). In early May the fish congregate on the edges of the coastal lagoon for mating and nesting. The female builds her nest, deposits the eggs and then takes care of the fingerlings over the next 2 months, while the male protects the nest. Both female and male fish live in close proximity to each other, with the male occasionally leaving the nest (Martínez-Palacios & Ross, Reference Martínez-Palacios and Ross1992). During this time, it is likely that adult parasites of A. yucatanus deposit eggs in the same nesting places as the cichlids, thus increasing the probability of transmission and, in turn, the mean abundance and level of aggregation. Further support for this interpretation is that behavioural changes (e.g. altered activity levels or differential swimming speeds) have been described to enhance infection by Argulus sp. on O. niloticus in Australia (Webb, Reference Webb2008), and by A. canadensis on juvenile sticklebacks in Canada (Poulin & FitzGerald, Reference Poulin and FitzGerald1989).
Thus far, we have described the apparently ‘normal’ temporal dynamics of the mean abundance and level of aggregation of three parasite species in tropical aquatic hosts in Celestun (figs 1–6). However, in the context of GCC, any significant increases in temperature or rainfall, together with concomitant changes in salinity and other key environmental variables, are likely to increase the risk of aquatic hosts becoming infected. For example, in fish populations exposed to high numbers of infective stages and demonstrating differential immune responses (Martínez & Merino, Reference Martínez and Merino2011), an increase in the level of parasite aggregation could occur and those few hosts harbouring heavy infections are more likely to die off, resulting in a more random parasite distribution. In the present study the apparent removal of heavily infected fish, especially those harbouring O. manteri, resulted in an aggregated dispersion becoming a random one. Within a matter of months, and between extreme periods of rainfall, these tropical host–parasite systems recovered to produce another cyclical pattern of aggregation/overdispersion. But in the context of GCC there is no published evidence to indicate that larval digeneans, such as metacercarial stages, and adult ectoparasitic crustaceans result in fish mortality. The work on larval digeneans by Poulin (Reference Poulin2006) and Koprivnikar & Poulin (Reference Koprivnikar and Poulin2009a, Reference Koprivnikar and Poulinb) focused on the relationship between cercarial production and increases in temperature, changes in salinity, water levels or pH as a consequence of GCC, rather than parasite-induced host mortality. However, recent reviews on host–parasite interactions and meta-analyses (Robar et al., Reference Robar, Burness and Murray2010; Martínez & Merino, Reference Martínez and Merino2011) have suggested that the potential effect of GCC could influence host–parasite dynamics, especially in tropical latitudes, increasing the probability of parasite-induced host mortality. Therefore, the present findings, on the temporal dynamics of three frequently occurring species of parasites in a cichlid fish population exposed to extreme climatic events in the Gulf of Mexico over the long term, suggest that under the conditions of GCC it would be reasonable to expect higher levels of parasite aggregation within such host populations, leading, in turn, to a potential increase in host pathology and mortality.
Acknowledgements
Sincere and grateful thanks are extended to all at the Laboratorio de Patología Acuática CINVESTAV-IPN Unidad Mérida (Clara Vivas-Rodríguez, Gregory Arjona-Torres, Raúl Simá-Álvarez, Nadia Herrera, Francisco Puc Itza, Trinidad Sosa Rodríguez, Abril Rodríguez González, Ana Luisa May Tec, Ana Maria Santana Piñeros, Yanis Cruz Quintana, Isabel Jiménez García, Claudia Sánchez Ramírez, Sandra Laffon Leal and many others) who have helped with field and laboratory work at different times during the period of this investigation. This study was partially supported by grant No. 44590 ‘Invertebrados como hospederos intermediarios de helmintos de Lutjanus griseus y otros peces de importancia comercial en dos lagunas costeras de Yucatán’ given to M.L.A.-M. by Consejo Nacional de Ciencia y Tecnología (CONACyT) México. We are indebted to Secretaria de Educación Pública-Programa de Mejoramiento del Personal Docente (SEP-PROMEP) for an award to support our project ‘Propuesta sobre Calentamiento Global y Cambio Climático de la Red Académica de Instituciones SEP-PROMEP del Sureste: área Sensibilidad Marina’ and to a Fondos Mixtos (FOMIX) Yucatán award in support of the project ‘Sensibilidad y vulnerabilidad de los ecosistemas costeros del sureste de México ante el Cambio Climático Global’ YUC-2008-C06-108929.