Implications
Inclusion of marker information in the selection of young breeding candidates on average improves the reliability by 0.04 compared with parent index selection. To assess the reliability of genomic predictions, it is important to reduce dependency between reference and test population, which is important for estimation of genomic reliabilities. Future successful use of genomic information in Danish Jersey requires more reliable genomic breeding values. The most efficient strategy could be through a collaboration with other Jersey populations or alternatively with other cattle populations and across breed evaluations.
Introduction
In genomic selection (GS; Meuwissen et al., Reference Meuwissen, Hayes and Goddard2001) marker effects are estimated in a genotyped reference population where individuals also have phenotypes or reliable estimates of genetic merit. The marker allele effects predicted using the reference population are then used to construct a prediction model for the breeding value of candidate animals with only marker information. These predictions are called direct genomic values (DGVs).
Reliabilities of genomic breeding values are difficult to determine. In order to optimize the use of GS in practical breeding programs, it is important to estimate the reliabilities of the DGV. Reliabilities of DGV depend on many factors such as the number of bulls in the reference population, the heritability of the trait, the genetic structure of the population and the numbers of markers used for genomic prediction (Hayes et al., Reference Hayes, Bowman, Chamberlain and Goddard2009a). All these factors may differ between populations. It is therefore important to evaluate the reliabilities of the genomic predictions in the same population from which breeding candidates are being selected. Reliabilities based on real data have been reported from Holstein populations (Hayes et al., Reference Hayes, Bowman, Chamberlain and Goddard2009a; VanRaden et al., Reference VanRaden, Van Tassell, Wiggans, Sonstegard, Schnabel, Taylor and Schenkel2009; Harris and Johnson, Reference Harris and Johnson2010; Lund et al., Reference Lund, Roos, de Vries, Druet, Ducrocq, Fritz, Guillaume, Guldbrandtsen, Liu, Reents, Scrooten, Seefried and Su2010; Su et al., Reference Su, Guldbrandtsen, Gregersen and Lund2010) and Jersey populations (Hayes et al., Reference Hayes, Bowman, Chamberlain, Verbyla and Goddard2009b; Harris and Johnson, Reference Harris and Johnson2010).
Three different methods are used in these studies to estimate the reliabilities of DGV. First, Su et al. (Reference Su, Guldbrandtsen, Gregersen and Lund2010) applied a cross-validation method to real data where subsets of proven bulls in turn are used as test bulls for predictions of DGV by omitting their estimates of genetic merit. Cross-validation has previously been used for validation on simulated data (Villumsen and Janss, Reference Villumsen and Janss2009). Second, model-estimated reliabilities have been calculated from Markov chain Monte Carlo (MCMC) samples from the Bayesian posterior distributions of the DGVs. They were used as validation criteria in the study by Su et al. (Reference Su, Guldbrandtsen, Gregersen and Lund2010). In conventional breeding value estimation (Misztal and Wiggans, Reference Misztal and Wiggans1988; Tier and Meyer, Reference Tier and Meyer2004), reliabilities of the estimated breeding values (EBVs) are also calculated from approximations of prediction error variances (PEVs) from the individual animal model solutions of genetic merit. Third, validation of the reliabilities of DGV for the group of the most recent bulls with EBV was used in the studies by Harris and Johnson (Reference Harris and Johnson2010), Lund et al. (Reference Lund, Roos, de Vries, Druet, Ducrocq, Fritz, Guillaume, Guldbrandtsen, Liu, Reents, Scrooten, Seefried and Su2010) and VanRaden et al. (Reference VanRaden, Van Tassell, Wiggans, Sonstegard, Schnabel, Taylor and Schenkel2009). Validation of the most recent 3 or 4 years of bulls seems to have become the most commonly used method (Lund et al., Reference Lund, Roos, de Vries, Druet, Ducrocq, Fritz, Guillaume, Guldbrandtsen, Liu, Reents, Scrooten, Seefried and Su2010; Van Raden et al., 2009). Interbull validation test for genomic evaluations is now based on validations of the most recent 4 years of bulls (Mäntysaari et al., Reference Mäntysaari, Liu and Van Raaden2010).
Estimates of reliabilities of DGV show substantial variation depending on the validation method used. In general, this has two consequences. First, it makes it difficult to compare the estimated reliabilities between studies using different methods. Second, the uncertainty of the true reliability of the DGV makes it difficult to predict the true value of genomic information and therefore makes it uncertain how to design the optimal breeding plan including genomic information.
The main purpose of this study is to estimate the reliabilities of DGV for traits included in the breeding goal in the Danish Jersey population using different validation methods. Three different methods for investigating the reliability of DGV are studied: fivefold cross-validation, validation for most recent 3 years of bulls and reliabilities calculated from the model. In addition, factors affecting the level of reliability are studied. Finally, the validations are compared to the predicted reliabilities (Goddard, Reference Goddard2009) and the reliability of inclusion of marker information in the selection of the young breeding candidates is compared with the reliability of pedigree index (PI) selection.
Material and methods
Data
The progeny-tested Jersey bulls in the analysis were born between 1985 and 2004. They belong to 81 paternal half-sib families with 2 to 71 sons in each family. Another 25 sires had only one son in the data set. All bulls were genotyped using the Illumina Bovine SNP50 BeadChip (Illumina, San Diego, CA, USA) (Matukumalli et al., Reference Matukumalli, Lawley, Schnabel, Taylor, Allan, Heaton, O'Connell, Moore, Smith, Sonstegard and Van Tassell2009). Single-nucleotide polymorphisms (SNPs) typing was performed at the Department of Molecular Biology and Genetics at Aarhus University.
Editing of genotypic data
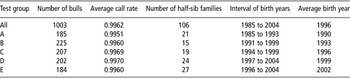
The genotypic data were edited both by animal and by loci. After marker data quality checking, 1003 bulls and 33 524 SNP markers were available. For animals, the requirements were a call rate above 95% except for a few old animals, which were accepted with call rates of at least 85%. Marker loci were accepted if they had a call rate of at least 95%. Loci with a minor allele frequency (MAF) less than 5% were excluded. Loci without a map position in the Btau 4.0 assembly were discarded. Animals with an average GenCall score (Illumina, 2005) of less than 0.65 were discarded. Individual marker typings with a GenCall score of less than 0.6 were discarded. On average 99.6% of the markers could be assigned to a genotype, with a range from 86.3% to 99.9% (Table 1). There was no evidence that the older test groups had lower call rates and therefore had a lower SNP marker quality. The genotyped bulls represent nearly all proven bulls born in the period from 1988 to 2004. Only 12 bulls from the years 1985 to 1987 were available.
Call rates of marker data and structure of the whole data set and five test groups

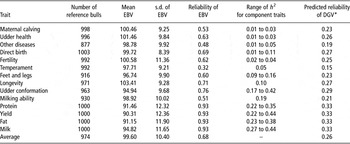
Two sets of EBVs were used as response variables for the predictions of DGV in this study. The first was EBVs published in July 2009 as the basis for predictions used in the fivefold cross-validations. The second was EBVs published in June 2006 used for the predictions of DGV in the validation method for most recent 3 years of bulls. The traits investigated were the 14 combined traits included in the Nordic Total Merit index for Danish Jersey (Pedersen et al., Reference Pedersen, Sørensen, Toivonen, Eriksson and Aamand2010). A detailed description of the index traits and the calculations of EBV can be obtained from Team Avlsværdivurdering (2009). Averaged over all traits, the number of typed bulls with EBVs was 974.
Each combined trait consists of a varying number of traits weighted with an economical value. The range of heritabilities (Team Avlsværdivurdering, 2009) for each trait included in the combined traits is shown in Table 2. The heritabilities vary from 0.01 to 0.03 for maternal calving and udder health to more than 0.20 for production traits.
Number, mean and s.d. of EBV, reliability of EBV for the reference bulls, range of heritabilities (h 2) for the component traits of each combined trait and predicted reliabilities of DGV

EBV = estimated breeding value; DGV = direct genomic value.
*Calculated from the formula derived by Goddard (Reference Goddard2009).
Statistical model
Marker effects were estimated in a Bayesian model with all SNPs included as predictors. A detailed description of the Bayesian model is given in Su et al. (Reference Su, Guldbrandtsen, Gregersen and Lund2010) and also in Villumsen et al. (Reference Villumsen, Janss and Lund2009). These procedures are used as implemented in the IBay package v1.46 (Janss, Reference Janss2009). Conventional EBV was used as response variables. In the analyses, EBVs were weighted by 1/(1 – reliability of EBV). The used reliability was the official reliability published together with the EBV. The calculations of the reliabilities are based on the expected daughter contributions.
Briefly, the following model was used to estimate marker effects:

where y is the vector of published conventional EBV; μ is the intercept; 1 is a vector of ones; m is the number of SNP markers; Xi are design matrices linking animals to the allele types of marker I; qi is the vector of scaled SNP effects (scaled by vi, which is equivalent to the standard deviation) of marker i with  , νi (νi > 0) is a scaling factor for SNP effects of marker i, and e is the vector of residuals with
 , where W is a diagonal matrix containing the weights of the EBV. The effects of SNP alleles of marker i are the products of vi and qi. Scaling factors νi were assumed to have a common prior distribution for all markers across the genome, given by

where TN is a positive half-normal distribution.
The DGV for individual k was defined as the sum of predicted effects of SNP over all markers,

where  is an estimate of the intercept and the sum
 is the deviation of the DGV from the intercept
 for each individual k. The posterior means of the model parameters,
 and
 are obtained from the MCMC sampler (Villumsen et al., Reference Villumsen, Janss and Lund2009).
The MCMC sampler was run as a single chain with a length of 50 000 iterations. Samples from the first 10 000 iterations were discarded as burn-in. Every fifth sample of the remaining 40 000 was used to estimate the parameters of the realized posterior distributions.
Reliability of DGV
Two different methods were used to investigate the reliabilities of the DGV: (i) fivefold cross-validation and (ii) validation for the most recent 3 years of bulls with EBV.
Deregressed EBVs (also known as deregressed proofs (DRPs) from January 2011 were used for calculation of the reliabilities of DGV. Calculations of the DRP followed the procedures described by Strandén and Mäntysaari (Reference Strandén and Mäntysaari2010). The reliabilities of DGV were calculated as the squared correlation between DGV and DRP divided by the mean reliability of DRP for the test bulls.
Fivefold cross-validation
The reference bulls were divided into five nearly equally sized subsets (184 to 225) according to year of birth. Table 1 shows the number of bulls per test group. Half-sib families having sons born in more than one time-period were all assigned to the same subset. Cross-validations were performed by in turn omitting EBV from one subset (test data) from the full data set, and then predicting the DGV for the test data based on the remaining data. In order to reduce dependencies between reference data and test data, bulls in the test data which had sons in the reference data were excluded from the test data set. This procedure removed 63 bulls from the calculations of the correlations.
For the validation of all bulls the reliabilities of DGV were estimated as the average of the squared correlation between DGV and DRP from each of the five test data sets. For validation of bulls with sires in the reference population or without sires in the reference population, the reliabilities of DGV were estimated as the within-year squared correlation between DGV and DRP across all the five test data sets. This procedure was used due to small number of test bulls in some of the subsets.
The most recent 3 years validation
The 860 bulls with official EBV in June 2006 were used as reference bulls. In all, 133 bulls born in 2002 to 2004 with official EBV in July 2009 were used as test bulls. The reliabilities of DGV were estimated as the squared correlation between DGV and DRP from January 2011 for these test bulls.
In order to investigate the gain in information about Mendelian sampling from the SNP marker information, the squared correlations between PI and DRP (r 2PI,DRP) were calculated for the test bulls in the most recent 3 years validation. The gain was evaluated as the difference between (r 2DGV,DRP) and (r 2PI,DRP). The PI was calculated using the EBV for the sire and the maternal grandsire (MGS) of the bull as

using the official EBVs from June 2006. Bulls with missing EBVs for their sire or MGS were removed from the calculations. This procedure removed between 2 and 30 animals from the calculations, depending on the trait.
In addition, model-estimated reliabilities were investigated in the most recent 3 years validation. The model-estimated reliabilities were obtained from the PEV following Su et al. (Reference Su, Guldbrandtsen, Gregersen and Lund2010). The reliability for a candidate ‘i’ was calculated from the formula:

where  is additive genetic variance estimated as the sum of the variance of DGV and the mean PEV for all candidates. Model-estimated reliabilities were calculated for the test bulls in the most recent 3 years validation analysis.
Moreover, predicted reliabilities of DGV for each trait were calculated using the formula derived by Goddard (Reference Goddard2009). The following values were used in the calculations: An effective population size of 42 in Danish Jersey estimated by Sørensen et al. (Reference Sørensen, Sørensen and Berg2005); the actual number of reference bulls for each trait (Table 2); a length of the cattle genome of 3000 cM (Bovine Hapmap database); mean reliabilities of EBV for each combined trait from Table 2. The results of the calculations of predicted reliabilities are presented in Table 2. Statistics for the EBV (evaluation in 2009) are given in Table 2. The number of genotyped bulls with EBV varies from 877 bulls for ‘other diseases’ up to 1003 bulls for birth index. For the reference bulls, standard deviations of EBV were calculated. For the traits fat, fertility, milk, milking ability, protein and yield index, the standard deviations were higher than 10. The bulls with EBVs included in this study are born over a long period (1985 to 2004; Table 1). In the investigated period, there is a genetic trend for all these traits, except for fertility (Danish Cattle Federation, 2010). The average reliabilities of EBV for the tested bulls range from 0.32 for temperament to 0.93 for the production traits.
Results
Reliabilities of DGV
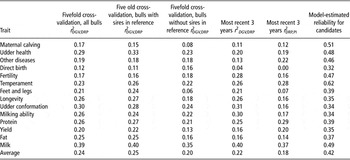
Table 3 shows the estimated reliabilities of DGV for all 14 combined traits included in the breeding goal. The r 2DGV,DRP calculated from the fivefold cross-validation method for all bulls ranged from 0.12 (direct birth) to 0.39 (milk) with an average of 0.24. The group of bulls whose sires were included in the reference group had an average r 2DGV,DRP of 0.25 across all traits with a range from 0.11 for ‘direct birth’ to 0.40 for milk. For the group of bulls whose sires were not included in the reference group, the average r 2DGV,DRP were 0.20 across all traits. The lowest value was found for ‘feet and legs’ (0.06) and the highest for milk (0.35).
Corrected squared correlation between DGV and DRP (r 2DGV,DRP) for different groups of bulls and model-estimated reliability of DGV (calculated from prediction error variance) for bulls in the test data

DGV = direct genomic value; DRP = deregressed proof; PI = pedigree index.
For the most recent 3 years prediction calculation of squared correlation between DRP and PI (r 2DGV,PI) is shown. All squared correlations are adjusted for the mean reliability of DRP.
Reliabilities assessed by the most recent 3 years of bulls were on average 0.22, which was marginally lower (0.02) than the squared correlations calculated from all bulls in the fivefold validation (Table 3). The level of the calculated reliabilities from these two methods was on average marginally lower (0.02 to 0.04) than the predicted reliabilities for DGV (Table 2), which on average was 0.26. The ranking of the reliabilities were in general constant across the fivefold validation and the validation of the most recent 3 years of bulls. Highest reliabilities were obtained for the traits milk and ‘udder conformation’. For fertility, the reliability was remarkably higher for the most recent 3 years validation. For ‘udder health’ the reliability in the fivefold validation was higher than in the most recent 3 years validation. However, the results for fertility and ‘udder health’ are in concordance with the results from the cross-validation in the youngest test group (E; Table 4).
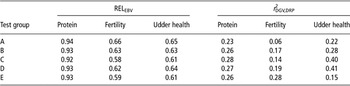
Reliability of EBV (RELEBV) and corrected squared correlation between EBV and DGV (r 2DGV,DRP) from cross-validation within test groups of bulls for the traits Protein, fertility and udder health

EBV = estimated breeding value; DGV = direct genomic value.
The corrected squared correlation between the DGV and DRP (r 2DGV,DRP) and between the DRP and PI (r 2DRP,PI) for the most recent 3 years of bulls are shown in Table 3. Averaging over all traits, the difference in reliability between DGV and PI is 0.04. Highest gain in reliabilities (above 0.10) is obtained for the traits ‘udder conformation’, ‘feet and leg’, ‘milking ability’, fertility and longevity. For the milk production traits the overall improvements are less. Model-estimated reliabilities obtained from the MCMC analyses range from 0.32 to 0.62 with an average of 0.42 (Table 3), which is about twice as high as the reliability obtained from the validation.
Table 4 presents the reliability of EBV and corrected squared correlation between DGV and DRP for each of the five test groups in the fivefold cross-validation study for the traits protein, fertility and udder health. It was observed that r 2DGV,DRP varied among the five subsets especially for fertility and udder health. For fertility, the reliability is remarkably higher in the last test group (E) and lowest in the oldest test group (A), whereas the reliability for ‘udder health’ is lowest in test group E.
Discussion
Improvements of reliabilities using marker information
Comparison of the squared correlations between DGV and DRP and the squared correlations between PI and DRP averaged across all traits shows that there is a gain in reliability of 0.04. This shows that use of genomic information adds information about Mendelian sampling, which is not obtained using PI. The information about the SNP marker effects in young selection candidates without own performance, makes DGV a strong pre-selection tool for selection of young candidates within families compared to PI information. For the Nordic Holstein population which has a three times larger reference population of 3037 reference bulls used in the validation, the gain in squared correlation was on average 0.18 for the traits protein, udder depth, somatic cell score, longevity and the fertility trait, non-return rate (Lund et al., Reference Lund, Roos, de Vries, Druet, Ducrocq, Fritz, Guillaume, Guldbrandtsen, Liu, Reents, Scrooten, Seefried and Su2010). In their study, DRP was used as response variables for predictions of the genomic breeding values.
The level of the calculated reliabilities in our study for the fivefold cross-validation and predictions of most recent 3 years of bulls are on average close to predicted reliabilities (Table 2). The predictions following Goddard's formula (Reference Goddard2009) depend strongly on the effective population size used in the predictions. Increasing the effective population size from 42 to 60 decreases the average predicted reliabilities by 0.05. Hayes et al. (Reference Hayes, Daetwyler, Bowman, Moser, Tier, Crump, Khatkar, Raadsma and oddard2009c) compared predicted reliabilities with observed reliabilities of genomic breeding values for both Holstein and Jersey populations. The conclusion from their study was that predicted reliabilities agreed well with the observed reliabilities using recent estimates of effective population size.
Relationship between reliability and heritability
In this study, there was no clear relationship between the heritability used for the calculation of the response variable and the calculated reliability for the DGV. For example, the low heritability trait ‘udder health’ has a high reliability in the cross-validation and the high heritability production traits fat and protein have low reliabilities. A possible reason is that the response variable for the prediction of DGV is published EBV, which has a relatively high accuracy even for traits with low heritability due to large daughter groups. These results are in contrast to the findings of Luan et al. (Reference Luan, Woolliams, Lien, Kent, Svendsen and Meuwissen2009) where a strong relationship between the accuracy of the prediction and the heritability of the trait was observed. Their study was carried out in the Norwegian Red with a smaller reference population of only 500 bulls. The phenotypic data used in their study was daughter-yield deviations (DYDs) with reliabilities between 0.33 and 0.66 for traits with low heritability. Therefore, the size of the reference population in their study may be too small to predict reliable SNP effects for traits with low heritability.
Connection between training and test data set
In a breeding plan with a short generation interval, the candidates might be selected for breeding before their sires are progeny tested and hence included in the reference population. In order to design optimal breeding plans, it is important to know the reliabilities of genomic predictions for the candidates, whose sires are not included in the reference population. In this study, it is seen that the level of reliabilities depends on whether the sire of a candidate bull is included in the reference population. The reliabilities were on average 0.05 higher for the cross-validation, when the sire of the candidate was in the reference population compared to bulls where the sire was not in the reference population. Similar results in a simulated cattle population were reported by Lund et al. (Reference Lund, Sahana, de Koning, Su and Carlborg2009). They stated that when sires are in the training data, genomic breeding values are estimated using both information of linkage disequilibrium (LD) in the population and sire genetic information, thus having the sire in the training data set provides more information for genomic prediction of the sons and consequently higher accuracy. For animals without close relationship to the reference population it is more difficult to connect combinations of markers with performance information compared to animals with close relationship to the reference population. The most likely reason is that the number of estimated SNP marker effects was far bigger than the number of animals with records. Villumsen et al. (Reference Villumsen, Janss and Lund2009) investigated the decay of reliabilities over generations without phenotypic information for a Bayesian model with single marker SNP effects. They showed that the reliability was reduced from 0.71 to 0.64 in the first two generations for a simulated trait with heritability of 0.02. This decay is in concordance with the reduction of 0.05 in this study, when comparing the two groups of test bulls with and without sires in the reference population.
In this study, EBVs were used for the predictions of the genomic breeding values. Guo et al. (Reference Guo, Lund, Zhang and Su2010) have, in a simulation study, shown that using EBV as response variable for the predictions provided higher or similar reliabilities compared to the use of DYD as response variable. For a Bayesian common prior model (the model used in the present study), the EBV perform slightly better for prediction of genomic breeding values both for high and low heritability traits. An EBV has, compared to a DYD or DRP, a higher reliability, as it contains all available pedigree information. For estimation of SNP effects in small populations such as the Danish Jersey, it is important to use all available information. DRP was, in this study, however, used as proxy for the true breeding values for predictions of the reliabilities of DGV in order to reduce errors of correlations between training and test data set (Amer and Banos, Reference Amer and Banos2010). The time span between the EBV used for the predictions of the DGV is maximized by use of the most recent calculated DRP from January 2011. For the most recent 3-year calculation, the time span is 5.5 years, which reduces the dependency between training and test data set. A similar design for the validation of genomic predictions is used in the study by VanRaden et al. (Reference VanRaden, Van Tassell, Wiggans, Sonstegard, Schnabel, Taylor and Schenkel2009).
In the cross-validation study, all paternal half sibs are moved to the same subset and all sires with sons in the reference data are left out in the calculations of the reliabilities. These steps ensure that the dependencies between training and test data set are minimized, but also ensure that the design in the validation is as close as possible to the realistic selection process.
Comparison of validation methods
Averaged over traits, the reliabilities obtained from the fivefold cross-validation are slightly higher compared to those from the most recent 3-year validation. This is expected because there is a lower dependency between EBV used for the predictions of DGV and the DRP used for the test bulls in the most recent 3-year validation.
Model-estimated reliabilities for the 133 candidate bulls in the most recent 3-year study are much higher than estimates from either cross-validation or the most recent 3-year validation. Similar results are found by VanRaden et al. (Reference VanRaden, Van Tassell, Wiggans, Sonstegard, Schnabel, Taylor and Schenkel2009), where expected reliabilities on average over 20 traits were found to be 13 percentage points higher compared to reliabilities calculated from validation of the most recent 4 years of bulls. VanRaden et al. (Reference VanRaden, Van Tassell, Wiggans, Sonstegard, Schnabel, Taylor and Schenkel2009) listed several arguments why model-estimated reliabilities are higher. On one hand, the reliabilities obtained from the validations may be underestimated, because the test bulls have been selected based on parent average information instead of using a random sample from the population. On the other hand, some genetic effects may not be in complete LD with the markers. This may lead to an overestimation of the model-estimated reliability. Another explanation for this overestimation could be a possible inflation of the DGV (Aguilar et al., Reference Aguilar, Misztal, Johnson, Legarra, Tsuruta and Lawlor2010), which leads to an overestimated variation of the DGV and thus an overestimated reliability of DGV.
Lund et al. (Reference Lund, Sahana, de Koning, Su and Carlborg2009) compared different methods to validate prediction models. Using simulated data, the cross-validation method turned out to be the most efficient method to validate the predictive ability of the model. The advantage of the cross-validation procedure is that this procedure makes it possible to retain a large training data set combined with a large test data set. In small cattle populations like Danish Jersey, it is particularly important that the validation procedures use the training and test data set in the most efficient way in order to reduce sampling error.
In a study on Australian Jersey, genomic EBVs for 77 candidate bulls were predicted using a reference population of 287 sires. They obtained reliabilities of 0.37, 0.14 and 0.18 for milk, fat and protein (Hayes et al., Reference Hayes, Bowman, Chamberlain, Verbyla and Goddard2009b). The model used in their study was BayesA (Meuwissen et al., Reference Meuwissen, Hayes and Goddard2001) with deregressed breeding values as response variable. These results are marginally lower than the reliabilities we found for milk (0.40), fat (0.16) and protein (0.25) in the prediction of the most recent 3 years of bulls. However, taking the small reference population into consideration, the reliabilities found by Hayes et al. (Reference Hayes, Bowman, Chamberlain, Verbyla and Goddard2009b) are relatively high compared to the expected accuracy of genomic breeding values presented by Hayes et al. (Reference Hayes, Daetwyler, Bowman, Moser, Tier, Crump, Khatkar, Raadsma and oddard2009c). The authors argue that this is due to a low effective population size and a high genomic relationship between the reference and test data set. Harris and Johnson (Reference Harris and Johnson2010) reported an average reliability of 0.55 for the traits protein, fat, somatic cell score and fertility in the New Zealand Jersey population with 1738 reference bulls using a linear mixed model. The calculated reliabilities in our study were lower than the reliabilities reported for the Nordic Holsteins (Su et al., Reference Su, Guldbrandtsen, Gregersen and Lund2010) using a much bigger reference population consisting of 3330 bulls. The predictions for the fivefold cross-validation in our study were 0.16 lower than those found by Su et al. (Reference Su, Guldbrandtsen, Gregersen and Lund2010). In the study by Su et al. (Reference Su, Guldbrandtsen, Gregersen and Lund2010), EBV was used as response variable both for the prediction of EBV and for calculation of the reliabilities. Therefore, higher estimates of reliabilities are expected due to a higher dependency between reference and test data set. For the expected reliabilities, the level in our study was 0.13 lower than the values for Nordic Holstein (Su et al., Reference Su, Guldbrandtsen, Gregersen and Lund2010). The level of the reliabilities in Su et al. (Reference Su, Guldbrandtsen, Gregersen and Lund2010) for the cross-validation is in concordance with the level predicted in Hayes et al. (Reference Hayes, Daetwyler, Bowman, Moser, Tier, Crump, Khatkar, Raadsma and oddard2009c). Different models and validation methods in the reported studies are used to calculate the reliabilities of DGV, which in general makes comparisons between studies difficult.
Improving GS
The level of the reliability obtained in Danish Jersey is expected to increase as the size of the reference population increases as shown by Goddard and Hayes (Reference Goddard and Hayes2009). The reference population can be extended either by using genomic and phenotypic information from females or through collaboration between Jersey populations. The benefits of collaboration have been shown for the European Holstein populations where four reference populations have been merged (Lund et al., Reference Lund, Roos, de Vries, Druet, Ducrocq, Fritz, Guillaume, Guldbrandtsen, Liu, Reents, Scrooten, Seefried and Su2010). As a result of this collaboration the Nordic Holstein reference population grew from 4000 to nearly 16 000 reference bulls. On average the reliabilities increased by 11% when the reference population was quadrupled. The conclusion from that study was that merging of reference populations is a very efficient way of increasing reliabilities of genomic breeding values. The reliability is also expected to increase by blending with information from the conventional PI. Results from the study by Harris and Johnson (Reference Harris and Johnson2010) showed a gain in reliability between 1.3% and 4.4% depending on trait from blending DGV with pedigree information for candidate bulls without own phenotypic information. Use of high-density SNP panels may allow using reference populations across breeds, which is an efficient way of expanding the reference population for a small breed such as Danish Jersey. De Roos et al. (Reference De Roos, Hayes, Spelman and Goddard2008) concluded that at least 300 000 markers are needed to obtain consistent marker effects across breeds. Procedures that combine all phenotypic information, pedigree and genomic information simultaneously for both genotyped and non-genotyped animals are expected to produce more accurate breeding values (Forni et al., Reference Forni, Aguilar and Misztal2011).
Conclusion
Expected gain in reliability by including genomic information in the selection decisions for new breeding candidates compared to parent index selection was on average across all traits 0.04. No clear connection between the heritability of the trait and the estimated reliability was found. Reliabilities depend on whether the sire of the candidate bull is included in the reference population. The reliability is 0.05 lower when the sire is not included in the reference population than when the sire is included. Averaged across 14 traits, the reliabilities of genomic prediction using the current reference data is in the range between 0.20 and 0.42, depending on estimation method. Estimates for the fivefold cross-validation (average 0.24) and most recent 3 years (average 0.20) provide estimates of the reliabilities that are closest to values predicted for the actual size of the reference population and the effective population size. In order to obtain reliable estimates of reliabilities it is important that the dependency between reference and test data is reduced.
Acknowledgments
This study was performed in the project ‘Genomic Selection – from function to efficient utilization in cattle breeding (Grant no. 3412-08-02253)’, funded by the Danish Directorate for Food, Fisheries and Agri Business, Mælkeafgiftsfonden, VikingGenetics, Nordic Genetic Evaluation and Aarhus University. We thank Danish Cattle Federation and Nordic Cattle Genetic Evaluation for providing phenotypic data. The work is co-funded by a PhD scholarship from VikingGenetics and the Ministry of Science, Technology and Innovation.