I. INTRODUCTION
Fossil fuel resources are close to the end and the increasing demand for energy sources created a new movement and a new goal for the scientific community, seeking highly effective unlimited energy sources. Solar energy has the potential to become the most important form of energy, because it is the most abundant inexhaustible and clean of all forms.
A. Principles of solar cells (SCs)
SCs are able to convert solar radiation (energy) to electrical power, becoming a promising device to satisfy the global need for energy. SCs can be made from numerous groups of materials: silicon-based materials (crystalline, polycrystalline and amorphous); compound semiconductor materials [Gallium Arsenide (GaAs) and CuInSe2 (CIS)]; and so forth.Reference Zou, Wang, Chu, Lv and Fan1
Amorphous silicon (a-Si)-based thin film SCs have attracted significant attention in both fundamental research and product development over the years. A list of the highest confirmed efficiencies for a range of photovoltaic (PV) cell and module technologies is periodically updated and can be easily found in the literature.Reference Simões and Neto2,Reference Barkhouse, Gunawan, Gokmen, Todorov and Mitzi3
Silicon SCs work under a basic principle: n-type and p-type semiconductors with specific structure form a p–n junction at their interface, where forming a space charge is due to the diffusion of mainstream carriers and an ever-growing built-in electric field directing from the n-type region to the p-type region, leading to reverse drifting of the majority carriers till they reached its equilibrium. This is denominated the “PV effect” where the incident light is absorbed by the electrons present in the surface and jump to the conduction band becoming free. These highly excited electrons diffuse and are accelerated into a different material (p-type), this generated electromotive force provides the electric energy that can be retrieved.Reference Zou, Wang, Chu, Lv and Fan1
B. Materials used in SCs
Although silicon-based devices are currently dominating the market of solar technology, it has several crucial disadvantages such as, short lifetime, poor stability, and high costs. And so, other materials have been tested over the years, namely Gallium Arsenide (GaAs) and indium phosphide (InP).Reference Simões and Neto2
Other approaches focus on improving the performance of different parts of the SC systems such as the different n–i–p junctions' layers, the transparent conducting windows to be applied as front and/or back electrodes, and also serving as back reflectors or protective encapsulation coatings.Reference Simões and Neto2,Reference Ellmer4–Reference Pern, Yan, Zaunbrecher, To, Perkins and Noufi6
In the search for alternative materials to be used in the SC systems, carbon is highly attractive due to the fact that it is a highly stable element, expected to have similar properties as silicon. The different stable carbon allotropes [amorphous carbon, fullerenes, carbon nanotubes (CNTs), graphene] possess a number of properties with potential application in PV industry.
This increasing interest on PV industry lead to the application of the different carbon allotropes on different SC types such as organic SCs and dye-sensitized SCs (DSSCs). This carbon allotropes were used as organic-Si heterojunction SCs, electrodes, window electrodes, photo electrodes, counter electrodes, etc.Reference Zhu, Wei, Wang and Wu7
C. Recent developments
DSSC, schematic on Fig. 1, is a photo electrochemical SC with a specific structure; its low cost, simple preparation and relatively easy manufacture make this a promising device for solar energy collecting with a strong scale up capability.Reference Zhu, Wei, Wang and Wu7
Schematic of DSSC.

The advantages of DSSCs lie in their simple production method, various material sources, relatively cheap, environmentally friendly and most of all, extensive range of applications. They have a fairly good efficiency even under poor light conditions. This device can be also used on flexible substrates, to achieve large area SC and roll-to-roll production.Reference Zou, Wang, Chu, Lv and Fan1
Likewise, organic PV (OPV) cells have the same advantages, adding the ability to easily control of molecular structures of materials (Fig. 2). Organic materials are flexible, and so can be continuously produced through low-cost wet film-forming processes. The expected development of these malleable and foldable new PV devices has been generating abundant interest.Reference Zou, Wang, Chu, Lv and Fan1
Bulk heterojunction configuration in the organic SC. Adapted from.Reference Zou, Wang, Chu, Lv and Fan1
The great mechanical and electrical properties of graphene fibers (GFs) resulted in a certified maximum energy conversion efficiency of 8.45%, much higher than any other wire-shaped PV device. These PV devices can be used as self-powered electric generators by conventional textile technology.Reference Zou, Wang, Chu, Lv and Fan1,Reference Cheng, Hu, Zhao and Qu8–Reference Lv, Yu, Wu, Shang, Wang, Hou, Fu, Wu and Zou10
Graphene's compatibility with various substrates makes it an attractive candidate for optoelectronic devices, as stated before, mainly as transparent electrodes in PV devices. This type of electrode provides several advantages, like relatively inexpensive starting materials, the work function matches with the HOMO level of most of the organic materials, the existence of p–p interactions and so forth.
II. FLEXIBLE SCs
Following the trend of traditional PV SC, flexible SCs are becoming an even more desirable topic of research and development. This flexibilization of Si SC was projected over 50 years ago, above all to replace traditional solid substrates with flexible ones, thinner, and usually plastic.
These recent PV technologies are believed to be the new way of providing cheaper electricity. It is believed that the technology will help over 2 billion people who have lack of access to the grid as well as families in the developed world facing difficulties with the increasing cost of fossil fuel resources and the electricity generated by those.Reference Pagliaro, Palmisano and Ciriminna11
A. History
The world's first flexible SC was fabricated in 1990 by Kishi and co-workers,Reference Matsuyama, Wakisaka, Kameda, Tanaka, Matsuoka, Tsuda, Nakano, Kishi and Kuwano12 on a transparent plastic substrate. The thickness of the amorphous silicon SC was only 0.12 mm and its bending radius was 5 mm, the cell had the world's biggest calorific value at the time (275 mW/g).Reference Zou, Wang, Chu, Lv and Fan1
One of the main disadvantages of using this kind of substrate is their weak tolerance to high temperatures, which make sintering of the photo electrode films unattainable. This is one of the reasons why carbon materials and conducting polymers have been presented as credible alternatives to use on the fabrication of flexible SC as substrates.Reference Toivola, Halme, Miettunen, Aitola and Lund13
B. Types of flexible SCs
DSSCs on alternative substrates to glass (metal sheets or plastic substrates) are also gaining great interest. Metal substrates in flexible SC have the advantage of being cheaper than transparent conductive oxide glass (TCO), having lower sheet resistance and enduring high-temperature processing. Plastic substrates, namely indium tin oxide polyethylene terephthalate (ITO)-PET or ITO-polyethylene naphthalate (PEN), have the advantage of being lightweight, cheap, and suitable for roll-to roll type cells and for continuous production. Setbacks are little tolerance for high temperatures (150°) and are not as efficient as glass as a protective layer from infiltration of unwanted agents (water and oxygen). Despite the reasons presented above, plastic substrates may be a good way to go because of its low cost of manufacture.Reference Toivola, Halme, Miettunen, Aitola and Lund13
Fiber-based DSSCs have the advantage of being flexible, lightweight, relatively great active surface area due to the absence of limits in terms of dimension and most of all the capability of being integrated on wearable fabrics. The measured open-circuit voltage (V oc) of the photoactive fiber was very close to the reported voltage for a normal DSSC (0.6–0.8 V). The best measured results for plastic fiber and for glass fiber were 0.42 V and 0.50 V, respectively.Reference Toivola, Halme, Miettunen, Aitola and Lund13
Kang et al.Reference Kang, Park, Ryu, Chang and Kim15 presented a DSSC flexible SC reporting an efficiency of 4.2%, with the following structure: ITO and SiO2-coated stainless steel as a substrate with a deposited layer of TiO2.
Flexible SCs are a good candidate for a group of highly interesting applications, such as portable and wearable electronics, synthetic skin, and conformal SC for building integration.Reference Schubert and Werner16,Reference Kaltenbrunner, White, Głowacki, Sekitani, Someya, Sariciftci and Bauer17 However, this cannot be achieved using traditional materials (e.g., ITO), and graphene has raised as a promising material for flexible transparent electrodes, due to its extraordinary carrier mobility, good transparency and exceptional mechanical flexibility.Reference Kim, Zhao, Jang, Lee, Kim, Kim, Ahn, Kim, Choi and Hong18–Reference Bae, Kim, Lee, Xu, Park, Zheng, Balakrishnan, Lei, Kim, Song, Kim, Kim, Özyilmaz, Ahn, Hong and Iijima22
Liu et al.Reference Liu, Li and Yan23 reported a device with the following configuration: PI/Cu/P3HT:PCBM/PEDOT:PSS/Graphene/PMMA with the following results: current density (J sc) = 10.48 mA/cm2; V oc = 0.38 V, fill factor (FF) = 34.5% and efficiency (η) = 1.39%.
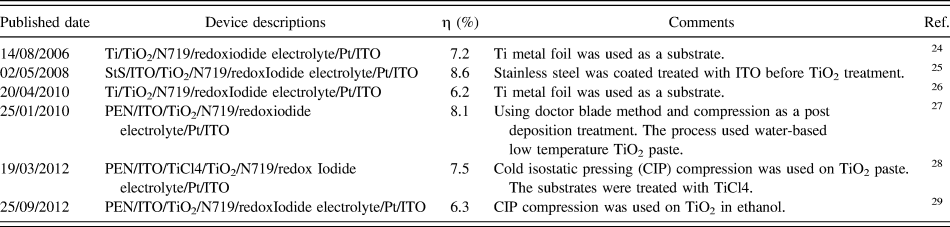
Table I describes a list of prominent publications on the development of flexible DSSCs. The maximum conversion efficiency obtained for fully flexible metal substrate-based DSSCs was 8.6%, whereas DSSCs with polyethylene naphthalate (PEN) plastic substrates has reached 8.1% efficiency.
A list of proeminent publications on flexible DSSCs.
In comparison with Si-based SC, SCs employing organic semiconductors are as efficient and less expensive with an easier production, a high flexibility, and very light, they could be easily integrated into structures already in existence. As example, an efficiency of 5.21% was reported by Konarka Technologies,Reference Kim, Cook, Tuladhar, Choulis, Nelson, Durrant, Bradley, Giles, McCulloch, Ha and Ree30 with an active layer of 1.024 cm2. There are several examples of companies already producing flexible DSSC-based solar module that have the ability to be built in several devices like camping lanterns, tents that generate their own electricity and so forth.Reference Pagliaro, Palmisano and Ciriminna11
Graphene-based materials have emerged, recently, as a single class of carbon materials with a fairly good energy conversion capability allied to low-cost and high-output fabrication via a solution base exfoliation technique. Graphene has been debated to be suitable for flexible ECs for energy storage.Reference He, Chen, Gao, Zhou, Li and Xie14
With some modification of graphene's electronic properties and the improvement of its production techniques, graphene films have the capability of substitute indium tin oxide (ITO) as conductive and flexible electrodes.Reference Li, Zhu, Wang, Cao, Wei, Li, Jia, Li, Li and Wu31
III. SYNTHESIS OF GRAPHENE
Throughout this section a number of processes to obtain single layer graphene, graphene nanoribbons, chemically derived graphene and graphene-based polymers will be reviewed. Their overall properties will also be discussed along this review paper and also graphene's potential applications.
Using exfoliation and cleavage for graphene single layer production has several key points to have in mind. In recently published studies, graphite nanoplatelets or graphene has been pointed as a viable and inexpensive filler substitute for CNTs in nanocomposites due to the extraordinary properties of graphite.Reference Kopelevich and Esquinazi32 Like CNT and other nanomaterials, the main obstacle is that unless it is well separated, aggregation is usually observed while trying to obtain large quantities of graphene sheets. This separation is essential because the unique properties of graphene are associated with individual sheets and not agglomerates.Reference Singh, Joung, Zhai, Das, Khondaker and Seal33
A. Mechanical exfoliation
Mechanical exfoliation is a simple peeling process that can be summarized in the following steps: a highly oriented pyrolytic graphite sheet is dry etched in oxygen plasma; then it is fixed onto a photoresist and skinned off; afterward the thin flakes left on the photoresist are cleaned off in acetone and finally transferred to a silicon wafer. These thin flakes were composed of monolayer or even few layers of graphene, although it lead to several exciting discoveries,Reference Novoselov, Geim, Morozov, Jiang, Zhang, Dubonos, Grigorieva and Firsov34 it is limited by its low production capability.Reference Singh, Joung, Zhai, Das, Khondaker and Seal33
B. Liquid-phase exfoliation (LPE)
LPE is yet another attractive method, because it is direct and simple, production of graphene happens just by treating of graphite powders with a solvent.Reference Bourlinos, Georgakilas, Zboril, Sterioti and Stubos35 This method typically involves the exposition of graphite or graphite oxide powders to specific solvents, which are then exposed to sonication. LPEs can be divided in three categories: exfoliations from graphite oxide, pristine graphite, expanded graphite, and sonication-free LPE.Reference Cui, Zhang, Hao and Hou36
C. Chemical oxidation
In counterpart, the chemical oxidation of graphite and the succeeding exfoliation provide huge amount of graphite oxide monolayer generating structural defects due to the chemical treatment.Reference Stankovich, Dikin, Piner, Kohlhaas, Kleinhammes, Jia, Wu, Nguyen and Ruoff37,Reference Eda, Fanchini and Chhowalla38 These defects change graphene to semiconductive, changing the electronic structure. That is why physical approaches are desirable where it is require that graphene maintains its structure. The drawbacks are the high cost and boiling point of the solvent which makes the successful deposition of graphene very difficult.Reference Singh, Joung, Zhai, Das, Khondaker and Seal33 Other examples/processes of exfoliation techniques are available on the literature, such as: mechanical exfoliation intercalating small molecules.Reference Kang, Leng and Zhang39–Reference Li, Zhang, Bai, Sun, Wang, Wang and Dai42
D. Chemical vapor deposition (CVD)
Additionally to the methods presented above, several promising approaches to produce graphene sheets have been presented, for example growth from SiC and CVD. CVD has been cataloged as one of the best techniques for large-scale production, Somani and co-workers used camphor as precursor on Ni foils, reported to be the first to synthesize few layer graphene by this method.Reference Somani, Somani and Umeno43 Several reports on the literature show the amazing progress that has been made using several different metals to obtain graphene.Reference Kim, Zhao, Jang, Lee, Kim, Kim, Ahn, Kim, Choi and Hong18,Reference Li, Cai, An, Kim, Nah, Yang, Piner, Velamakanni, Jung, Tutuc, Banerjee, Colombo and Ruoff21,Reference Stankovich, Dikin, Piner, Kohlhaas, Kleinhammes, Jia, Wu, Nguyen and Ruoff37,Reference Cao, Yu, Colby, Pandey, Park, Lian, Zemlyanov, Childres, Drachev, Stach, Hussain, Li, Pei and Chen44–Reference Wang, Li, Zhong, Zhong and Zhao48
E. Plasma enhanced CVD (PECVD)
Yet another alternative to production of graphene at a lower temperature and very short deposition time (<5 min), is PECVD. Through the production of “nanostructured graphite-like carbon” using a DC discharge PECVD, thick graphite structures were reported. Since this first testimony of the production of monolayer and few-layer graphene by PECVD, a great effort has been made to comprehend the growth mechanism, and the subsequent optimization of the experimental conditions, to control graphene films' thickness.Reference Malesevic, Vitchev, Schouteden, Volodin, Zhang, Tendeloo, Vanhulsel and Haesendonck49–Reference Zhu, Wang, Holloway, Outlaw, Zhao, Hou, Shutthanandan and Manos51
F. Other alternative methods
An alternative to all of these techniques above to obtain few-layer graphene is thermal decomposition on SiC and other substrates. An interesting approach for the semiconductor industry is the fabrication of graphite through ultrahigh vacuum (UHV) annealing of SiC surface, this is due to the absence of the need to transfer the deposited material before processing devices.Reference Forbeaux, Themlin and Debever52–Reference Varchon, Feng, Hass, Li, Nguyen, Naud, Mallet, Veuillen, Berger, Conrad and Magaud55 At the time of the temperature raise of the SiC substrate under UHV, silicon atoms sublimate leaving carbon atoms on the surface to be integrated in the existing graphene layers. The thickness obtained is determined by the annealing time and temperature used on the deposition process.Reference Penuelas, Ouerghi, Lucot, David, Gierak, Estrade-Szwarckopf and Andreazza-Vignolle56
Although it is interesting, this process has several downsides such as: control of graphene's thickness, different epitaxial growth patterns, and finally, the uncertain reason for the variation of the electronic properties on the interface existing between the substrate and graphene.Reference Varchon, Feng, Hass, Li, Nguyen, Naud, Mallet, Veuillen, Berger, Conrad and Magaud55
In an opposite side there is chemically derived graphene (derived from graphite), that has been pointed as an interesting method to obtain graphene-based single sheets in relevant amounts.Reference Stankovich, Dikin, Dommett, Kohlhaas, Zimney, Stach, Piner, Nguyen and Ruoff57–Reference Gómez-Navarro, Weitz, Bittner, Scolari, Mews, Burghard and Kern61 The result of this derivation is graphene oxide (GO), typically synthesized through the oxidation of graphite using oxidants. A number of oxidant agents can be numerated: concentrated sulfuric acid; nitric acid, and potassium permanganate.Reference Hummers and Offeman62
Using pristine graphene as a reference, GO behaves in a different way in several aspects: it is heavily oxygenated bearing hydroxyl and epoxy groups on sp3 hybridized carbon; it is highly hydrophilic and readily exfoliated in water. Given that a stable dispersion is one of the requirements.Reference Singh, Joung, Zhai, Das, Khondaker and Seal33
Chemical reduction of GO has been performed with several reducing agents including hydrazineReference Eda, Fanchini and Chhowalla38,Reference Gómez-Navarro, Weitz, Bittner, Scolari, Mews, Burghard and Kern61,Reference Becerril, Mao, Liu, Stoltenberg, Bao and Chen63,Reference Lee, Park, Ruoff and Dodabalapur64 and sodium borohydrate.Reference Lee, Park, Ruoff and Dodabalapur64–Reference Shin, Kim, Benayad, Yoon, Park, Jung, Jin, Jeong, Kim, Choi and Lee66 Taking a different path to reduce GO to reduced GO (RGO), a thermal reduction can be performed, using the heat treatment to eliminate the oxide functional groups from GO surfaces.Reference Schniepp, Li, McAllister, Sai, Herrera-Alonson, Adamson, Robert, Car, Seville and Aksay59–Reference Hummers and Offeman62,Reference Lee, Park, Ruoff and Dodabalapur64–Reference Dubin, Gilje, Wang, Tung, Cha, Hall, Farrar, Varshneya, Yang and Kaner81
Surface functionalization of GO is yet another important method to keep control of the behavior of GO and RGO under exfoliation. Various examples can be found in the literature.Reference Eda, Fanchini and Chhowalla38,Reference Stankovich, Piner, Nguyen and Ruoff82–Reference Lu, Yang, Zhu, Chen and Chen101 Other synthesis approaches include: total organic synthesis; unzipping CNTs.Reference Singh, Joung, Zhai, Das, Khondaker and Seal33
To these days, the only alternative to pristine graphene used was RGO, to accomplish this the use of toxic hydrazine vapor, and high-temperature annealing is required to transform GO into RGO. An easier way to obtain a successful dispersion in solvents to acquire monolayer RGO in large quantities in comparison to GO, is using RGO. RGO provides a better solvent solubility and dispersion due to its chemically functionalized groups. Despite that, a large number of defects still remain after the reduction, degrading the electronic properties. Nonetheless a fairly good quality graphene can be obtained by LPE of graphite powders using organic solvents.Reference Kaltenbrunner, White, Głowacki, Sekitani, Someya, Sariciftci and Bauer17,Reference Park, Rowehl, Kim, Bulovic and Kong19,Reference Luo, Vora, Mele, Johnson and Kikkawa102
LPE using organic solvents is a method that has several desirable characteristics that could turn it in an industrial solution, it is not very time consuming and cheap as well. Additionally, it has amazing high charge mobility and electronic conductivity, arousing interest in a group of specific applications like: PVs, photocatalyst, nanoelectronics, sensors, and so forth.Reference Cheng, Hu, Zhao and Qu8,Reference Rothberg and Lovinger103
The ability of GO sheet to form liquid crystals, with lamellar ordering or long-range helical frustrations simultaneously has led to GO fibers by continuously spinning this material. The successful fabrication of GO fibers was obtained by injecting the GO dispersions into a solution of 5 wt% NaOH/methanol, being the GFs further collected by chemical reduction in hydroiodic acid.Reference Cheng, Hu, Zhao and Qu8
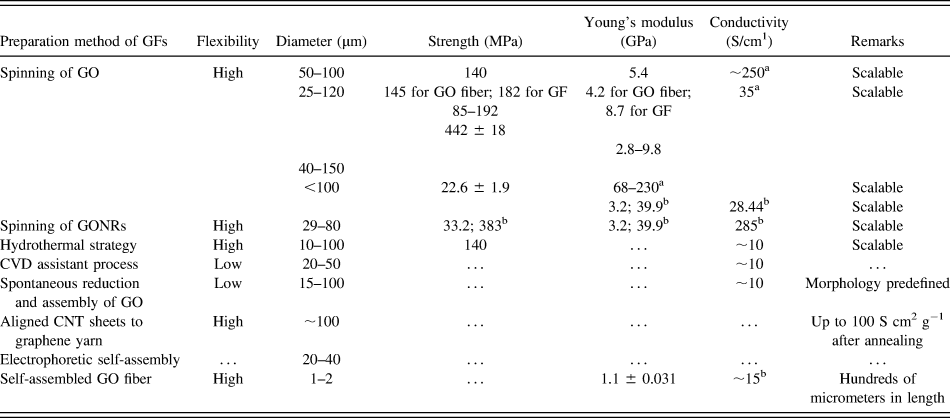
CVD deposition can also be used to obtain GFs, these fibers are from graphene films grown and transferred to an organic solvent. Then the solvent was evaporated to obtain the fiber, the evaporation rate has a significant impact on the porosity of the fibers.Reference Cheng, Hu, Zhao and Qu8 The following table summarizes the different characteristics of GFs obtained by different methods (Table II).
GFs obtained from different methods (adapted fromReference Cheng, Hu, Zhao and Qu8).
Abbreviations: CNT — carbon nanotube; CVD — chemical vapor deposition; GF — graphene fiber; GO — graphene oxide; GONR — GO nanoribbon.
a After chemical reduction.
b After annealing at high temperature.
Of all methods mentioned above, the most promising one is self-exfoliation without sonication, with several strong points mentioned like its low-energy input, high-quality, and high-concentration output. Principal challenges are the uncontrollable size and layer number, limiting the applications of graphene. All of this must be achieved avoiding graphene aggregation, aiming for monolayers of graphene or graphene nanoribbons.Reference He, Lin, Liu, Zhu, Zhao, Chan and Yan20
IV. GRAPHENE: CHARACTERIZATION AND PROPERTIES
A. Characterization techniques
Graphene characterization can be achieved by a set of different techniques: optical imaging of graphene layers; Fluorescence quenching microscopy (FQM); atomic force microscopy (AFM); transmission electron microscopy (TEM) and Raman spectroscopy.Reference Singh, Joung, Zhai, Das, Khondaker and Seal33
Often, to study the different layers of graphene, it is necessary to combine two or more techniques. Initially, the optical microscope was the most used to image the several existing layers since it was of low-cost and already accessible in laboratories worldwide. It was necessary to have a good contrast, to improve the visibility of thin sheets.Reference Jung, Pelton, Piner, Dikin, Stankovich, Watcharotone, Hausner and Ruoff104–Reference Ni, Wang, Kasim, Fan, Yu, Wu, Feng and Shen106
This in fact was a limiting factor because of the substrate that had to be used (Silicon Oxide). Another limiting aspect that affects contrast was the wave length of the incident light. The following image (Fig. 3) shows the SEM and optical image of a graphene film.Reference Lotya, Hernandez, King, Smith, Ronan, Nicolosi, Karlsson, Blighe, De, Zhiming, McGovern, Duesberg and Coleman107
(a) SEM and (b) optical images of the surface of a graphene film. Reproduced with permission.Reference Lotya, Hernandez, King, Smith, Ronan, Nicolosi, Karlsson, Blighe, De, Zhiming, McGovern, Duesberg and Coleman107
FQM procedure can also be used to study graphene, RGO, and GO, for the improvement of the synthesis process. The mechanism involves quenching the emission from a dye-coated GO and RGO, the interaction between the dye and the GO causes quenching of fluorescence.Reference Treossi, Melucci, Liscio, Gazzano, Samorì and Palermo108 On the image presented bellow (Fig. 4), some results obtained from a FQM analysis are exhibited.
(a) AFM image screening G–O single layers deposited on a SiO2/Si wafer before application of a 30 nm thick fluorescein/PVP layer for FQM. (b) FQM image of the area of the wafer, (c) after washing off the dye coating, (d) line scan data on a folded sheet show no significant deviation in thickness before and after FQM imaging (all scale bars ±10 µm). Reproduced with permission.Reference Kim, Cote, Kim and Huang150
This technique has the drawback of being limited to a specific size of the layers (micron range) due to the limited diffraction of FQM's lateral resolution, also because of the dye addition the sample cannot be re-used.Reference Singh, Joung, Zhai, Das, Khondaker and Seal33
To obtain a nanometer scale layer thickness determination, one can use AFM. AFM can only give topographic contrast and so the successful identification of the GO and the graphene cannot be achieved in normal operation mode. The impact of attractive mode of AFM to conclude on the thickness of the sheet was proved by Paredes et al.Reference Paredes, Villar-Rodil, Solís-Fernández, Martínez-Alonso and Tascón109 It was established that an error in height measurement was caused by the deformation induced by the repulsive mode. Besides imaging and thickness detection this technique has also permitted the study of a certain number of graphene properties: mechanical, frictional, electrical, magnetic, and even elastic.Reference Singh, Joung, Zhai, Das, Khondaker and Seal33
In the case of graphene and RGO, that is an atom thick, there is only one tool that can be used to determine its properties, TEM. However, TEM also has its limitations, especially at low operating voltage (to prevent damages to the monolayer), having a poorer resolution. More recently, graphene's matrix illustrating every single carbon atom arranged in hexagonal structures has been showed by Mayer's et al.Reference Meyer, Kisielowski, Erni, Rossell, Crommie and Zettl110
Yet another imaging technique was used by Gass et al., showing the atomic lattice using scanning TEM (STEM).Reference Gass, Bangert, Bleloch, Wang, Nair and Geim111 This method allows the detection of defects and contaminant atoms at atomic scale, the images presented on Fig. 5 are an example of a clean graphene monolayers surrounded by contaminants, individual contaminant atoms of higher atomic number can be seen in (b). Graphene can serve as support material in TEM since it is one atom thick and also due to its crystallinity and high conductivity.Reference Singh, Joung, Zhai, Das, Khondaker and Seal33
High-resolution images of monolayer graphene. Bright-field (a) and high-angle annular dark-field imaging (HAADF) (b) images of the monolayer. Reproduced with permission.Reference Gass, Bangert, Bleloch, Wang, Nair and Geim111
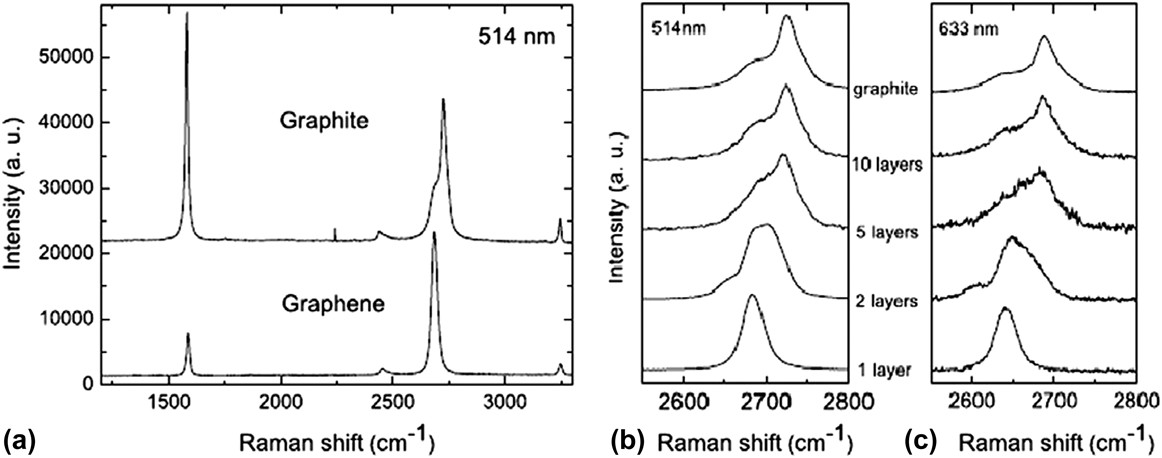
Like any other carbon allotrope, under Raman spectroscopy analysis, graphene can also be characterized, allowing the characterization of graphene layers evaluating several aspects, like: number, effect of strain, doping concentration, effect of temperature and presence of defects. The D band is usually associated with the presence of disorder in atomic arrangement of edge defect, wrinkles and charge pools. On the graphs presented bellow (Fig. 6), a comparison between graphite, single and few layers graphene is presented.
(a) Comparison of Raman spectra between graphite and single layer graphene. (b and c) Evolution in 2D band as a function of layers at 514 and 633 nm excitations. Reproduced with permission.Reference Ferrari, Meyer, Scardaci, Casiraghi, Lazzeri, Mauri, Piscanec, Jiang, Novoselov, Roth and Geim151
The absence of the D peak confirms the absence of defects on graphene. The single sharp 2D peak corresponds to the monolayer that is about four times more intense than the G peak. Raman spectroscopy has the advantage of being a nondestructive tool.Reference Singh, Joung, Zhai, Das, Khondaker and Seal33
B. Properties of graphene
Graphene is a single-layer arrangement of two-dimensional graphite, it is very transparent and absorbs just 2.3% of incident light.Reference Reina, Jia, Ho, Nezich, Son, Bulovic, Dresselhaus and Jing112 Additional to the amazing properties stated along this document, graphene has also the maximum hypothetical specific surface area ratio and half integer quantum hall effect even at ambient temperature, which has aroused great interest on the research community. This section will review graphene properties in a resumed way, because the debate of such properties and the amazing range of applications have the potential to become infinite, going beyond the purpose of this work.Reference Singh, Joung, Zhai, Das, Khondaker and Seal33
The reasons behind single layer graphene's high electronic conductivity is its high quality and low defect density of its crystal lattice, this generates scattering sites and inhibits charge transfer. Kim and co-workers showed that the electron mobility is affected by impurities trapped in between the graphene and substrate.Reference Bolotin, Sikes, Jiang, Klima, Fudenberg, Hone, Kim and Stormer113
Large area epitaxial graphene has an interesting feature, the possibility of a scale up for electronic devices, even few layers graphene on SiC showed great electronic properties but still with charge transport mobility smaller by one order compared to pristine graphene. De Heer discovered that graphene grown on carbon terminated face has a greater mobility than that that is grown on Si terminated face, and also that energy gap decreases with increasing thickness.Reference de Heer, Berger, Wu, First, Conrad, Li, Li, Sprinkle, Hass, Sadowski, Potemski and Martinez54,Reference Peng and Ahuja114–Reference Kim, Ihm, Choi and Son116
Several studiesReference Kim, Zhao, Jang, Lee, Kim, Kim, Ahn, Kim, Choi and Hong18,Reference Cao, Yu, Colby, Pandey, Park, Lian, Zemlyanov, Childres, Drachev, Stach, Hussain, Li, Pei and Chen44,Reference Reina, Jia, Ho, Nezich, Son, Bulovic, Dresselhaus and Jing112,Reference De Arco and Zhang117,Reference Yu, Lian, Siriponglert, Li, Chen and Pei118 were performed, using nickel foil as the substrate with good reported results for large area, high quality mono, and few layer graphene. Nickel foil limits the graphene films to reduced sized grains, deposition of several layers at grain boundaries and carbon solubility. Good results in copper were obtained by Ruoff and co-workersReference Li, Cai, Colombo and Ruoff119 due to carbon's low solubility in copper and its predominantly growth in single layer, achieving mobility of 4050 cm2 V−1 s.
Nonetheless, in other reported workReference Castro, Novoselov, Morozov, Peres, Dos Santos, Lopes, Nilsson, Guinea, Geim and Neto120 in which the electronic band gap of the bi-layer graphene was tuned by applying an electric field, this provides a possibility for its usage for many electronic applications.Reference Tonouchi121–Reference San-Jose, Prada, McCann and Schomerus123
A promising approach that can provide graphene in scalable amount is the use of chemical and thermal RGO.Reference Stankovich, Dikin, Piner, Kohlhaas, Kleinhammes, Jia, Wu, Nguyen and Ruoff37,Reference Li, Muller, Gilje, Kaner and Wallace68 Continuous effort has been made with the objective of improving the electrical transport properties of RGO. The conductivity and mobility of RGO compared to pure graphene, was stated to be 3 and 4 orders of magnitude respectively smaller.Reference Singh, Joung, Zhai, Das, Khondaker and Seal33
C. Optical properties
As stated before, single-layer graphene absorbs only 2.3% of incident light over a wide range of wavelengths as one can see in Fig. 7, where it is exhibited the UV spectra of graphene films with and without HNO3 doping.Reference Bae, Kim, Lee, Xu, Park, Zheng, Balakrishnan, Lei, Kim, Song, Kim, Kim, Özyilmaz, Ahn, Hong and Iijima22,Reference Nair, Grigorenko, Blake, Novoselov, Booth, Peres, Stauber and Geim124 The absorption of light increases linearly with the addition of layers, each layer absorption A = 1 − T = πα = 2.3%, where α ≈ 1/37 is the fine structure constant.Reference Singh, Joung, Zhai, Das, Khondaker and Seal33
Transmittance of different graphene layers on quartz substrates. Reproduced with permission.Reference Bae, Kim, Lee, Xu, Park, Zheng, Balakrishnan, Lei, Kim, Song, Kim, Kim, Özyilmaz, Ahn, Hong and Iijima22
From 300 nm to 2500 nm the absorption of monolayer graphene is constant, showing a peak at ≈250 nm because of the electronic transition of the inter band from the unoccupied π* states (Fig. 7).Reference Kravets, Grigorenko, Nair, Blake, Anissimova, Novoselov and Geim125 Graphene's optical transition is tunable by changing the Fermi energy, this adjustability provides the possibility for the use in IR detectors, modulators and emitters.Reference Wang, Zhang, Tian, Girit, Zettl, Crommie and Shen122
Combination of electronic transport properties and optical properties aroused a lot of interest because of the possibility of using large area monolayer and few layer graphene as ultrafast photodetectors.Reference Xia, Mueller, Golizadeh-Mojarad, Freitage, Lin, Tsang, Perebeinos and Avouris126,Reference Rana, George, Strait, Dawlaty, Shivaraman, Chandrashekhar and Spencer127
Photoluminescence (PL) is yet another optical property of graphene, by inducing a suitable band gap. This can be accomplished by two purposed methods: cutting graphene in nanoribbons and quantum dots, or using a physical or chemical treatment with different gases to reduce the conductivity of the π electron network.Reference Park and Ruoff128–Reference Bonaccorso, Sun, Hasan and Ferrari130 Several examples can be found in the literature,Reference Luo, Vora, Mele, Johnson and Kikkawa102,Reference Rothberg and Lovinger103,Reference Gokus, Nair, Bonetti, Bohmler, Lombardo, Novoselov, Geim, Ferrari and Hartschuh131,Reference Sheats, Antoniadis, Hueschen, Leonard, Miller, Moon, Roitman and Stocking132 opening new avenues for various applications from touchscreens to optical emitters (Fig. 8).
(a) Optical photo of the twisted structure; (b) and (c) SEM images of the same structure; (d) sectional view. Reproduced with permission from Ref. Reference Fan, Chu, Wang, Zhang, Chen, Tang and Zou144.
D. Mechanical properties
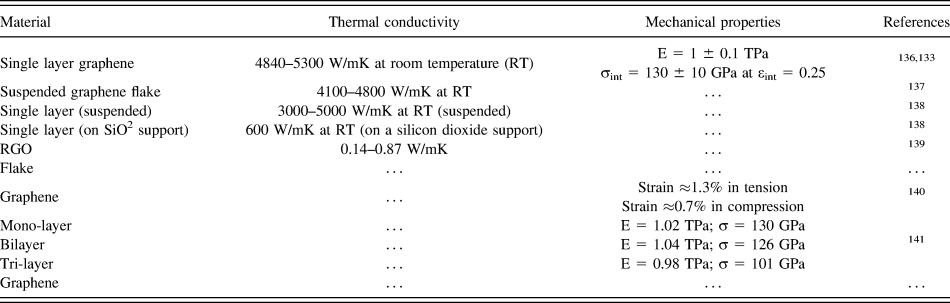
Following CNTs, graphene has been stated to have the highest elastic modulus and strength. This is an important factor since any outside stress on a crystalline material has the ability to alter interatomic distances, modifying electron transport. Table III summarizes the mechanical properties of single, bilayer, and multilayer of graphene.Reference Singh, Joung, Zhai, Das, Khondaker and Seal33
Thermal and mechanical properties of graphene.
E. Thermal properties
In electronic devices a considerable amount of heat needs to be dissipated, during the device operation period. Graphene, like any other carbon allotrope, shows a high thermal conductivity. The maximum room temperature thermal conductivity of 5000W/mK was obtained for pure defect free graphene.Reference Balandin, Ghosh, Bao, Calizo, Teweldebrhan, Miao and Lau133Table III also shows the comparison of the thermal conductivity for graphene obtained by several methods. Thermal conductivity is stated to change by the influence of two specific factors: defects edge scatteringReference Nika, Pokatilov, Askerov and Balandin134 and isotopic doping.Reference Jiang, Lan, Wang and Li135
V. GRAPHENE AND METAL-BASED FLEXIBLE FIBER SHAPED SCs (FFSCs)
This newly developed type of SCs has the advantage of being highly flexible and fibrous, being able to be woven into fabrics. To obtain FFSCs two main courses have to be followed: (i) external light needs to be directed to the active layer and (ii) light form the optical fiber end needs to be conducted into the internal of the SCs. The application of these procedures has opened new paths towards flexible and fibrous SC. The most important advance is that by built-in PV devices by weaving would make it possible to fabricate SC into clothing, tents, external bond layer of buildings, and so forth.Reference Zou, Wang, Chu, Lv and Fan1
There are two main types of FFSCs, OPV, and DSSC. Organic ones can be with a conductive oxide as anode or a metal wire. There are some issues in fabrication of OPV, as the coating layer is very thin; if the evenness of the layer is not perfect, it can originate short-circuit in the system. Also the performance is restricted by the n-type counter electrode selected.
Shtein and co-workersReference O'Connor, Pipe and Shtein142 used semitransparent metal layer as the cathode, fabricating the fiber cell coating MG/MG:Au/Au/CuPc/C60/Alq3/MG:Ag/Ag by high vacuum deposition on polyamide silicon wire with a diameter of 0.48 mm. This was accomplished by depositing similar layers around a fiber substrate, in a OPV device consisting of organic thin films sandwiched between two electrodes, one of them being transparent. The maximum power conversion efficiency reached was 0.50%. This device also has several drawbacks, namely the complex manufacturing process and difficult to control the outer layer metal electrode's balance between transmittance and conductivity.
Gaudiana and co-workersReference Lee, Eckert, Forberich, Dennler, Brabec and Gaudiana143 have greatly improved the FFSCs performance by twisting the structure, using stainless steel wire coated with P3HT/PCBM as the main electrode, wrapping another wire coated with a silver film as a counter electrode. This structure is encased in a transparent polymer cladding, so that the incident light could be focused onto the PV layer. This lead to a V oc = 0.6 V, a I sc = 11.9 mA/cm2, and an efficiency of 3.27%.
There are few reports on FFSCs and only a few works have been reported for DSSC, mainly because of the complexity of the process, achieving an excellent combination of conductivity and transparency of the structure. Zou and co-workersReference Fan, Chu, Wang, Zhang, Chen, Tang and Zou144 achieved a V oc = 610 mV, a I sc = 1.2 mA/cm2 with a FF of 0.38 using a weaveable wire-shaped flexible DSSC. This cell was a simple helical twisting structure made with TiO2 thin film using stainless steel wire as substrate, as one can see in Fig. 8. The counter electrode was a Pt wire coated with a protective polymer layer to prevent local stress between electrodes due to the twisting process. Titanium is yet another metal wire widely used. Liu and co-workersReference Wang, Liu, Huang, Zhong, Shen, Wang and Yang145 used it as photoanode and as counter electrode, reaching an efficiency of 5.6%.
Fiber-shaped electronic devices are good candidate to replace traditional planar-structure based devices, with the possibility of being woven into fabrics as stated above. FSSCs have gathered great interest, in comparison with flat SC it has the advantage of small resistance, flexibility, reduced dependence on angle of incident light and interlacing capability. FSSC has to overcome a number of obstacles to become a usable solution: the final product has to be long enough and fiber-shaped to guarantee the fiber flexibility; the functional film has to have sufficient mechanical strength to be able to survive the weaving process.Reference Lv, Yu, Wu, Shang, Wang, Hou, Fu, Wu and Zou10
Compared with conventional SC from rigid plates or flexible fibers, nanotube fiber SCs also exhibit some singular benefits such as: excellent electrical and mechanical properties, flexibility, lightweight, and wearable. Tao Chen and co-workersReference Chen, Wang, Yang, Feng, Sun, Li, Wang and Peng146 reported good results: J s = 10.3 mA/cm2, V oc = 0.47 V, FF = 0.45, and η = 2.2%.
A set of GFs with extraordinary flexibility, mechanical strength, and electrical conductivity was reported by Huhu Cheng and co-workersReference Cheng, Hu, Zhao and Qu8 resulting in a maximum η = 8.45%. These PV wires can easily be integrated into clothes, packages, and also portable devices to serve as energy generator to charge a drained battery.
These GFs were obtained by wet-spinning with a relatively low tensile modulus due to the alignment of GO layers along the fiber. This problem was later solved by Tour and co-workers,Reference Xiang, Young, Wang, Yan, Hwang, Cerioti, Lin, Kono, Pasquali and Tour147 using larger flake GO (22 µm average diameter). Using the appropriated selection of the coagulation solvent, the fibers exhibited high flexibility with unconventional knot efficiency.
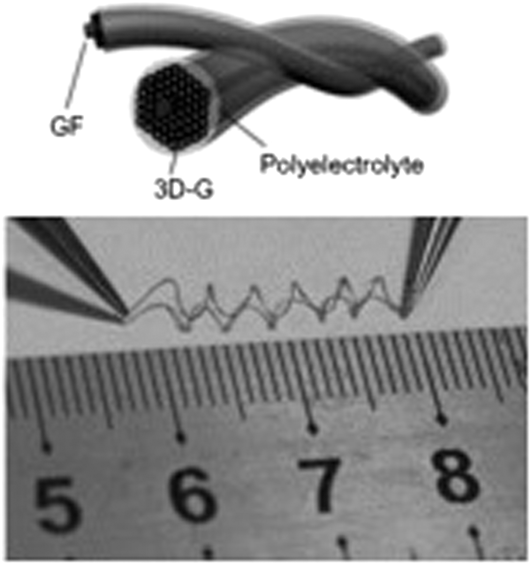
In a different reported work, Shi and co-workersReference Cai, Peng, Yu, Fu and Zou148 prepared a flexible fiber-shaped, solid electrochemical capacitor, with a performance controllable by altering the conditions of the electrodeposition. Meng and co-workersReference Meng, Zhao, Hu, Cheng, Hu, Zhang, Shi and Qu149 also testified and tested all-GFs for flexible and stretchable SCs (Fig. 9) highly compressible, and so with the ability of being integrated into textile material without any loss in performance.
FSC obtained from two twined GF and 3D-Gs. Reproduced with permission Ref. Reference Wang, Liu, Huang, Zhong, Shen, Wang and Yang145.
Many challenges still remain, the mechanical strength, and electric conductivity needs to be improved, even the highest recorded strength is inferior to the most common metal wires. To be comparable to high quality carbon fibers, the mechanical properties need to be improved. GFs are mainly achieved from GO nanosheets, with uncertain sizes, defect and shapes also strongly influence GFs properties. This has to be corrected to achieve high performance GFs, with the existence of a more efficient control over the assembly process as well as new forms of GFs production.Reference Cheng, Hu, Zhao and Qu8
VI. CONCLUSIONS
Weather the flexible planar SCs from nanocarbon materials as CNTs, graphenes, and derivatives are deposited on plastics, papers, or on fabrics/textiles, very good results have been obtained, namely: high capacitances and excellent rate capability. Regarding FSCs based on metal wires, CNT fibers, and GFs, a satisfactory electrochemical performance has been achieved. The unique structure and weavable capability has generated a boost in the research and progress of wearable electronics and integrated fiber power devices such as SC.
This FFSC devices still have a long way to go before they can be comparable with traditional devices in terms of efficiency, also the preparation process and complex integration also needs to be addressed. Nonetheless, with in-depth study and intensive research it is possible to believe that FFSCs can become a credible alternative to traditional planar shaped SCs and that the successful integration in electronic applications can bring huge benefits in the future of renewable energy technology.