I. INTRODUCTION
Different materials have been considered as potential thermoelectrics (TE). Their spectrum ranges from compounds with complex structures like Chevrel phases, Zintl phases, cage compounds (clathrates, skutterudites), or Heusler phases to nanostructured variants of such materials.Reference Paschen, Godart, Grin, Dubois and Belin-Ferré1 Variation of chemical composition or mechanical properties of the known TE materials is considered as a way to enhance the thermoelectric figure of merit (ZT). But beyond this task, from the chemical point of view, the search for new materials, in which the understanding of the relation between crystal structure, chemical bonding, and TE property may present better ways to enhance the TE properties, is still an open field to be explored.
Such a new system is represented by Ru1-yIn3 and related compounds TME 3, where TM is a transition metal from group 8 or 9 and E is a metal of group 13, respectively. The TME 3 compounds are characterized by strong d (TM)–p (E) hybridizations of the orbitals, which induce a characteristic distribution of bands in the electronic density of states (DOS). These phases differ in their valence electron concentration (VEC): 17-electron compounds are semiconductors and 18-electron compounds are metals.Reference Häussermann, Boström, Viklund, Rapp and Björnängen2 The binary compound RuIn3 was first reported by Schubert et al.Reference Schubert, Lukas, Meissner and Bhan3 and was later confirmed by Holleck et al.Reference Holleck, Nowotny and Benesovsky4 For RuIn3 (VEC = 17), semiconducting behavior was recently reported by Bogdanov et al.Reference Bogdanov, Winzer, Nekrasov and Pruschke5 and Imai and Watanabe,Reference Imai and Watanabe6 with calculated band gaps of 0.30 and 0.31 eV. Additionally, ruthenium and indium represent the heaviest known low-toxic combination of elements to compose a 17-electron configuration. In this sense, we have focused our objectives to investigate the potential of Ru1-yIn3 and its substitution variants RuIn3-xA x (A = Sn, Zn) as new TE materials. Considering the appropriate band structure, which presents a high gradient of DOS close to the Fermi level, a relatively high thermopower may be expected. Normally, the best compromise for a large power factor to attain high ZT values is found for heavily doped semiconductors, with a charge carrier concentration in the order of 1019 cm–3.Reference Bhandari, Rowe and Rowe7 A further optimization of the narrow band gap semiconductors can be achieved by chemical substitution. Such an approach considering the relation between chemical composition and TE properties was successfully applied, in particular, in our investigations on intermetallic clathrates Ba8Ge43□3,Reference Aydemir, Candolfi, Borrmann, Baitinger, Ormeci, Carrillo-Cabrera, Chubilleau, Lenoir, Dauscher, Oeschler, Steglich and Grin8 Ba8Ni3.5Ge42.1□0.4,Reference Nguyen, Aydemir, Baitinger, Bauer, Borrmann, Burkhardt, Custers, Haghighirad, Höfler, Luther, Ritter, Assmus, Grin and Paschen9 and Ba8Au5.3Ge40.7.Reference Zhang, Borrmann, Oeschler, Candolfi, Schnelle, Schmidt, Burkhardt, Baitinger, Zhao and Grin10
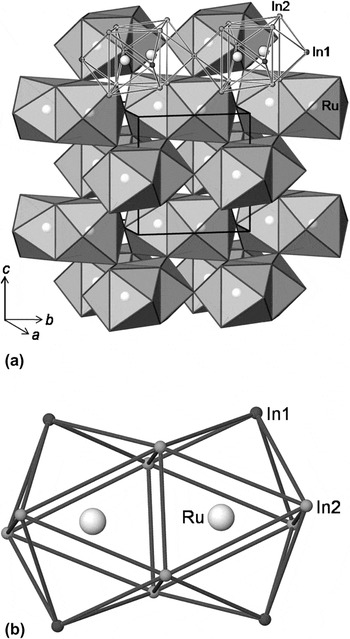
The crystal structure of RuIn3 was investigated by Pöttgen,Reference Pöttgen11 who showed the higher symmetry (space group P42/mnm, No. 136), in contrary to previously published P  n2.Reference Roof, Fisk and Smith12 In the literature, the crystal structure of RuIn3 (structure type IrIn3Reference Pöttgen, Hoffmann and Kotzyba13) is usually described as a layered one consisting of corrugated In nets with embedded Ru and In atoms in between.Reference Pöttgen11, Reference Pöttgen, Hoffmann and Kotzyba13 Despite the tetragonal structure, the isostructural compound FeGa3 shows no anisotropy in the transport properties.Reference Hadano, Narazu, Avila, Onimaru and Takabatake14 Therefore, the crystal structure of RuIn3 should be described more appropriately as a three-dimensional (3-D) packing of polyhedra [Fig. 1(a)]. The main building unit is a trigonal prism, composed of In atoms centered by Ru, where two additional In atoms cap two square faces. Two of these bicapped trigonal prisms are condensed via common face, whereby each Ru is simultaneously centering a prism and capping the adjacent one. In the unit cell, these building units are interlinked sharing In2 corners in the [001] direction and via common In1 atoms in the (001) plane, forming a 3-D network [Fig. 1(a)]. With respect to the TE properties, this complex 3-D organized crystal structure, composed of heavy elements, may contribute to a generally low thermal conductivity.Reference Mahan15
Polyhedral representation of the (a) crystal structure of RuIn3 and (b) its building unit—face-condensed bicapped trigonal prisms [Ru2(In1)2(In2)4].

For the TME 3 compounds, only few studies on TE properties have been carried out, mainly focused on FeGa3Reference Hadano, Narazu, Avila, Onimaru and Takabatake14, Reference Lue, Lai and Kuo16 and its gallium-containing analogues.Reference Amagai, Yamamoto, Iida and Takanashi17 Until now, for RuIn3, only heat capacity and electrical resistivity data at low temperature measured on single crystals are available in the literature.Reference Bogdanov, Winzer, Nekrasov and Pruschke5 Contrariwise, other narrow band gap phases with chemical equivalent constituting elements such as RuAl2 and RuGa2 are yet state-of-the-art TE materials.Reference Mandrus, Keppens, Sales and Sarrao18, Reference Takagiwa, Matsubayashi, Suzumura, Okada and Kimura19 Therefore, we focus our investigation on the synthesis of single-phase polycrystalline RuIn3 and its defect or substitution derivatives to study the transport properties and investigate the influence of defects and substitution on the TE properties.
II. EXPERIMENTAL PROCEDURE
A. Synthesis
Polycrystalline powders with nominal compositions of Ru1-yIn3 (samples Ru0.15In0.85, Ru0.25In0.75–1, and Ru0.35In0.65), RuIn3-xSnx (x = 0.01, 0.025, 0.05, 0.10), and RuIn3-xZnx (x = 0.01, 0.025, 0.05, 0.10) were synthesized from the elements Ru (99.9%) (ChemPur, Karlsruhe, Germany), In (99.999%, ChemPur), Sn (99.999%, ChemPur), and Zn (99.9999%) (Alfa Aesar, Ward Hill, MA) by a liquid–solid reaction. Before use, ∼100 mg of all starting materials were weighed into tin capsules and analyzed for oxygen impurity via carrier gas hot extraction technique with helium in a TCH600 N/O/H analyzer (LECO, St. Joseph, MI). For In, Sn, and Zn, no oxygen was detectable within the limit of detection of 0.025 mass%, whereas Ru contained 0.54(1) mass% of oxygen. For the preparation of stoichiometric RuIn3 (sample Ru0.25In0.75–2), commercial Ru (99.9%, ChemPur) was previously purified in a hydrogen gas flow at 873 K for 6 h, resulting in a final oxygen content of 0.06(1) mass%. The mixtures were weighed into alumina crucibles in an Ar-filled glove box (H2O and O2 content, ≤1 ppm) and sealed in evacuated quartz ampoules, which were kept at 973 K for 16 h. After preparation, the sample Ru0.15In0.85 was treated with HCl solution to remove the excess indium.
Thermal analysis was performed for different Ru:In ratios (1:3, 1:1, 3:1) in commercial devices (Netzsch STA 449C and Netzsch STA 409 C/CD, Selb, Germany). The densification of the fine-powdered samples was achieved by the spark plasma sintering (SPS) technique at 973 K for 1 h by applying a uniaxial pressure of 90 MPa and using graphite dies. The density of the pellets, determined by the Archimedean method, reaches 98% of the theoretical value.
B. Characterization
X-ray powder diffraction data of as-cast and annealed samples were collected on an Image Plate Guinier Camera Huber G670 [Cu Kα1 radiation, λ = 1.54056 Å, 3° ≤ 2θ ≤ 100°, LaB6 as internal standard, a = 4.1569(1) Å]. Reflection positions and lattice parameters were refined using the WinCSD package.Reference Akselrud, Zavalii, Grin, Pecharski, Baumgartner and Wölfel20 For metallographic investigations, pieces were cut from the SPS-compacted pellets and embedded in conductive resin (PolyFast, Struers, Ballerup, Denmark). Plain cross sections were obtained by a conventional multistep grinding and polishing using micron-sized diamond powders (6, 3, 0.25 μm). Specimen areas of minimal 8 mm2 were analyzed by a Cameca SX 100 wavelength dispersive X-ray (WDX) spectrometer using the elemental metals as standards.
C. Physical properties
The electrical resistivity and the Seebeck coefficient were measured simultaneously in the temperature range from 300 to 800 K in a ZEM-3 equipment (ULVAC-Riko, Nagasaki, Japan) with a standard direct current four-point method. The Hall effect was investigated by a standard four-point method. Thermal diffusivity measurements were carried out with the laser flash technique (LFA 427, Netzsch) in the temperature range from 300 to 773 K. Heat capacity measurements were performed by differential scanning calorimetry (DSC 8500, Netzsch). The thermal conductivity was derived from the relation κ = αρC p, where α is the thermal diffusivity, ρ is the density, and C p is the heat capacity.
D. Computational details
Scalar relativistic density functional (DFT) electronic structure calculations were performed using the full-potential FPLO code (version fplo9.01-33).Reference Koepernik and Eschrig21 For the exchange-correlation potential, within the local density approximation and the generalized gradient approximation, the parametrizations of Perdew–WangReference Perdew and Wang22 and Perdew–Burke–ErnzerhofReference Perdew, Burke and Ernzerhof23 were chosen, respectively. Both approximations yield essentially identical results for the calculated electronic properties using the experimental crystal structure. The calculations were carried out on a well-converged mesh of 13824 k-points (24 × 24 × 24 mesh, 1183 points in the irreducible wedge of the Brillouin zone). The partial In substitution with Sn or Zn was modeled within the virtual crystal approximation (VCA). With this possibility to describe disorder in a crystal, the average number of valence electrons and protons of atoms of the examined site is adjusted by substitution of a virtual atom with a determined valence electron and proton count.Reference Marzari, de Gironcoli and Baroni24
III. RESULTS AND DISCUSSION
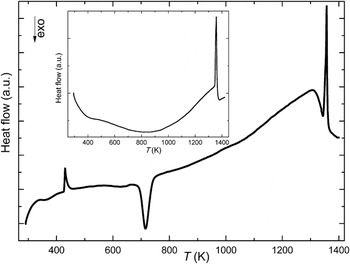
To find the optimal preparation temperature, differential thermal analysis (DTA) measurements on reaction mixtures with Ru:In ratios of 3:1, 1:1, and 1:3 were performed. The obtained DTA signal for the element mixture in stoichiometric ratio as a function of temperature is depicted in Fig. 2. The first endothermic peak at 430(5) K corresponds to the melting point of indium (430 K). Afterward, the liquid indium reacts in an exothermic reaction with solid ruthenium at 695(5) K. The exothermic effect at 1300(10) K reflects most likely some reactions of oxygen-containing impurities. And finally, RuIn3 decomposes presumably congruently near 1350(10) K. A more accurate DTA measurement of the single-phase RuIn3 confirmed the decomposition temperature. On the basis of the obtained information, 973 K was selected as the preparation temperature.
Differential thermal analysis (DTA) of a reaction of Ru and In (molar ratio 1:3) showing two endothermic signals, corresponding to the melting point of In [430(5) K] and decomposition of RuIn3 (1350(10) K). The exothermic signal [695(5) K] reflects the reaction between liquid In and solid Ru. The inset shows the DTA data of Ru1-yIn3 (sample Ru0.25In0.75–1).

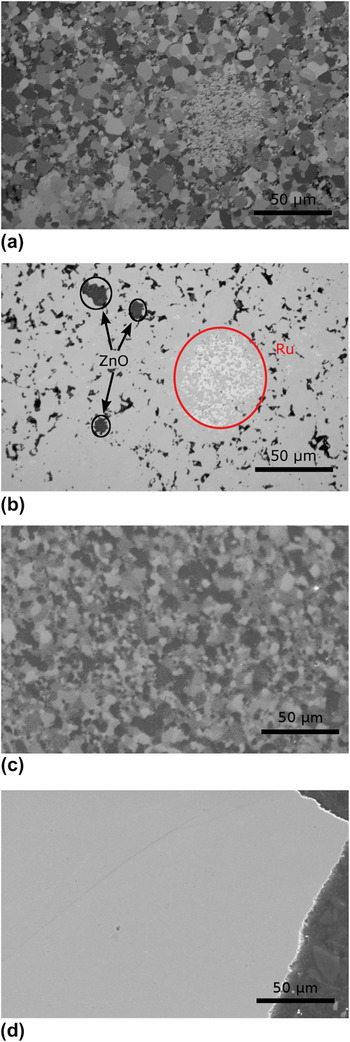
According to the metallographic investigation, small amounts of ZnO and nonreacted elemental Ru were observed in the samples RuIn3-xZnx [Figs. 3(a) and 3(b)]. Zinc oxide is formed by reduction of oxygen-containing impurities in elemental ruthenium by zinc. This observation is confirmed by the X-ray powder diffraction patterns, which clearly show reflections of ZnO. The microstructures of the Ru1-yIn3 [Figs. 3(c) and 3(d)] and RuIn3-xSnx samples do not show large grains of In2O3 or SnO2 (SnO). Because the indium oxide is more stable than the tin oxides, in the samples Ru1-yIn3 and RuIn3-xSnx, indium but not tin should reduce oxide impurities. The resulting In2O3 forms very small grains or is weakly crystallized (partially amorphous). Thus, it was not detected in the microstructure [Figs. 3(c) and 3(d)] and was visualized only in the powder diffraction patterns, showing very wide and weak reflections of the cubic modification of In2O3. The very small amounts of oxide impurities do not allow to detect their influence on the TE properties.
Microstructure of RuIn2.9Zn0.1: (a) polarized light and (b) secondary electron image, where only the marked regions correspond to ZnO. Microstructure of Ru1-yIn3 (sample Ru0.25In0.75–1): (c) polarized light and (d) secondary electron image.

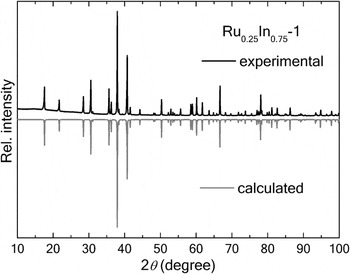
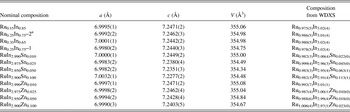
The X-ray diffraction patterns of the Ru1-yIn3 samples were indexed with the tetragonal unit cell of the FeGa3-crystal structure type (Fig. 4). The refined lattice parameters (Table I) are in good agreement with the literature data.Reference Schubert, Lukas, Meissner and Bhan3, Reference Holleck, Nowotny and Benesovsky4, Reference Pöttgen11, Reference Roof, Fisk and Smith12 Although the lattice parameter a practically does not change, the value of c differs being larger in the In-rich samples and smaller in the In-poor ones, except Ru0.15In0.85, which is probably caused by HCl treatment (see above). This indicates the existence of a homogeneity range Ru1-yIn3 caused most probably by the defect occupation of the Ru site. The variation of y should result in a change of the charge carrier concentration (see electronic DOS, below) and electronic transport behavior (Figs. 7 and 8).
X-ray powder diffraction pattern of Ru1-yIn3 (top) compared with the calculated powder pattern (bottom, space group P42/mnm, Cu Kα1 radiation).

Lattice parameters of Ru1-yIn3, RuIn3-xSnx, and RuIn3-xZnx compounds.

a Sample prepared with high-purity ruthenium (see “Synthesis”).
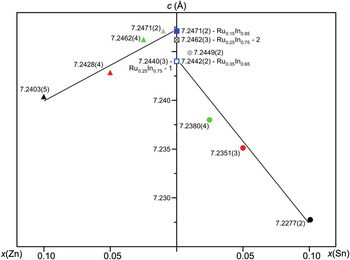
In both cases, substitution of In by Zn or Sn leads to a reduction of the lattice parameter c, keeping a unchanged (Fig. 5; Table I). This behavior may be explained by the preferential occupation of the In1 position with Sn or Zn at small substitution ratios. Only the In1 position has smaller distances in c direction than in the a or b directions, leading to a more sensitive behavior for the lattice parameter c at low substitution concentrations. This was already experimentally confirmed for IrIn3-xMgx, where IrIn3 is isotypic with RuIn3.Reference Hlukhyy, Hoffmann and Pöttgen25
Lattice parameter c as a function of the concentration for RuIn3-xSnx, RuIn3-xZnx, and Ru1-yIn3.

Extrapolating the lattice parameter c of RuIn3-xZnx to x = 0 gives a value, which is in agreement with the c value of the In-rich side of the homogeneity range Ru1-yIn3. The same operation for RuIn3-xSnx yields a c value of the In-poor side of the homogeneity range (Fig. 5; Table I). This difference can be understood considering the reducing activity of Zn, In, and Sn. In the RuIn3-xSnx system, indium is the main reducing agent. Thus, a part of indium of the starting mixture is used for the utilization of oxygen. In the case of RuIn3-xZnx system, zinc is the main reducing agent and a part of it is present in the form of ZnO in the products, where indium is completely going into the main phase. This leads to a larger lattice parameter c and the lower Zn concentration in the main phase (see WDXS results in Table I).
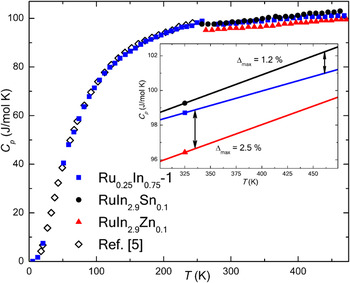
The heat capacity of RuIn3 and its substitution variants RuIn2.9Sn0.1 and RuIn2.9Zn0.1 with the highest amounts of the third component is shown in Fig. 6. The values for the binary compound agree well with the single crystal data of Bogdanov et al.Reference Bogdanov, Winzer, Nekrasov and Pruschke5 and confirm the high purity of our polycrystalline material. At low temperatures, the charge carriers have a negligible contribution to the specific heat of RuIn3,Reference Bogdanov, Winzer, Nekrasov and Pruschke5 being in good agreement with the semiconducting state and the low charge carrier concentration of 6.25 × 1016 cm–3 (n-type) derived from Hall effect measurements. The extension to higher temperature reveals a linear increase above room temperature with values slightly above the Dulong–Petit value. Analysis of the high-temperature part of the data (Fig. 6, inset) reveals small differences between the binary compound and its substitution variants with the highest amount of the third component (x = 0.10). The maximal variations for RuIn2.9Sn0.1 and RuIn2.9Zn0.1 are 1.2 and 2.5%, respectively, being thus within the usually estimated error limit of the method of ∼5%. Therefore, the heat capacity of the binary compound is used for later calculations of the thermal conductivity for substitution variants with x = 0.01, 0.025, and 0.05.
Temperature dependence of the heat capacity of Ru1-yIn3 (sample Ru0.25In0.75–1), RuIn2.9Sn0.1, and RuIn2.9Zn0.1 with the low temperature data of Bogdanov et al.Reference Bogdanov, Winzer, Nekrasov and Pruschke5 measured on a single crystal for comparison. The inset shows a linear fit in the high-temperature part with the largest differences between the binary compound and its substitution variants.

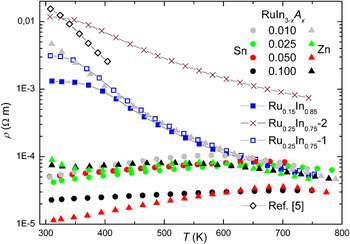
The temperature dependence of the electrical resistivity is plotted in Fig. 7. The binary Ru1-yIn3 samples show a semiconducting behavior, like that observed for FeGa3 single crystals.Reference Hadano, Narazu, Avila, Onimaru and Takabatake14 After a short plateau, the resistivity decreases significantly above 350 K by more than one order of magnitude. An experimental band gap of 0.45 eV was derived from the plot ln ρ versus T –1 and is in good agreement with the experimental values between 0.4 and 0.5 eV for the RuIn3 single crystal, depending on the crystallographic direction.Reference Bogdanov, Winzer, Nekrasov and Pruschke5 In accordance with the electronic DOS (Fig. 9), the variation of y leads to the reduction of the electrical resistivity. Metallic behavior of RuIn3 was reported in Ref. Reference Pöttgen11. This might be due to In impurities on the sample surface. In contrary to semiconducting properties of binary Ru1-yIn3, all substitution variants show metal-like behavior, indicated by a constantly increasing resistivity with increasing temperatures over a wide temperature range. At certain temperatures, all RuIn3-xSnx and RuIn3-xZnx compounds show a local maximum of resistivity implying activated behavior of a heavily doped semiconductor, which depends on the doping level, but not on the doping species. Furthermore, a higher substitution concentration leads to a lower electrical resistivity. The tin-substituted phases with x = 0.025 and 0.05 exhibit similar behavior. This corresponds to the similar tin concentration obtained from WDXS measurements. Additionally, no zinc is found in a sample with nominal composition RuIn2.99Zn0.01, which is confirmed by the resistivity measurement: resistivity values for the samples with x(Zn) = 0.01 and the binary sample Ru0.25In0.75–1 are practically equal in the whole temperature range (Fig. 7).
Temperature dependence of the electrical resistivity of Ru1-yIn3, RuIn3-xSnx, and RuIn3-xZnx. Single crystal data along [110] from Ref. Reference Bogdanov, Winzer, Nekrasov and Pruschke5 are included.

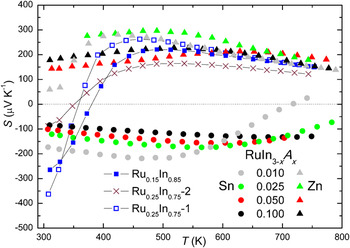
The most striking feature of RuIn3-xSnx and RuIn3-xZnx is the substitution-induced change from semiconductor- to metal-like behavior, which can also be observed in the thermopower (Fig. 8). The RuIn3 (sample Ru0.25In0.75–1) exhibits multiple band behavior with high negative [S(308K) = –363 μV/K] and positive [S(461K) = 262 μV/K] values implying electron (T < 360 K) and hole transport (T > 360 K). This behavior is suppressed by the chemical substitution, leading to either electron or hole transport in the substituted samples over the whole temperature range. Thus, the type of charge carriers can be tuned to n-type by tin and to p-type by zinc substitution. The reached values of the thermopower are relatively high: S max(464K) = –219 μV/K and S max(490K) = 296 μV/K for the samples with x(Sn) = 0.01 and x(Zn) = 0.025, respectively. Further substitution slightly reduces the thermopower values.
Seebeck coefficient for Ru1-yIn3, RuIn3-xSnx, and RuIn3-xZnx as a function of temperature.

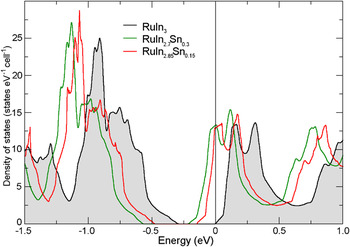
The calculated electronic DOS for the stoichiometric compound RuIn3 is very similar to previously published linear muffin-tin orbital (LMTO) results.Reference Bogdanov, Winzer, Nekrasov and Pruschke5 We find a total valence bandwidth of about 10 eV. The valence band is dominated by Ru 4d states, although in the region close to the Fermi level, Ru and the three In atoms provide similar contributions to the total DOS. This behavior is essentially unchanged upon Sn substitution. We obtain a band gap of about 0.3 eV, which is slightly smaller than the experimental observation of about 0.45 eV, in accordance with the well-known underestimation of band gaps by DFT calculations. To get deeper microscopic insight into the electronic structure of RuIn3-xSnx, we analyzed the DOS for a series of Sn concentrations applying VCA. As the main result, we found an almost rigid band–like behavior for small Sn concentrations, especially in the relevant region close to the Fermi level (Fig. 9). No significant charge redistribution between different bands is observed for Sn substitution up to 7.5 at.%. Additional charge carriers fill states in a DOS region with small gradients, thus reducing the thermopower. In the case of RuIn3-xZnx, the partial substitution of In with Zn removes electrons from the valence band and shifts the Fermi level into a valence band region with a smaller gradient of the DOS. Our calculations, resulting in an almost rigid-band behavior, are in qualitative agreement with the experimentally obtained thermopower values, which decrease upon a larger substitution of In by Sn or Zn. In contrary, rigid-band behavior is no longer observed for higher substitution concentrations in ordered variants of CoIn3-xZnx and CoGa3-xZnx (isostructural to RuIn3-xSnx and RuIn3-xZnx) with x ≥ 0.5.Reference Viklund, Lidin, Berastegui and Häussermann26
Calculated total electronic density of states for RuIn3 and the substitution derivatives RuIn3-xSnx (x = 0.15, 0.30) close to the Fermi level, which is indicated by the vertical line.

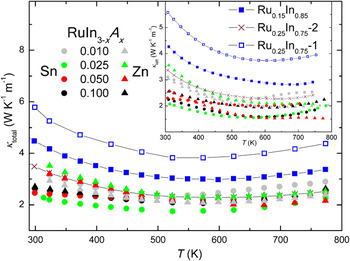
The thermal conductivity of RuIn3-xSnx and RuIn3-xZnx is only slightly dependent on the temperature, with a shallow minimum between 500 and 600 K (Fig. 10). In general, all substituted materials show a similar reduction of the thermal conductivity of nearly 50% of that of RuIn3. The small increase of the thermal conductivity of all materials at temperatures above 600 K arises from bipolar interactions of electrons and holes and the increasing electronic contribution κel, which can be derived from the Wiedemann–Franz law κel = LT/ρ, where L is the Lorenz number of 2.45× 10⁻⁸ WΩK−2. Because of the low values of κel, the thermal conductivity is mainly determined by the lattice contribution (inset Fig. 10).
Thermal conductivity of Ru1-yIn3, RuIn3-xSnx, and RuIn3-xZnx as a function of temperature. The inset data show only the lattice part of the thermal conductivity derived from the Wiedemann–Franz law.

Complementary, to separate the contributions from the intrinsic behavior of the bulk material and of the microstructure after SPS treatment to the physical properties, TE measurements on single crystals should be made, like we have done on Ba8Au5.3Ge40.7.Reference Zhang, Borrmann, Oeschler, Candolfi, Schnelle, Schmidt, Burkhardt, Baitinger, Zhao and Grin10
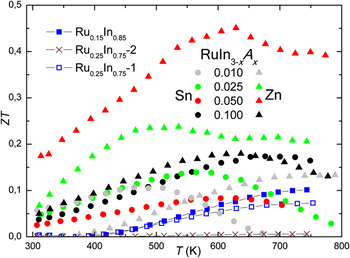
The dimensionless figure of merit for Ru1-yIn3 and its derivatives is plotted in Fig. 11 in dependence on the temperature. Although the binary Ru1-yIn3 exhibits a rather low ZT of 0.07 at 753 K, the substitution increases this value up to 0.17 at 676 K for the highest tin-substituted composition, RuIn2..90Sn0.10. Substituting Ru1-yIn3 with Zn is a more effective way to improve ZT, nearly triplicating the attained values for Sn and reaching ZT = 0.45 at 629 K for RuIn2.95Zn0.05. Considering already known ZT values for FeGa3 with 0.04 at 973 KReference Hadano, Narazu, Avila, Onimaru and Takabatake14 and for RuGa3 with 0.18 at 940 K,Reference Amagai, Yamamoto, Iida and Takanashi17 a significant improvement of the TE properties in the class of TME 3 compounds has been achieved.
Temperature dependence of the dimensionless figure of merit ZT for Ru1-yIn3, RuIn3-xSnx, and RuIn3-xZnx.

IV. CONCLUSIONS
Polycrystalline materials RuIn3-xSnx, RuIn3-xZnx, and Ru1-yIn3 were synthesized by a liquid–solid reaction with subsequent SPS treatment. The appearance of very small amounts of In2O3 and ZnO is explained by the reduction of RuO2 present in initial Ru. The TE properties are investigated in the temperature range from 300 to 800 K. These compounds exhibit relatively high Seebeck coefficients, showing negative (Sn) or positive (Zn) values. Futhermore, the change from semiconductor- to metal-like behavior with increasing x is observed for the electrical resistivity, while reducing the thermal conductivity by doping down to 50% of the value of single-phase RuIn3. A significant improvement in tuning the ZT for TME 3 compounds is achieved, attaining ZT = 0.45 at 629 K for RuIn2.95Zn0.05. Further improvements to reduce the high lattice thermal conductivity are in progress.
ACKNOWLEDGMENTS
The authors thank Dr. U. Burkhardt, Mrs. M. Eckert, and Mrs. S. Kostmann for metallographic preparation and WDXS analysis; Dr. H. Borrmann, Mr. S. Hückmann, and Dr. Y. Prots for X-ray powder diffraction experiments; Dr. G. Auffermann, Mrs. U. Schmidt, Mr. S. Schwinger, and Mrs. A. Völzke for chemical analysis; and Dr. S. Hoffmann, Mr. P. Marasas, and Mrs. S. Scharsach for thermal analysis. For measurements of several physical properties, we also acknowledge the contribution of Mr. R. Koban (LFA) and Mrs. R. Hempel-Weber (ZEM-3). H. Rosner acknowledges SPP 1386 of the Deutsche Forschungsgemeinschaft for financial support.