

In most parts of the world, political representation remains unequal in terms of gender. Besides structural-institutional barriers on the supply side of politics, research has shown that obstacles to women's representation also exist on the demand side. Gender schemata and stereotypes about women's and men's characteristics and competences have been regarded as major factors behind the slow advancement of women in the public sphere (Valian Reference Valian1999). Empirical knowledge of gender stereotypes in politics comes principally from studies of the United States, where two parties compete, women's officeholding is uneven, and the scarce female candidates come predominantly from the Democratic Party (e.g., King and Matland Reference King and Matland2003; Sanbonmatsu Reference Sanbonmatsu2006). In this context, a voter favoring a female candidate but holding more conservative attitudes faces a trade-off between following either his/her partisan or his/her gender preferences. As Lawless (Reference Lawless2015, 357) explains for the U.S. case, “when voters navigate the current political environment—one in which both gender and partisanship may be relevant—candidate party, in most cases is likely to trump candidate sex as an evaluative criterion.”
However, to what extent do political gender stereotypes matter in contexts in which voters’ choices of candidates are not constrained by partisan cues, as in the United States, because there is a large supply of female candidates from all competing parties? Furthermore, to what extent do gender stereotypes matter for voters’ choices among candidates when proportional representation (PR) rules are used and more than two parties compete?
To date, these questions remain unanswered because European scholarship has largely neglected the nature and extent of this voter bias for or against candidates. On the one hand, the few noteworthy studies that examine the effect of gender stereotypes in European settings concern hypothetical choices (e.g., Aalberg and Jennsen Reference Aalberg and Jennsen2007; Kukołowicz Reference Kukołowicz2013; Matland Reference Matland1994), as opposed to the selection of candidates in real-life contests. On the other hand, prominent research that investigates the fate of “real” female candidates in European PR systems (e.g., McElroy and Marsh Reference McElroy and Marsh2010; Górecki and Kukołowicz Reference Górecki and Kukołowicz2014) does not specifically test the effect of gender stereotypes. This is because items inquiring about gender stereotypes are absent from national election studies across Europe. Hence, the endurance of stereotypes and their impact on vote choices in European multiparty settings remain largely unknown.
In pursuit of these questions, our study contributes to the literature in three important ways. First, we advance theory by exploring novel conditions under which stereotypes matter. We examine stereotypes in Finland, a case that differs greatly from previous investigations regarding the state of achieved gender equality, electoral rules, and party competition, as well as the relationship between gender and partisan cues. Competition between female and male candidates takes place within the party, as all parties’ lists contain candidates of both sexes. Hence, supporters of all parties can select one among many female and male candidates at no cost to their partisan preferences. At the same time, however, the Finnish electoral system offers voters a unique possibility to discriminate against female candidates given that they must always make a choice between the two genders. Hence, by conducting a harder test of the effect of stereotypes, our study examines whether the insights gained from the single U.S. case hold in a diametrically different case. Second, we inquire about the role that women's “dosage” (or women's numbers) in politics plays and show that developments in gender equality weaken but do not completely eliminate stereotypes. Third, we show that stereotypes’ impact may vary across different settings of candidate choice. Our results show that while stereotypes always work in the hypothesized direction, their impact is marginal when many viable female candidates compete.
GENDER SCHEMA THEORY AND POLITICAL GENDER STEREOTYPES
The role of perceptual and cognitive processes was first introduced in political science via Robert Axelrod's (Reference Axelrod1973) schema theory. According to this framework, people use schemata to make sense of the world (cf. Berger and Luckmann Reference Berger and Luckmann1966): when new information becomes available, people try to fit it into the pattern used in the past to interpret information about the same situation (Axelrod Reference Axelrod1973, 1248). Thus, when evaluating a person, for example, individuals use stereotypes as heuristics that help them decide whether that person possesses a specific attribute (Fiske and Neuberg Reference Fiske and Neuberg1990). For social psychologists, a “stereotype” is a set of beliefs about the personal attributes of a group of people (Ashmore and Del Boca Reference Ashmore, Del Boca and Hamilton1981). Stereotyping is the act of assigning to individuals characteristics or traits based on their membership in a group or category (e.g., Catholic, Republican, black, woman, etc.). This means that the variation within the group is disregarded, and all group members are assumed to have identical characteristics.
Gender schemata are preexisting, implicit, unconscious assumptions about differences between men and women that are rooted in historically socialized roles of men and women (Fox and Oxley Reference Fox and Oxley2003). Children learn how their society and/or culture understand the role of a man and that of a woman and internalize this knowledge as a gender schema, which they use to organize and process subsequent experiences (Bem Reference Bem1981, Reference Bem1993). Gender schemata affect our assumptions and expectations concerning men and women, our evaluations of their work, and their professional performance (Valian Reference Valian1999). In politics, gender stereotyping ascribes to male and female politicians certain characteristics in terms of character or competence because of their gender (Huddy and Terkildsen Reference Huddy and Terkildsen1993b). To illustrate, some characteristics or areas of expertise are considered related to the “male” or “masculine” category, whereas others are regarded as related to the “female” or “feminine” category. Pro-men and pro-women bias can stem from different types of political gender stereotypes, which we elaborate next.
First, research has established a systematic gender bias in trait attribution. Female candidates are typically perceived as warm, compassionate, caring, consensus building, passive, kind, and emotional (“maternal effect”); male candidates are viewed as logical, rational, assertive, decisive, strong, able to provide strong leadership, direct, knowledgeable, and ambitious (e.g., Huddy and Terkildsen Reference Huddy and Terkildsen1993b; Matland Reference Matland1994; Rosenwasser and Dean Reference Rosenwasser and Dean1989).
People hold gender-schema-based assumptions about individual candidates’ policy interests and/or expertise. In other words, gender stereotypes provide a means for linking women with some issue areas and men with others. As Kathleen Dolan (Reference Dolan2004) explains, this type of stereotyping is strongly related to trait stereotypes: on the one hand, women are perceived as more interested in or better able to act for issues related to “compassionate” topics (e.g., health, elderly, children, family, environment). Women are also perceived as more competent than men for dealing with women's issues, such as women's rights or gender equality (Huddy and Terkildsen Reference Huddy and Terkildsen1993b). On the other hand, men are perceived as more apt than women to deal with different types of issues, such as foreign affairs, security and defense, and economics (e.g., Alexander and Andersen Reference Alexander and Andersen1993; Koch Reference Koch2000; Matland Reference Matland1994).
Based on these (perceived) differences between women and men politicians, gender schema theory suggests that some voters are likely to have a preference for one gender over the other—what Sanbonmatsu (Reference Sanbonmatsu2002) calls “baseline gender preference”. This means that voters have underlying predilections regarding gender when voting (e.g., Rosenthal Reference Rosenthal1995; Sanbonmatsu Reference Sanbonmatsu2002), which results in some voters preferring to be represented by a man and others preferring to be represented by a woman. Representation theory suggests that when selecting a representative, voters are likely to consider which among competing candidates possesses the “desired” character traits and competences (Mansbridge Reference Mansbridge2009). This means that gender stereotypes about candidates’ traits, characteristics, beliefs and behaviors may impact voters’ choices between women and men candidates at the ballot box.
We know little about whether political gender stereotypes persist or fade over time, along with developments in gender equality or whether they matter in contexts of multiparty competition with a large supply of female candidates, in which gender and partisan cues are entirely disentangled and competition between female and male candidates takes place within the party (for intraparty competition in Finland, see Villodres Reference Villodres2003). We have reasons to believe that the size and kind of women's “dosage” in politics matter for the impact of stereotypes. Recent research (Giger et al. Reference Giger, Holli, Lefkofridi and Wass2014) shows that, besides a higher district magnitude (more seats open for competition), shares of female candidates within district and members of parliament (MPs) at the time of election matter for voters’ choice of female candidates. In other words, stereotyping may result in women being perceived as less qualified in settings in which female presence is low, and it may not matter in settings in which their presence is sizeable.
DO GENDER STEREOTYPES OUTLIVE EGALITARIAN PARADISES? THE ROLE OF WOMEN'S DOSAGE IN POLITICS
Studies in psychology that investigate the impact of gender ratios on stereotypes about whether science is “male” have shown that prolonged exposure to high-female environments weaken science-is-male stereotyping, while prolonged exposure to low-female environments strengthen it (e.g., Smyth and Nosek Reference Smyth and Nosek2015). If the ”dosage” of women indeed matters for stereotyping, we should observe the same in politics. To examine whether the strength of political gender stereotypes changes over time, we choose one of the most gender equal countries in the world: Finland. Finnish women were the second in the world to gain suffrage in 1906. Simultaneously, women were made eligible in legislative elections, with the first parliament elected in 1907 having 6% female MPs. Women's representation has increased steadily ever since, reaching more than 40% in the 2000s, notably, without any electoral gender quotas in place. The gender composition of the Finnish parliament is more balanced (42.5% women in 2011, 41.5% in 2015) than those in most other Western democraciesFootnote 1. Women were also recruited to government very early on: the first female minister was appointed in 1926. Between 1991 and 2015, there was gender parity (between 40% to 60% of each sex) in ministerial positions in the cabinet; in fact, from 2007 to 2011, women held 60% of cabinet posts. Unlike most other countries in the Western world, Finland has even had a female president, Tarja Halonen (2000–2012). We argue that a higher percentage of women in Finnish politics is likely to weaken the perception that politics is a man's world and that women are not fit for it. We thus hypothesize that political gender stereotypes in Finland are likely to have weakened over time (H 1).
We further argue that understanding “how voters who hold stereotypes end up evaluating and choosing (or failing to choose) women candidates” (Dolan Reference Dolan2014a, 4) requires an examination of stereotypes in a PR electoral system with multiparty competition in which all parties supply female candidates, so that voters can vote for a woman without having to vote for “the other side,” as in two-party systems (Giger et al. Reference Giger, Holli, Lefkofridi and Wass2014; see also McElroy and Marsh Reference McElroy and Marsh2010). This is a key difference from previous studies in which gender and partisan cues were intertwined: both experimental (e.g., Rosenthal Reference Rosenthal1995; Sanbonmatsu Reference Sanbonmatsu2002) and real-world studies of the United States (e.g., Brians Reference Brians2005; Dolan, Reference Dolan2004, Reference Dolan and Lynch2014) investigated situations in which a woman is pitted against a man. For some voters, this creates a conflict between partisan and gender preferences (e.g., Hayes Reference Hayes2011; Plutzer and Zipp Reference Plutzer and Zipp1996).
Though gender becomes less relevant in interparty competition when all parties supply large proportions of female candidates, this does not mean that it is irrelevant in intraparty competition. Among PR systems, the Finnish case constitutes an exceptionally fruitful environment in this regard because the Finnish electoral rules grant voters a lot of power to select among candidates on a list. Finland uses a “completely open” list proportional electoral system in which preferential voting is mandatory. Voters are required to choose only one among many alphabetically ordered candidates—a choice that includes a selection between male and female candidates of the same party. As they can directly favor specific candidates, voters have great potential to influence the representation of different sexes. Given that ideology varies little within Finnish parties (i.e., across candidates of the same party), this case provides us with much stricter conditions for the test of gender stereotypes. If gender stereotypes persist even in egalitarian settings, then they should also impact voters’ choices at the ballot box. We thus hypothesize that political gender stereotypes in Finland are likely to affect voters’ choices (H 2).
Given that we operate in a European multiparty environment, we need to discuss two concepts that are theoretically relevant to studying the effect of gender stereotypes. First, incumbency provides an advantage for candidates because it functions as an indicator of experience in politics and increases the likelihood of evaluating a candidate as “fit for the job.” In majoritarian systems with single-member districts, what matters is the incumbency of female/male candidates coming from two opposing parties. However, in PR systems with multimember districts, we can consider female incumbency in the entire constituency (district), taking into account all competing parties or female incumbency among elected members of a single party in the district.
Second, analogous to the differences observed between American Democrats and Republicans (Dolan Reference Dolan2014b), in Europe, we would expect differences between right-wing and left-wing voters. Right-wing ideology is generally associated with conservative views regarding women's role in society as well as programs that are less inclined to promote women's rights. Hence, various gender stereotypes (issue, beliefs, and/or traits) may provide right-wing voters with reasons to view women candidates in a particularly negative light (see also Sanbonmatsu Reference Sanbonmatsu2008). For instance, women may be evaluated as inferior candidates if they are perceived as less apt to deal with core right-wing policy concerns, such as security and defense.Footnote 2 A similar argument could be made for left-wing or socially liberal voters. Assuming that being leftist implies promoting women's issues and gender equality, based on stereotypes, left-wing voters should see women candidates more positively than men. To illustrate, women may be perceived as more suitable for dealing with social policy—a primary left-wing concern—or the fight against discrimination and promotion of gender equality. In the Scandinavian context, Matland's (Reference Matland1994) experimental study of Norway revealed that the effect of gender bias differs according to the respondent's political persuasion; also, female candidates were evaluated most harshly by conservative women, and especially among those with low interest in politics. Given this initial evidence, we must also consider ideological differences among voters when studying gender stereotypes.
CONTEXTS OF CHOICE: A NOTE ON HYPOTHETICAL AND REAL BALLOTS
To recall, stereotyping is a simplistic process of impression formation, whereby an individual utilizes categories (or stereotypes). This stands in contrast to the (slower and costlier) individuating or data-driven process, whereby individuals examine the “target” in detail to determine whether it indeed possesses the attribute. Along with her or his party label,Footnote 3 the candidate's gender can serve as an important low-information shortcut or heuristic that helps the individual form an opinion without engaging in costly and slow processing of information on policy stances or past performance of a candidate (Bianco Reference Bianco1998; Lau and Redlawsk Reference Lau and Redlawsk2001; Popkin Reference Popkin1991). Following this logic, we assume that voters’ capacity for gathering the necessary information in order to evaluate different candidates is determined by how much time they have at their disposal and how much more information is available to them. We also assume that voters’ willingness to invest time and gather information on the available candidates is related to whether the choice they make is consequential for policy making.
First, choices concern differences among available options. When asked to choose between equally qualified female and male candidates outside the context of a real political conflict, the most prominent difference between female and male candidates—and thus the most important information at hand and key discriminating factor between them—is their gender. In other words, it is easy for respondents to use gender as a criterion for judgment and thus employ gender stereotypes when evaluating and selecting between hypothetical candidates.
Second, choices are also about potential consequences. Hypothetical choices are by definition inconsequential. Even if voters possess the time and the will to look for additional information about the candidates, and even if information is made available to them, voters know a priori that the choice they make is inconsequential—that is, it has no implications for their life and the policies that will be pursued in their country. Thus, reliance on political gender stereotypes appears to be an attractive low-cost shortcut for opinion formation that leads to choice, and we would expect such stereotypes to matter for a decision between hypothetical candidates.
When called to select among real candidates, however, voters are faced with a different informational environment, and the choices they make may matter for policy making. There is much more information available, such as candidate incumbency or experience in politics. Here, gender is one among many criteria that individuals might employ to make a choice among politicians whom they have seen talking in the media or at local events. Contrary to the hypothetical setting, in real elections, campaigns last at least a couple of weeks and voters have more time to gather important information on specific candidates. Crucially, the choice that voters make in real electoral settings has political relevance due to its consequences for the direction of policy. Hence, voters should be more inclined to gather information and engage in an information-driven process of candidate evaluation than rely on political gender stereotypes only.
In sum, while the (stereotype-driven) predisposition to select a female or male candidate may be powerful in explaining a choice between hypothetical candidates, it may fade when making a “real” selection at the ballot box.Footnote 4 We thus test the influence of gender stereotypes in two different contexts. We specifically hypothesize that the effect of political gender stereotypes is likely to vary across contexts of choice: the effect will be different in hypothetical compared to real choices (H 3).
METHODOLOGY
Data Sources
We use primary data generated through three representative surveys. To test H 1, we use data from the Finnish Gender Barometer that was fielded in 1998, 2001, and 2012. We support this evidence with recent data from two more surveys: one that we fielded during the 2012 presidential election in Finland and the Finnish National Election Study (FNES) that was conducted after the 2011 legislative election.Footnote 5 We rely on these two surveys to test H 2 and H 3. In what follows, we discuss our data sources in more detail.
First, the Gender Barometer comprehends a nationwide sample; it has been fielded every three years since 1998 with the purpose of documenting the development of gender equality in Finland. In three years (1998, 2001, and 2012), it included questions about the competence areas of politicians. To examine H 1 about whether political gender stereotypes weaken over time, we analyze responses regarding female and male politicians’ competences in two policy areas: economy and social policy. Besides enabling us to trace the evolution of Finnish public opinion on politicians’ policy competences over time, these two items are also included in the two other surveys we use; this allows us to compare information generated by different surveys.
Second, to test H 2 and H 3 we use two surveys that were specifically designed for the purpose of the present study. On the one hand, we fielded an original surveyFootnote 6 during the January 2012 election of the Finnish president—whose portfolio entails policies typically considered “masculine”.Footnote 7 This is the first mass survey in Europe to include both issue and trait stereotype questions while combining them with a measure on the hypothetical preference for a female or male candidate (if two equally qualified candidates would run, would you prefer a man or a woman?). This question is hypothetical because, first, the question is formulated in abstract terms (i.e., no names are mentioned) and, second, in reality there were two female candidates from small parties who did not make it to the second round (unviable female candidacy). In this way, we test stereotypes in a context that resembles the hypothetical setting of experimental research because it entails an imaginary choice for the presidential office but is different from a pure experimental setting in that there is a real election happening in parallel, in which the outgoing president is a woman (Halonen). Respondents were asked to choose between two equally qualified candidates, a female or a male candidate. This constitutes our first dependent variable (preference for female candidate in hypothetical setting), which is coded so that 1 means preferring a female candidate while 0 means preferring a male one.
We also use the 2011 FNES that included a module of questions, which we designed carefully to ensure comparability with existing U.S. research. While the number of stereotype questions is smaller than the one in the survey we discussed earlier, it carries the advantage that it enables us to link stereotyped views to actual vote decisions in an election with a multitude of female candidates on all party lists.Footnote 8
The latter survey concerns the legislative election and a real choice between candidates, whereas the survey mentioned above concerned a presidential election and a hypothetical choice among candidates. We will call them “legislative” and “presidential” surveys, respectively. Given that the legislative and the presidential surveys were conducted less than a year apart from each other, we expect the pattern of gender stereotypes not to have changed; hence, we can directly compare their consequences between different surveys, which refer to different contexts of choice: a real and a hypothetical one (H 3).
The structure of choice in Finnish legislative elections concerns a completely open-list proportional electoral system, in which voters chose one single candidate from a predominantly alphabetically ordered list.Footnote 9 The FNES asks about whether the respondent chose a candidate of her or his own gender, so we are able to construct our second dependent variable (vote for female candidate). This is coded 1 if the respondent declares a choice of a female candidate and 0 otherwise.
Independent Variables
To test H 2 and H 3, the primary independent variables of interest are respondents’ political gender stereotypes. Following previous works (e.g., Huddy and Terkildsen Reference Huddy and Terkildsen1993a, Reference Huddy and Terkildsen1993b), we consider both personality characteristics and issue area competences. Our operationalization of political gender stereotypes includes issue competence (available in the presidential survey and the legislative survey) and personality traits (available only in the presidential survey).
A first battery of questions (included in both presidential and legislative surveysFootnote 10) inquired whether respondents thought women or men in elected office are better at handling each of the following policy issues: security issues, the economy, social policy and equality policies, or whether they saw no difference. The individual answers are recoded into two variables: male policy issues (adding security and economy) and female issues (adding social and equality policy). Both measures are coded so that higher values mean more stereotyped views.
A second battery of questions (included only in the presidential survey) concerns trait stereotypes. Specifically, respondents were asked whether women or men candidates and officeholders tend to be more assertive, compassionate, consensus building, and ambitious, or whether there is no difference between them. Again, in accordance with previous research, we classify compassionate and consensus building as feminine traits and assertive and ambitious as masculine traits, and we build our additive measure of male and female traits accordingly.Footnote 11 Higher values represent more stereotyped views.
A third battery concerns the general competence of politicians. Respondents were asked whether men or women are better decision makers; also, they were asked whether women decision makers are better informed than men on issues important to ordinary people. Both questions tap into country-specific idiosyncrasies of gendered perceptions of politicians that we expect to shape the support for female candidates.Footnote 12 Again, an additive index was constructed, with higher values indicating more stereotypes views.
We include two additional sets of independent variables: the first is a series of sociodemographic controls that include education, sex, age, and left-right ideology. Ideology serves as a proxy for potential differences among party constituenciesFootnote 13—something that has been extensively discussed for the U.S. case. A second group of controls is necessary when analyzing the 2011 FNES data, which concern actual electoral choices. To tackle the potential effects of incumbency in multimember districts with multiparty competition, we consider the role of incumbency at the contextual level—that is, whether the respondent faced a female incumbent for his or her preferred party.Footnote 14 In addition, at the micro level, we include a measure of whether the respondent thought that prior experience is an important criterion for voters’ selection among candidates. Finally, we include a variable asking about the importance of (female) descriptive representation, which has been shown to be influential by earlier work on Finland (Holli and Wass Reference Holli and Wass2010).
As our dependent variables are dichotomous in nature, we estimate logistic regression models.Footnote 15 We also ran alternative model specifications with additional sociodemographic controls as well as party and social class fixed effects; our results remained unchanged.
EMPIRICAL FINDINGS
We begin our empirical analysis with exploring the existence of political gender stereotypes in largely egalitarian Finland based on data from all three available data sources.
Political Gender Stereotypes in Egalitarian Finland
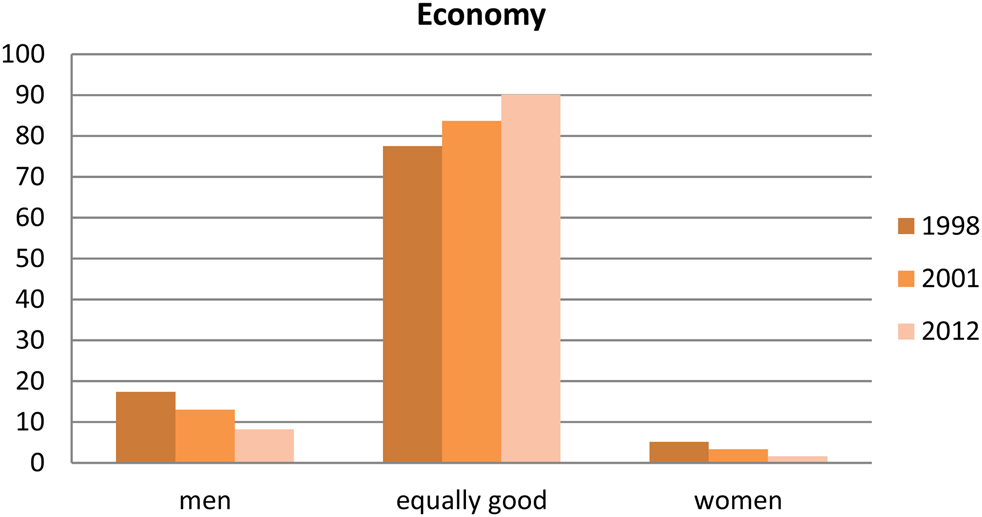
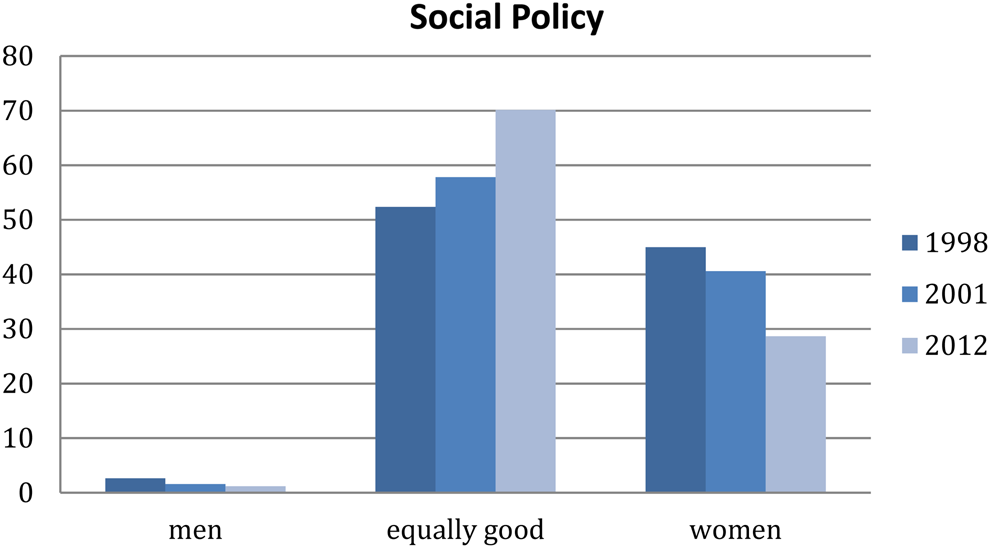
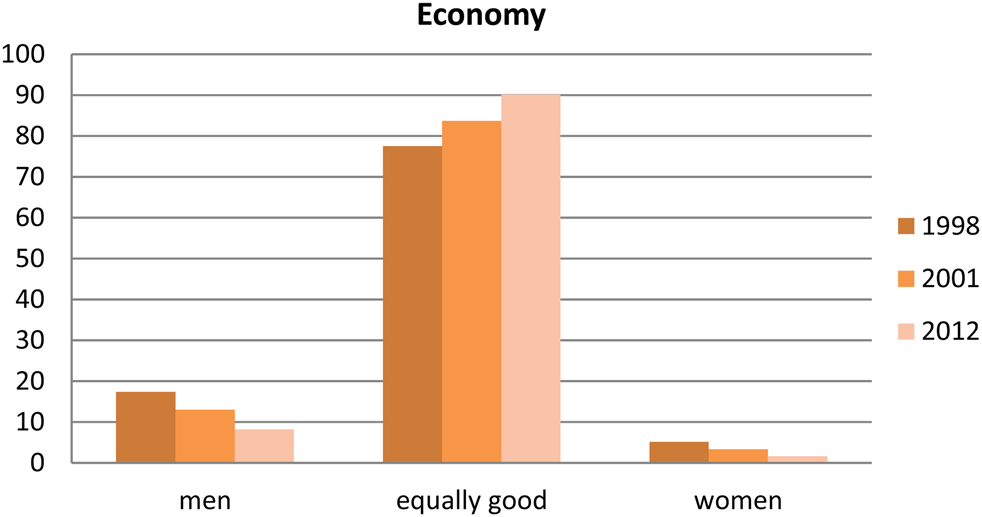
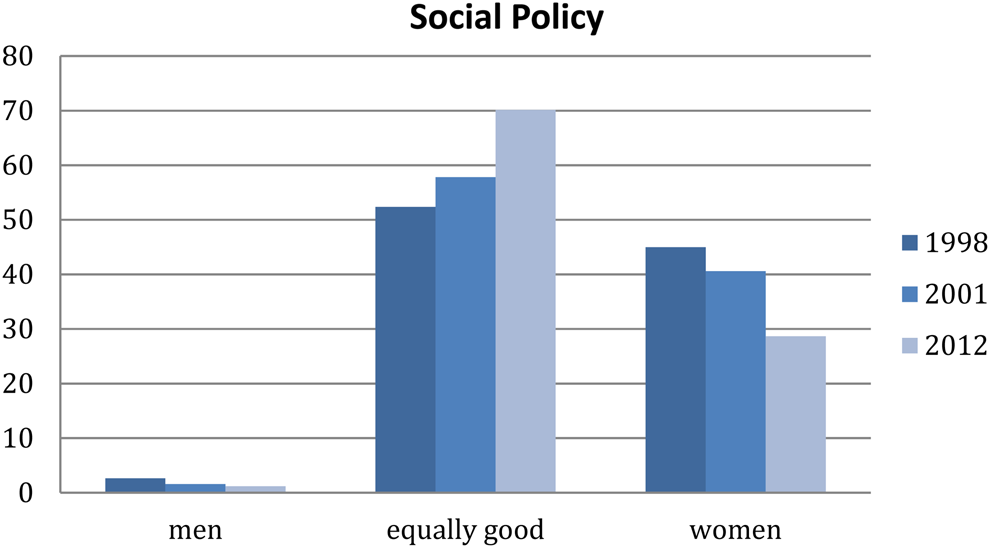
To explore whether political gender stereotypes weaken over time (H 1), we sketch their longitudinal development using Gender Barometer data. Both Figure 1 (economy) and Figure 2 (social policy) make apparent that there is an important development toward fewer stereotypes, as the shares of “equally good” are growing significantly since 1998. This holds for both economy, where men hold a slight advantage (Figure 1) and social policy, where women hold a much clearer advantage (Figure 2). Based on these time trends, we can speculate that gender stereotypes in politics will vanish in the sense that the shares of individuals answering “equally good” will continue to grow. We examined age cohorts separately and found that the development toward more neutral attitudes is similar for young and old voters.Footnote 16 However, about one-quarter of the population (depending on the question) persistently holds stereotypes. With the data at hand, we can only reason about the drivers of this development. What is clear, though, is that it cannot solely be attributed to an increase in female parliamentary representation. In fact, the figures for female candidates and MPs in the Finnish parliament have been quite stable since 1999 (around 37% to 42%; see Appendix A online for details). We should note that from the beginning of the 1990s, the horizontal segregation of labor between male and female ministers gradually started to change in a more significant manner, whereby female politicians were given high-profile “male portfolios” (and vice versa). However, it took until 2011 for a woman to hold the influential position of the minister of finance for the first time.
Issue competence stereotypes over time, economy. N = 1,839 (1998), 1,874 (2001), and 1,582 (2012). Source: Gender Barometer Finland.
Issue competence stereotypes over time, social policy. N = 1,839 (1998), 1,874 (2001), and 1,582. Source: Gender Barometer Finland.
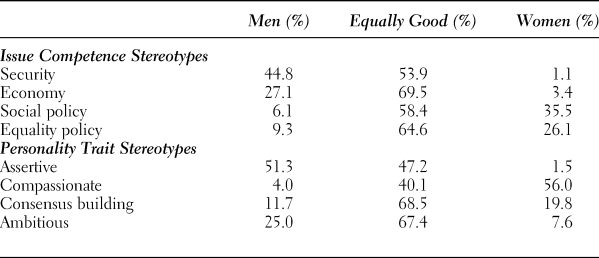
We proceed with a supplementary illustration of political gender stereotypes based on the 2012 presidential survey,Footnote 17 which includes an additional set of questions on trait stereotypes. Table 1 demonstrates the presence of political gender stereotypes in Finland: we see that most respondents answer that women and men would be “equally good” (about 50% of the sample). However, those that do not see men and women as “equally good” fall into the classic stereotypical categories of existing literature: men are perceived as more competent in matters of security and economy, while women are perceived as more competent to deal with social and equality issues. Interestingly, compared to the U.S. findings, the shares of “equally good” are higher in Finland. At the same time, however, fewer Finnish voters hold counterintuitive stereotypes (e.g., women are more competent in the economy sector) than what is observed in the United States. Regarding trait stereotypes in Finland we see the following picture: assertiveness is a predominantly male (51.3%) rather than female (1.5%) trait; the opposite is true for compassion, which appears to be a female (56%) rather than a male (4%) trait. On the other hand, in both cases, there are many respondents who associate these traits with both genders (47.2% and 40%, respectively). Ambition and consensus building seem to be relatively gender neutral, as higher proportions of respondents associate them with both genders; yet if we look closer, ambition tends to be a male trait (25%) and consensus building a female trait (19.8%). Delving deeper into the question who holds stereotypes (see Figures F1 and F2 in the online appendix), we find that stereotyped beliefs are more widespread among men and among partisans of two right-leaning parties, namely the National Coalition (KOK) and the True Finns.Footnote 18
Frequencies of political gender stereotypes

Note: Data from presidential (2012) survey. Question wording: “In your opinion, a MP of which gender is better able to act in the following matters?” (issue competence); “When you consider the candidates running in elections and the elected representatives in general, do you relate the following characteristics rather to men or to women?” (personality traits). N = 560.
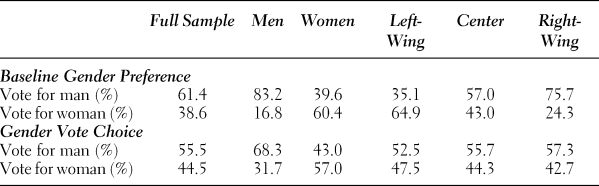
Table 2 illustrates our findings concerning voters’ hypothetical preferences for female candidates (upper row) and actual choices of female candidates (lower row) as well as how they are distributed among male and female voters across the ideological spectrum. On the one hand, gender preferences exist, with voters preferring a candidate of their own gender to a large degree in a hypothetical setting (upper row), but in real-world electoral choices, male and female candidates are chosen almost to the same degree (lower row). We do see, however, a difference between the sexes: men consistently favor male candidates be it hypothetically (83.2%) or for real (68.3%). Only slightly more women opted for a female candidate (60.4%) in the hypothetical setting compared with the share of women who actually selected a female candidate in the legislative election (57%). On the other hand, ideology seems to play an important role only in hypothetical choices (upper row); when analyzing actual choices (lower row), we find almost no differences across the ideological spectrum. What is interesting is that right-wing voters tend to overselect men in the hypothetical setting of the presidential election compared with the actual legislative election. The opposite is observed for left-wing voters, who overselect women in the hypothetical setting compared with their actual choices in the real election. Interesting to note is that centrist voters behave in the exact same way across contexts of choice. These descriptive findings shadow regression results, where we find almost no differences according to ideology (results in Appendix H online).
Preferences for and selection of male and female candidates

Note: Data from presidential (2012) survey (upper row), N = 560; data from FNES (2011) legislative survey (lower row), N = 594.
Preference and Support for Female Candidates
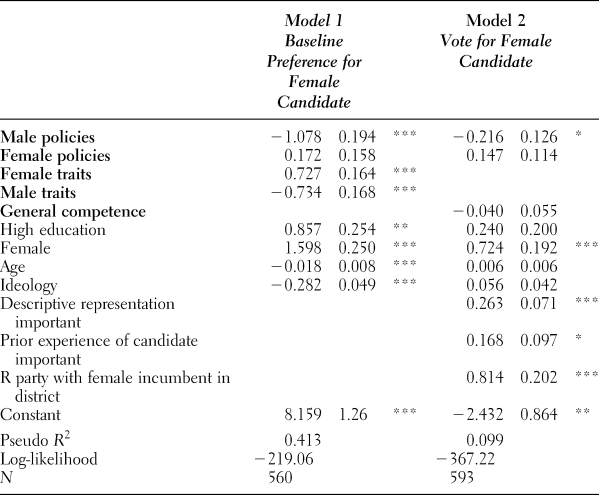
Table 3 presents the results of our logistic regressions concerning hypothetical gender preferences (presidential survey) and real-world selection (legislative survey). Closely following previous work on the United States, the table includes factors (e.g., male policies) instead of single items (e.g., security, economy). Similar to the United States, stereotypes in Finland are highly relevant for explaining the preference for a female candidate (hypothetical choice between two equally qualified candidates) (Table 3, Model 1). The influence is in the expected direction: regarding issue competence, less stereotyped views on male policies and more stereotyped views on female policies are good predictors for a preference for a female candidate (in support of H 2). The same holds for less/more stereotyped views on male/female personality traits.
Determinants of attitudes toward female candidates

Note: Data from the presidential survey (Model 1) and legislative survey (Model 2).
* p < .10; ** p < .05; *** p < .001.
However, stereotypes are not particularly strong in explaining the actual electoral choice of a female candidate on a party list (Table 3, Model 2, against H 2). Here, we find only a very modest negative influence of male policies (i.e., less stereotyped views are associated with higher probability of choosing a female candidate). This finding is in line with our hypothesis about the influence of stereotypes on choices varying across contexts (H 3). In real choices, other factors seem to be much more important and gender stereotypes play only a very minor role. We should also note that general competence stereotypes (only included in Model 2) seem unimportant. With regard to control variables we report that: sex (female) proves significant in all models—that is, gender differences exist (as we also know from earlier work); respondents with high education are more likely to support a female candidate (if significant); and the desire for women's descriptive representation matters. A strong predictor for the electoral choice is also whether a female incumbent ran in the district. This corroborates previous U.S.-based findings regarding the enormous weight carried by incumbency for the selection of female representatives. Ideology is a significant predictor only for the hypothetical choice and thus not a structuring factor of gender stereotypes as in the United States (see also models separated by ideology in the Appendix H online). This is a key difference between the U.S. two-party system and the Finnish multiparty system.
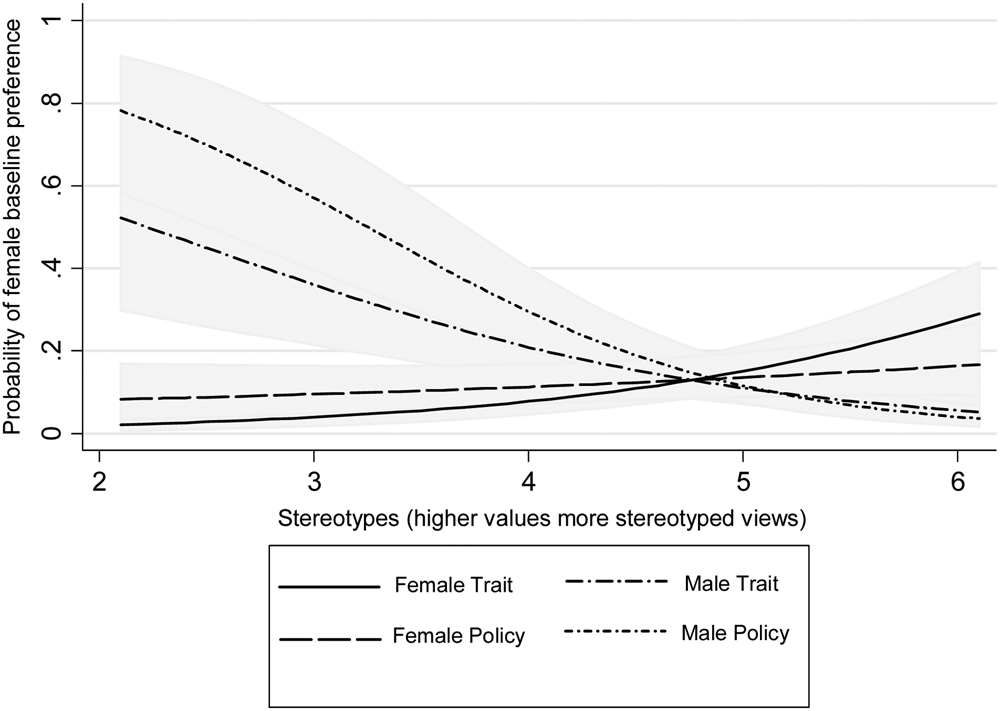
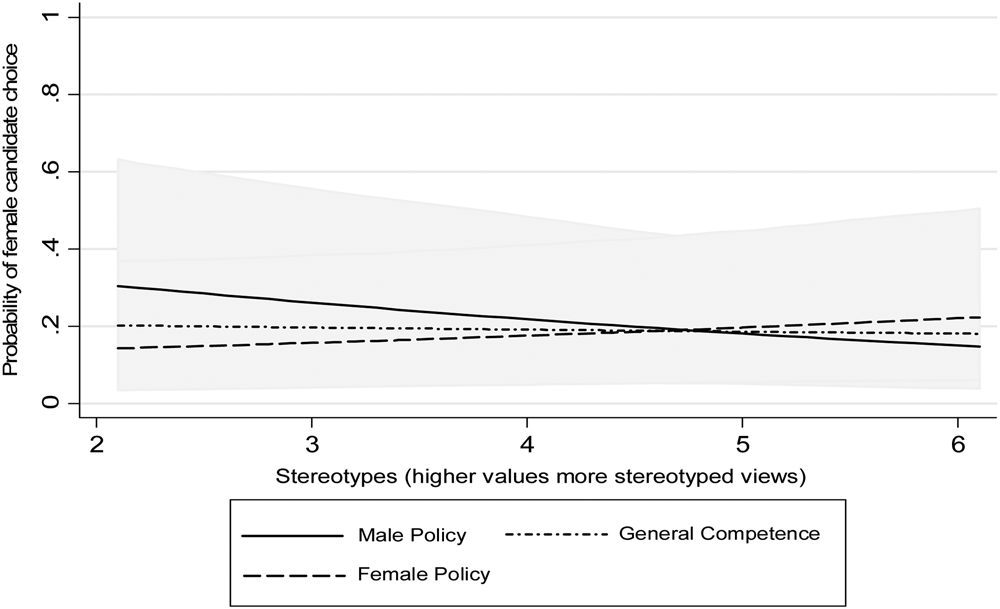
Figure 3 shows the extent to which stereotyped views on issue competence predict a higher probability of a preference for a woman in a hypothetical frame. Low scores on female traits and policies are associated with a higher probability of having a preference for a female candidate in the hypothetical setting. We can also see that male traits and policies have a stronger influence than female ones. Figure 4 concerns voters’ selection of female candidates in real life (otherwise all similar to Figure 3). Here, we see that stereotypes have a much lower influence: the slopes are very flat in the case of actual vote choices. In fact, none of the variables is significant, and the confidence bounds overlap.
Impact of gender stereotypes on baseline preference for a female candidate. Figure is based on Table 3, Model 1. The gray areas reflect 95% confidence intervals.

Impact of gender stereotypes on selection of a female candidate. Figure is based on Table 3, Model 2. The gray areas reflect 95% confidence intervals.

DISCUSSION AND CONCLUSION
Our pioneering study of political gender stereotypes in an egalitarian country with a multiparty open-list PR system produces findings with profound theoretical and methodological implications for the study of political gender stereotypes. It not only shows that gender stereotypes diminish with women's increased presence in politics but also points out enduring disparities between male and female voters as well as voters on the different sides of the political spectrum. Moreover, it draws attention to the varying effects of gender stereotypes across genuine elections and hypothetical contexts.
To begin with, in Finland, political gender stereotypes diminish with time and they are less pronounced compared with the United States. This suggests that higher levels of gender equality and/or women's representation in politics weaken such stereotypes. Yet how much “dosage” of women is needed in politics and for how long—that is, does, for example, one incident of a female president suffice? To be sure, 14 years (the period covered by our data) may not be “enough” to see change over time. While declining trends observed in increasingly egalitarian Finland could point toward a more general tendency of diminishing stereotypes against female politicians if gender equality is promoted in politics and society, we should underline that stereotypes are not completely eradicated. In 2012, women were (still) perceived as better able to handle social and gender equality issues while men are perceived as better able to deal with economic and security issues (Table 1).
However, the (persistent yet declining) pattern of women's perceived superiority in social policy could also result from the politics of presence. Voters’ evaluation of women as more competent than men in social policy could be stemming from voters’ experience with female politicians’ performance in this particular area. One of the normative arguments in favor of increasing women's descriptive representation is that women's presence in politics would improve women's substantive representation: women in power would politicize issues that matter to women. The expectation that female politicians engage more or better in issues of gender equality and social welfare that aim at increasing the autonomy of female citizens and at redressing female disadvantages in the areas of production, reproduction and care (Phillips Reference Phillips1995; Wängnerud Reference Wängnerud2000) has been empirically confirmed in the Nordic context. Studies of Sweden (Wängnerud Reference Wängnerud2000) and Norway (Skjeie Reference Skjeie1992) show that compared with male ones, female politicians prioritized gender equality and social welfare issues more, especially during the 1980s and 1990s. In this reading, the findings presented in Figure 2 for Finland should not be primarily interpreted as a stereotypical predisposition; they could, instead, result from a positive evaluation of women's performance in the policy areas because they were active in these areas (cf. Kuusipalo Reference Kuusipalo2011).
That being said, our study of Finland connects to Wängnerud's (Reference Wängnerud2000, 86) conclusion that women should not be confined to the policy areas that are important to women (more than they are to men). In the long term, “it would be rather peculiar”, if women and men did not exercise power and influence in all domains to the same extent (Wängnerud Reference Wängnerud2000, 86). Yet this may be a development that happens in stages, and it may be impossible to move from low to high proportions of women's politicians “without going through a stage wherein patterns of ‘masculine’ and ‘feminine’ appear in the content of politics” (Wängnerud Reference Wängnerud2000, 86). Historically, Finland has been considered to display a “dual citizenship” model: despite women's early entrance into and high representation in national politics, until the 1990s, the social and political roles assigned to women and men were different (Kuusipalo Reference Kuusipalo2011). The rigid horizontal gender segregation in politics started to diminish in the 1990s, as female and male cabinet ministers were appointed to “unconventional” policy sectors (Kuusipalo Reference Kuusipalo, Lipponen and Setälä1999, 69, 72–73; 2011, 12). It should be underlined that, contrary to other Scandinavian countries, Finland made no use of quotas or zippered lists in elections and had women climb the ladders to executive power much faster than in other countries, reaching up to the country's presidency. In sum, from the 1990s onward, Finnish women got power and influence in several policy areas—not just those that concern “women's interests”.Footnote 19
In this regard, it is important to highlight that though the basic patterns of stereotypes are the same in Finland and the United States, more Finns than Americans regard female and male politicians as equally good in most policy areas. This may connect to the fact that Finnish women did not just enter politics in much higher numbers but also got access to very powerful offices and more policy areas compared with American women. While our analyses show no direct, linear link between the presence of women and the decline of stereotypes, the relationship seems to be more complex and intertwined with other societal developments. Future research should look deeper into how gender stereotypes interact with the presence of women.
The supply of female candidates by all parties, the large number of women in Finnish politics more broadly and their engagement in different portfolios may have caused a lessening of stereotypes and increased trust in women's competence. Does this bring advantages to female politicians? Our study shows that fewer Finns than Americans hold counterintuitive issue competence and trait stereotypes, namely that female politicians are better in handling economic policy, or that they are associated with ambition or assertiveness. This suggests that as stereotypes fade out, the decrease of discrimination against women in traditional male policy areas (e.g., economy) does not translate into an increase of bias in favor of women. This contrasts to what Brooks (Reference Brooks2013) finds on the basis of experimental data, namely, that when voters make gendered assumptions about candidates, the stereotypes they invoke benefit female candidates.
Relatedly, we designed our research in such a way so as to assess the effect of stereotypes across contexts of choice: we find that stereotypes matter differently in hypothetical and real choices, which solidifies existing evidence from the United States (Dolan and Lynch Reference Dolan and Lynch2014). Similar to the United States, there is no statistically significant effect of political gender stereotypes on voters’ choices of ‘real’ candidates, except for the supporters of two right-wing parties (KOK and True Finns). Though our findings complement Dolan's (Reference Dolan and Lynch2014) study examining races for the U.S. House of Representatives in the United States, a woman ran against a man, whereas in Finland, many women are pitted against many men. Importantly, the gender competition is within parties (rather than between parties). It is remarkable that, despite these key differences (i.e., the structure of competition and women's presence) between the two countries, the picture painted by Finnish and American data is very similar; this is very important given that, to date, no evidence except for the single U.S. case existed.
Do these findings mean that actual electoral behavior is gender neutral—that is, that gender does not in fact play a role in real-life elections more generally? While political gender stereotypes may not be critical for voters’ choices, gender still matters. First, we know that women's votes for female candidates are linked not only to district magnitude but also to the presence of female candidates and deputies (Giger et al. Reference Giger, Holli, Lefkofridi and Wass2014). High ratios of women to men are thought to eliminate token-effects, such as (disproportionate) visibility (Kanter Reference Kanter1977).
Second, voters’ gender plays an important role. Our inquiry sheds new light on a feature, which previous studies on Finland (Giger et al. Reference Giger, Holli, Lefkofridi and Wass2014; Holli and Wass Reference Holli and Wass2010) have pointed out: contrary to U.S. results, in Finland, it is actually men who engage more in same-gender voting than women. Though our data does not provide general evidence that men's tendency to vote for men is associated with political gender stereotypes, when we look at supporters of specific parties, we see that men with the strongest gender stereotypes support right-wing parties (KOK and True Finns).
Combined with previous findings on the United States, our study raises questions about the nature and strength of gender stereotypes in other countries. We hope that future research will, eventually, generate the necessary (yet nonexistent) cross-country data to examine the strength and effects of stereotypes on voters’ choices from a comparative perspective. This seems even more prevalent as more and more countries move toward more personalized proportional systems, which give the voter a lot of freedom to select the gender of candidates (Renwick and Pilet Reference Renwick and Pilet2016). In this sense, the study of the Finnish case with its fully open-list PR system is very relevant to contemporary scholarly debates.
SUPPLEMENTARY MATERIAL
To view supplementary material for this article, please visit https://doi.org/10.1017/S1743923X18000454