While the welfare state experienced remarkable growth and expansion after the Second World War, the global economic crisis of the early 21st century reignited debates over its sustainability. Conservatives argue it fosters dependency,Footnote 1 while neoliberals criticize its inefficiencies and paternalism.Footnote 2 Rising unemployment, ageing populations and fiscal strain have intensified calls for welfare austerity, prompting many nations to cut social spending.Footnote 3
In contrast, China has defied this trend by significantly expanding its welfare provision since the late 1990s.Footnote 4 Despite the global trend of welfare retrenchment, China has increased its welfare expenditure, expanded programmes and extended coverage.Footnote 5 In the realm of affordable housing (AH hereafter), local governments in China, driven by fiscal pressures and incentives such as the target responsibility system, have adopted distinct fiscally oriented models when implementing AH policy. These approaches frequently deviate from the stated social welfare goals in pursuit of economic and fiscal benefits. The “entrepreneurial” and “extractive” models identified in this research are the specific manifestations of these subnational strategies.
Given China’s significant role in the global economy and its potential to serve as a model for other developing nations, its experience with the prolonged and rigorous expansion of social welfare may offer valuable lessons for upgrading welfare systems, or at least public housing, elsewhere. This calls for a novel and more nuanced understanding. Focusing on affordable housing, we explore how local governments in China implement AH policies when faced with significant fiscal pressures and performance targets. We also investigate two distinct models of fiscally oriented AH provision that have emerged at the subnational level and examine the driving forces that shape these discrete AH provision models. This paper employs a comparative case study of public housing provision in China to explore these questions.
We argue that, unlike traditional welfare states where the provision of public services is usually treated as a form of social expenditure that is made without consideration of economic returns, some local governments in China are actively promoting social welfare to generate profits for local finance. Moreover, despite sharing the same goal of revenue maximization, varying degrees of fiscal pressure lead to divergent strategies in the implementation of public housing policy.
Our study contributes to the literature in three key ways. First, while previous studies on welfare provision in centralized states have primarily dwelled on national-level concerns such as moral legitimacy or regime stability, we examine subnational governments as the actual local policymakers and implementers of housing welfare, uncovering their underlying motivations. Second, we identify discrete fiscally oriented public housing provision models, advancing understanding of China’s subnational welfare regime. Third, our findings not only explain why local governments sustain welfare spending despite global retrenchment trends but also attribute differences in fiscally oriented models to fiscal pressures. This underscores the role of the target responsibility system in shaping grassroots governance in China.
The remainder of this paper is structured as follows. The next section provides a comprehensive review of the major theories concerning the driving forces behind welfare provision that form the basis for the research inquiries pursued in this study. The paper then introduces the case background and research methodology, setting the stage for the comparative case studies in the section following that. There is then an analysis of the key drivers behind the divergent models of public housing provision in local China. The paper concludes with a discussion of the significance of the for-profit model nationwide and the research limitations.
Literature Review
Understanding the complexities of welfare provision in China requires an examination of established theoretical frameworks while also acknowledging their limitations and the unique characteristics of the Chinese context. This section reviews the general theoretical perspectives on welfare provision and the driving forces behind divergent approaches to local welfare provision.
Theoretical perspectives on welfare provision
The question of why political states provide social welfare has been a central theme in comparative studies of political economy. The early structural approach posits welfare state expansion as a functional requisite for societal and economic reproduction.Footnote 6 This approach draws attention to two important welfare state theories: the logic of industrialism and the logic of capitalism. The logic of industrialism assumes that industrialization creates new demands for public spending and regards the welfare state as a by-product of economic development.Footnote 7 The logic of capitalism, also associated with neo-Marxist thought, views the welfare state as a response to, or pre-emptive mechanism against, class conflict, one designed to ensure capital accumulation by making concessions to labour.Footnote 8
The second-generation studies of the welfare state criticize the structural emphasis on industrial or capitalist development. The power resource theory, for instance, emphasizes the role of the political strength of social classes, particularly leftist political parties, in shaping distributive processes and demanding greater redistribution.Footnote 9 Others within this school argue that employers, too, could drive welfare expansion, pressing for generous social insurance to share costs, mitigate risks and improve firm competitiveness in tight labour markets.Footnote 10
Contrary to the power resource theory, the institutional approach, which centres on the organization and structure of state institutions, provides a more directly relevant framework for understanding welfare development in contexts where the state plays a dominant role, such as China. This perspective redefines the state not as a passive reflector of societal demands but as an active agent in social policy formation.Footnote 11 For instance, studies have shown that administrative or fiscal centralization can be a better predictor of welfare programme expansion.Footnote 12
The Chinese welfare system, which is often characterized as a “state project,” designed primarily by state actors rather than emerging from societal pressures like interest group lobbying or party politics, aligns well with this state-centred view.Footnote 13 However, the application of this approach must be nuanced to account for the specificities of subnational governance, where local state actors may develop their own institutional logics and capacities that drive welfare provision in distinct, and sometimes divergent, ways from national objectives.
Logics and drivers of welfare provision in local China
Scholarship on welfare provision in non-Western states has identified several key motivations that move outside the frameworks typically applied to Western contexts. One prominent line of argument emphasizes moral obligation, or authoritarian paternalism, where the provision of welfare is seen as a crucial ingredient of regime legitimacy.Footnote 14 In China, the notion that good governance entails guaranteeing the people’s livelihood has deep historical roots and continues to inform the state’s “logic of legitimation.”Footnote 15
Another body of literature points to more utilitarian rationales, primarily regime security or social stability. Welfare benefits are strategically deployed to placate the masses, co-opt potential challengers or secure the loyalty of key groups such as the military, police and bureaucracy.Footnote 16 In the Chinese context, social insurance programmes have been interpreted as mechanisms to reduce social resistance among urban workers, laid-off employees and land-losing farmers, while broader public goods provision aims to garner public support for the regime.Footnote 17 The “cadre performance evaluation” system is often cited as a mechanism through which the central state ensures that local officials implement policies, including those related to social stability. Local officials may proactively design welfare policies to prevent social unrest, thereby securing their positions or even gaining promotion.Footnote 18
A key strand of literature concerns the divergent implementation of welfare policies in China. While central mandates advocate for broader welfare coverage, local implementation, particularly in sectors like housing, frequently deviates from these intentions, resulting in “selective implementation.”Footnote 19 This deviation is not merely non-compliance but often involves strategic adaption, the re-prioritization of goals or the selective inclusion or exclusion of beneficiaries.Footnote 20 This divergence does not solely result in under-provision; it can also foster alternative, locally driven models of welfare provision.
The fundamental logics underpinning these deviations stem mainly from complex central–local dynamics and fiscal imperatives. First, the central–local relationship in China is characterized by a complex interplay of authority, negotiation and strategic action, rather than simple top-down command and obedience. Central policies, while setting broad objectives, may lack precise implementation guidelines or robust monitoring, creating “implementation gaps” that allow local governments to adapt policies to local conditions and priorities. This ambiguity is compounded by information asymmetry, hindering effective central oversight.Footnote 21 Local governments thus act as strategic agents by sometimes engaging in “experimentation under hierarchy” or adopting “creative, symbolic, and distorted instruments” to manage central directives alongside local pressures.Footnote 22
A second major incentive lies in fiscal imperatives. China’s system of fiscal decentralization assigns substantial expenditure responsibilities for public services, including welfare, to local governments, often without commensurate revenue streams. This creates a persistent “vertical fiscal imbalance,” or a scenario of “insufficient funds but excessive responsibilities,” as documented by Christine Wong, which largely compels local governments to engage in revenue-seeking behaviour.Footnote 23 Studies indicate that fiscal decentralization can negatively impact the supply of basic public services, as local governments, facing fiscal imbalances, prioritize investments in productive infrastructure that is expected to yield quicker tax returns.Footnote 24 This tendency is exacerbated by inter-local competition, often manifesting as a “GDP race,” where economic performance becomes the primary metric of success.
The preceding review, which has streamlined general welfare theories and focused on the specific drivers of local policy deviation in China’s welfare sector, reveals several critical gaps in the existing literature. First, much of the welfare literature either emphasizes national-level goals, such as social stability or regime legitimacy, or focuses on issues of policy failure, under-provision or retrenchment, rather than on proactive, alternative constructions of welfare by local states. There is scant research on how the local factors, such as fiscal pressures, cadre incentives and the dynamics of strategic policy implementation, converge to produce distinct, profit-oriented models of welfare provision at the subnational level.
Second, the sheer variety of local welfare models and the precise mechanisms through which local governments instrumentalize welfare for economic or fiscal ends require a more granular, comparative case study examination. It is not enough to invoke general “developmental state” arguments; understanding how different degrees of fiscal pressure, varying local institutional capacities or specific socio-economic contexts lead to different types of fiscally oriented welfare strategies remains an underdeveloped area.
Third, the existing literature on local policy deviation in China often highlights behaviour such as the shirking of responsibility, defensive administration in response to heightened accountability, or selective policy implementation, which implies passive resistance or reluctant adaptation to central mandates. There is a discernible gap in understanding the proactive re-purposing of welfare policies by local states as a deliberate strategic choice aimed at revenue generation or broader economic development. This moves the analytical focus from local non-compliance or under-performance to local strategic re-orientation of policy goals.
These gaps in the literature hinder not only a comprehensive understanding of comparative state welfare provision but also knowledge of welfare state building in China and its associated governance capacity. How and why do local governments in China develop fiscally oriented models of welfare housing provision? What accounts for the variation in these fiscally oriented public housing strategies observed across different localities, even those subject to similar overarching administrative frameworks? The next section introduces the case background and methods of inquiry. It is then followed by an analysis of two different models of welfare housing provision used in one city.
Case Background and Research Design
Case background
This study examines two cases of public housing provision in two districts (anonymized as Trinity District and River District) within Chongqing, a municipality directly under the control of the central government (zhixia shi 直辖市), in south-west China. The two districts are located adjacent to each other and share comparable economic and demographic conditions. They are also under a similar degree of political pressure from the municipal government to provide public housing for the urban poor. These similarities allow us to apply the “method of most similar” for comparative studies. However, despite their similarities, these two districts have adopted remarkably different strategies for offering housing benefits, making them ideal cases for comparison.
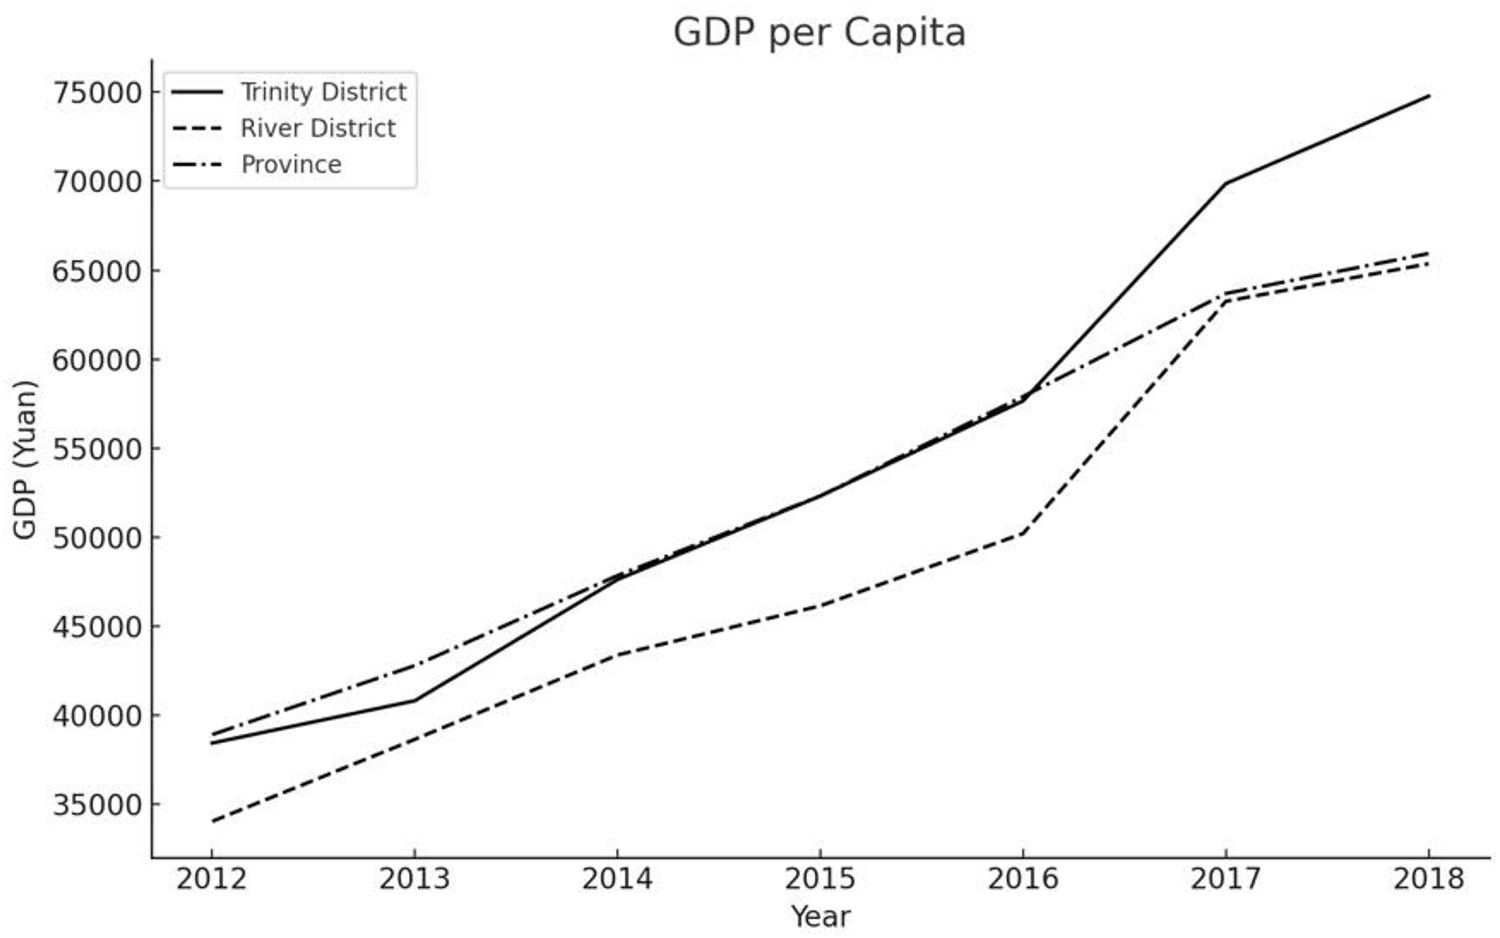
Economically, the two districts are comparable in size and industrial structure. Over a five-year period from 2012 to 2016, Trinity District experienced rapid economic development, with an average annual GDP growth rate of 12.1 per cent.Footnote 25 By 2016, Trinity’s GDP had reached 63.6 billion yuan (US$9.9 billion), with contributions from its three-sector economic structure (primary, secondary and tertiary) amounting to 9 per cent, 56 per cent and 35 per cent, respectively.Footnote 26 Similarly, River District’s GDP grew at an average annual rate of 12.4 per cent in the same period.Footnote 27 In 2016, River District’s GDP was 67.4 billion yuan (US$10.5 billion), with its three sectors contributing 12 per cent, 59 per cent and 29 per cent, respectively.Footnote 28 Demographically, both are populous districts: River District has a population of 1.5 million, while Trinity District is home to 1.2 million people. Figure 1 compares the GDP per capita of the two districts with the municipal GDP per capita.Footnote 29 Studying cases from the same municipality enhances comparability as both districts are subject to the same political resources and policies.
The GDP per Capita of Trinity District, River District and the Municipality

Methodology
This research is based on several rounds of fieldwork conducted in the two districts from 2014 to 2018. Until now, data on public housing provision in China have been fragmented, with no systematic and official statistics available for scientific analysis. During our field trips, we conducted in-depth interviews with 38 local officials from the district governments, district bureaus of finance, and public rental housing management bureaus, as well as the leaders of industrial parks and managers of enterprises and factories. We also received generous support from senior officials in the municipal government, who granted us full access to archival materials, including investigative government reports and work reports, the scripts of leaders’ speeches and key policy documents on public housing programmes.
We employ a subnational comparative case study as our primary method of inquiry because it allows us to explore the causes at a micro level, with the macro-political and macro-social conditions being held constant.Footnote 30 Considering the high degree of heterogeneity of social welfare provision across China, a controlled comparison approach to analysing subnational cases is beneficial for gaining a better understanding of the motivations and deliberations behind housing welfare provision.Footnote 31
In terms of jurisdictions for comparison, there are plenty of cross-municipal and cross-provincial studies. However, the higher the level of government, the greater the disparities, such as demographical conditions, political resources, policymaking processes and leadership styles, between jurisdictions. In the cross-district comparison of this study, we attempt to control for several key variables that may influence welfare provision in order to unveil the potentially overlooked factors that contribute to the growing investment in social welfare.
The Two Models of Fiscally Oriented Public Housing Provision
We identified two distinct models of public housing provision, both of which are defined by their underlying financial goals and strategic time horizons. The entrepreneurial model involves leveraging public housing as a long-term investment tool to create a business-friendly environment, attract industrial development and cultivate future tax revenue. In contrast, the extractive model focuses on using public housing projects to secure immediate financial benefits and alleviate urgent fiscal burdens.
Trinity District: the entrepreneurial model
The case of public housing provision in Trinity District illustrates an entrepreneurial model in which local governments strategically leverage public housing as an instrument to attract investment and boost fiscal revenue. Specifically, the local government sets out to foster a business-friendly environment by allocating public housing apartments to employees who are ineligible to apply for traditional public housing but capable of generating benefits for the local government. This model of public housing provision encompasses three distinctive elements. First, the local government has a welfare policy in place that has been endorsed by the higher authority. Second, due to the ambiguity in the actual implementation of the policy, the superior government does not pay special attention to the policy beneficiaries. Third, the local government astutely chooses to leverage the welfare housing policy to attract investment with the goal of boosting fiscal revenue.
Trinity District, a prefecture-level city (diji shi 地级市) spanning 1,576 square kilometres, is home to 23 townships and a population of 1.18 million. In the early 21st century, it was faced with significant revenue challenges. In 2005, guided by the local government’s slogan that “industrialization strengthens the township, and industry enriches the city” (gongye qiangqu, chanye xingcheng 工业强区, 产业兴城), it constructed three industrial parks to attract investment in aggregated industries and promote the local economy. The Party secretary of Trinity District emphasized at an all-district cadre conference in 2014 that: “if Trinity District wants to be strong, industry must thrive; if industry wants to thrive, the industrial parks must allow it to flourish.”Footnote 32 In 2016, the output of the industrial parks exceeded 85.1 billion yuan (about US$13 billion), accounting for 71 per cent of the gross industrial output of Trinity District.
Although the concept of offering housing benefits was first discussed in 2008, a comprehensive public housing system was not implemented in Trinity District until 2014, under the guidance of both central and provincial governments. The stated aim was to “accelerate the synchronized development of urban and rural areas, expand the provision of social housing … and help lower-income households to obtain a proper living space.”Footnote 33
The planning and building of public housing in Trinity District are overseen by five government bodies: the land resources and housing bureau (LRHB hereafter), the finance bureau, the local development and reform commission (DRC hereafter), the urban–rural development commission and the audit bureau. The LRHB serves as the administrative authority in charge of these efforts. An interim low-rent housing centre, affiliated to the LRHB, was first created in 2008. This was followed by the formal establishment of the public rental housing management bureau (PRHMB hereafter) in 2012.
To ensure that public housing benefits were directed towards needy households, strict eligibility criteria were established from the outset. According to the official guidelines, there are several key requirements: applicants and their family members must hold a local, non-rural residence permit (hukou 户口) for Trinity District; the monthly income for a single applicant should not exceed 2,000 yuan, or 1,500 yuan per capita for a family; and current dwelling space must not exceed 13 square metres per capita at the time of application.Footnote 34
Approved applications are then allocated through an open lottery system managed by the PRHMB. Successful applicants are placed on a waiting list, and units assigned as they become available. Results are publicized for seven working days, after which contracts are signed if no complaints are received.Footnote 35
A notable phenomenon in Trinity District’s public housing programme is the simultaneous over-supply and under-delivery of units. From 2008 to 2016, the local government planned to build 14,472 units of public housing, yet only 5,379 households were deemed eligible.Footnote 36 Considering that not all qualified households would have applied for housing, the gap between supply and demand is even more pronounced. Despite this excess supply, more than half of all eligible households were not allocated public housing. By late 2015, only 2,227 out of the 14,472 available units of public housing had been allocated to needy families through the PRHMB, leaving 3,152 eligible households – more than half – unserved under this scheme.Footnote 37 This means a mere 15.4 per cent of public housing units in Trinity District were used for their stated purpose of assisting lower-income households.
What is the reason for such a mismatch in supply and demand? What happened to the more than 80 per cent of unused public housing units? The primary reason for the unserved population was not the denial of their applications: according to data obtained from the field, no single case was denied without proper reasons. We found that the 58.6 per cent of eligible households who were not allocated housing did not, in fact, apply for AH for reasons of location, convenience, amenities, etc., as has been identified in other AH literature.Footnote 38 In other words, this “mistargeting” is less about flaws in identifying needy individuals or administrative incapacity, as is sometimes seen in dibao 低保 allocation,Footnote 39 and more about a strategic choice to serve a different group (enterprises and their employees), under the guise of AH, as we show below.
This outcome stemmed from a dual-track mechanism for allocating housing benefits. One track, accounting for a small portion, delivered public housing to lower-income urban households through the legally prescribed open application system. The other, significantly larger track, repurposed public housing units as worker dormitories for enterprises setting up in Trinity District.
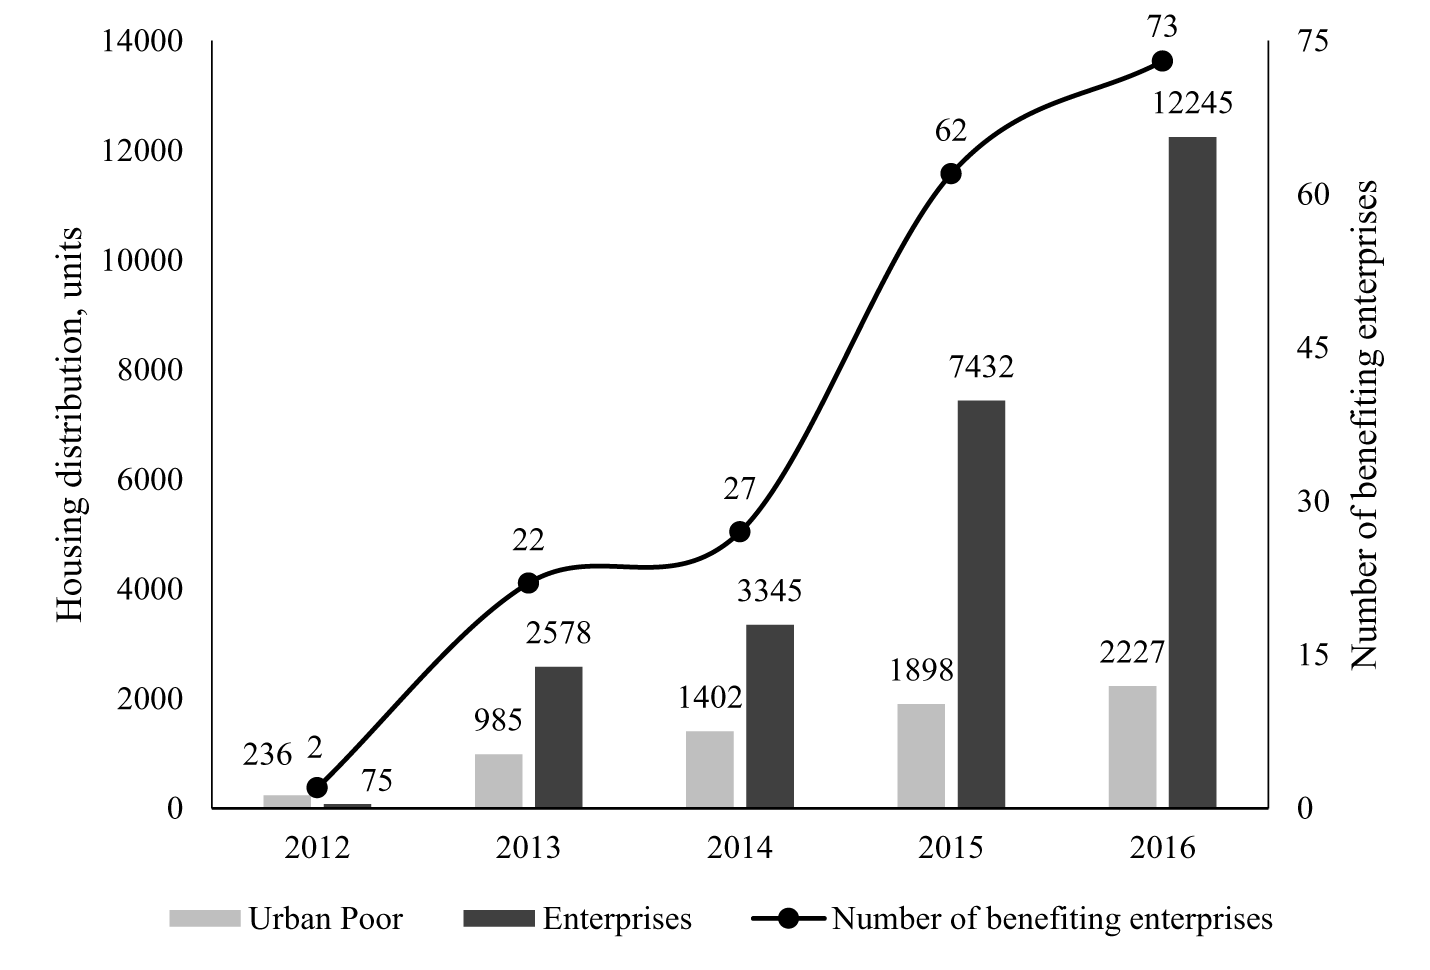
In 2012, Trinity District began offering blocks of public housing to highly profitable enterprises for low rents. These units were then converted into compact dormitories for migrant workers. Figure 2 illustrates that from 2012 to 2016, both the number and percentage of public housing units provided to enterprises rapidly increased in Trinity District. In 2012, 75 out of 311 units of available public housing were provided to two enterprises; by 2016, this number had soared to 12,245 units, representing 84.61 per cent of the total, serving 73 enterprises. Employees of these enterprises typically lack a local hukou, rendering them ineligible for local welfare benefits by law. Nevertheless, the local government assigned the housing units on a case-by-case basis, covertly bypassing the official application and allocation procedures.
Allocation of Public Housing in Trinity District, 2012–2016

Figure 2 Long description
Housing distribution, units Number of benefiting enterprises The horizontal axis shows 2012, 2013, 2014, 2015, 2016. The left vertical axis label is Housing distribution, units. The range is 0 to 14000. The right vertical axis label is Number of benefiting enterprises. The range is 0 to 75. Legend labels: Urban Poor; Enterprises; Number of benefiting enterprises. 2012: Urban Poor bar value 236. Enterprises bar value 75. Line marker value 2. 2013: Urban Poor bar value 985. Enterprises bar value 2578. Line marker value 22. 2014: Urban Poor bar value 1402. Enterprises bar value 3345. Line marker value 27. 2015: Urban Poor bar value 1898. Enterprises bar value 7432. Line marker value 62. 2016: Urban Poor bar value 2227. Enterprises bar value 12245. Line marker value 73.
Three factors enable officials to circumvent the specific requirements and procedures for public housing. The first is the creative interpretation of central policies. Officials claim that industrial workers are a part of “the people” (renmin 人民) and therefore providing them with housing aligns with the central government’s directive to improve people’s well-being. The local government also argues that, as the primary financial backer of these affordable housing projects, it has the right to determine how they are allocated. It defends this right by using the principle of “who invests owns” (shui touzi, shui suoyou 谁投资, 谁所有).Footnote 40 The second factor is strategic framing in communications with superiors. When responding to higher-level authorities, the district positions the allocation of housing units to businesses as “temporary use” and a “transitional accommodation arrangement” necessary to support key local industries facing a shortage of worker dormitories.Footnote 41 The third factor involves appealing to performance metrics. Local officials justify the distorted allocation of housing to their superiors by highlighting the positive economic outcomes. They argue that the practice attracts investment and stimulates regional GDP growth and tax revenue, both of which are key metrics in their performance assessments. This focus on economic returns often persuades higher-level authorities, who are also engaged in principal-agent relations, to “turn a blind eye” (zheng zhi yan, bi zhi yan 睁只眼 闭只眼) to the irregular housing arrangements.Footnote 42
The local government in Trinity District explicitly demonstrated a profit-making mindset, meticulously calculating costs and gains. Officials we interviewed widely believed that serving the enterprises was “a valuable investment” (zhide de touzi 值得的投资),Footnote 43 because it “contributes to the local GDP growth,”Footnote 44 “cultivates tax bases,”Footnote 45 and “increase[es] government revenue in the long run.”Footnote 46 In practice, enterprises are contractually obliged to meet specific investment, production and taxation targets, which are explicitly written into the “investment agreement” (touzi xieyi 投资协议), in exchange for housing welfare benefits provided by the local government. One official even stated that, “the ultimate goal is to promote business investment, so we would even provide free accommodation to some enterprises if they contribute significantly to local development.”Footnote 47 Conversely, providing welfare housing to eligible urban lower-income households is regarded as “not worthwhile” because, as one local official explained, “the minimal rent (yidingdian zujin 一丁点租金) collected from them does not even cover the annual interest on the bank loan [used to build these public housing projects] … and the cost would NEVER be repaid in this way (yongyuan zibu dizhai 永远资不抵债).”Footnote 48 Another official explicitly stated: “we are not engaged in charity work (zuo cishan 做慈善) … we have our own economic and fiscal considerations.”Footnote 49
On the one hand, the local government was not deterred by the formidable cost of the welfare expenditure as long as a substantial payback could ultimately be anticipated, primarily in the form of the expanded tax base brought by subsequent industrial prosperity. On the other hand, the local government carefully calculated the returns on every penny of investment to maximize economic gains, allocating welfare resources to enterprises, resourceful investors and significant taxpayers who can generate more profits, rather than to the most needy households. This approach aligns with observations by Youqin Huang and Jianyu Ren, who note that local governments in China often repurpose subsidized housing initiatives into “talent housing.” Such schemes prioritize attracting educated or skilled migrants deemed critical for “leading municipal innovation and the economy,” effectively shifting the focus of housing subsidies from broad welfare provision to strategic economic development.Footnote 50
The “entrepreneurial type” of public housing provision in Trinity District showcases how local governments regard welfare as a tool of economic development. The case clearly shows that in some localities of China, social welfare provision is no longer solely about assisting those in need and improving social security; it can also be leveraged by local governments as a vehicle to attract investment and create jobs, which in turn generate more tax revenues.
River District: the extractive model
The public housing provision in River District embodies an extractive model in which the local government used public housing projects to maximize immediate financial benefits and alleviate fiscal burdens. There are three key features in this extractive model of welfare provision. First, the execution of public housing policy was decentralized to the local government with the support and approval of the superior government. Second, the superior government, in its pursuit of a target-oriented approach to fiscal transfer, provided subsidies based on met targets, lacking a comprehensive understanding of the housing provision structure. Third, the local government employed various means to exploit public housing, generating additional financing to fill its fiscal gap.
Similar to Trinity District, River District is also a prefecture-level district in Chongqing. It covers 3,219 square kilometres and is home to 1.5 million people living in 29 townships. In 2016, its GDP reached 67.4 billion yuan, with a gross industrial output exceeding 200 billion. Renowned for its equipment manufacturing industry, the district was named “National Industry Demo Base for New Industrialization” in 2010. This designation brought it with immense pressure to maintain growth and upgrade industries, eventually contributing to the overall fiscal strain that drives the district’s specific use of AH funds as alternative funding sources.
River District began construction of its public housing provision for lower-income households under the guidance of both central and provincial governments. To oversee the implementation of housing initiatives, River District’s local government first set up a Leading Work Group for Housing Security, consisting of officials from six different departments. These include the local branch of the DRC, which handles investment plans for public housing construction; the finance bureau, which is in charge of funding allocation; the LRHB, which is involved in formulating long-term development plans; the urban–rural construction commission (URCC), which is responsible for housing construction; the market supervision bureau (MSB), which supervises the overall public housing works; and the civil affairs bureau (CAB), which is responsible for verifying the income of public housing applicants.Footnote 51 Additionally, in 2010, a dedicated housing security centre (HSC) was created under the affiliation of the LRHB, to handle public housing applications.
The eligibility criteria for public housing in River District are largely similar to those for Trinity District, except for some additional strict rules: applicants and their family members should hold a local urban hukou and must work and/or live in River District; monthly per capita income of families has to comply with the low-income criteria confirmed by the local government; and applicants and their family members cannot own any property, and their living space per capita should be less than 15 square metres. The HSC rigorously screens applications, publicizing details like applicants’ family size, work unit, living conditions, household income and assets. If no appeals are received, eligible applicants will be granted housing benefits and placed on a waiting list. Once units become available, allocation is based on income level, housing difficulties and how long applicants have waited. Regulations stipulate apartment size: up to 40 square metres for households with fewer than two members, up to 60 square metres for those with fewer than three members, and up to 80 square metres for households of four or more members.Footnote 52
Despite the clarity of the administrative structure and housing application procedures, several implementation issues exist with River District’s public housing programme, namely incomplete public housing projects, the excessive construction of low-rent housing and a counterintuitive geographical spread. First, the initial housing welfare plan was ambitious but remained unfinished. While the local government committed to offering 1.52 million square metres (26,305 units) of public housing by the end of its 12th Five-Year Plan period (2011–2015), less than 30 per cent of the projects – 372,300 square metres (7,309 units) – were under construction by 2015.Footnote 53 Rather than expediting construction, the local government announced the termination of the projects due to insufficient financial resources, as exemplified by a 17.1 million yuan (US$2.6 million) shortfall in required contributions in 2008.Footnote 54 The reasons for this stagnation remain unclear.
Second, the distribution of the two main types of public housing, namely low-rent housing (lianzu fang 廉租房) and public rental housing (gongzu fang 公租房) is unbalanced across the district. Out of the total 9,887 housing units built by the government by 2016, 8,848 were low-rent housing, while only 1,039 were public rental housing.Footnote 55 This deviates from the central government’s directive to “vigorously promote the housing welfare system focusing on public rental housing.”Footnote 56
Third, contrary to the conventional wisdom that public housing should be in suburban areas to cater to urban impoverished people, nearly half (49 per cent) of the public housing projects in River District were situated in the new downtown area: 35 per cent of the total housing was located in industrial parks, while only around 16 per cent was placed in suburban towns. According to the central government’s regulations, public housing projects should be located in less populated and suburban areas with cheaper land prices, as this helps conserve land resources for commercial and real estate development. The decision to place public housing predominantly around city centres went against reason.
A closer examination reveals that the River District government prioritized immediate financial gains over the well-being of its residents, employing three specific tactics to maximize benefits despite the housing projects’ imbalances and lack of success. First, the local government perceived the public housing scheme as an opportunity to secure “project/programme-specific” subsidies from the higher-level government. To quickly obtain these funds, River District hastily drew up construction plans and created ideal conditions for building. In 2008, the central government allocated 37.5 billion yuan as a special subsidy for local public housing projects. As one official recalled, “the subsidies are limited. If we did not seize the opportunity, money would end up in the hands of other districts.”Footnote 57 “Since everyone wants a piece of this cake, we have to ‘create [the right] conditions’ to get it.”Footnote 58 Consequently, the River District government “created” a very ambitious (and potentially inflated) public housing plan and received a subsidy of 514 million yuan for building public housing by 2015. However, owing to increased oversight from the National Audit Office since 2012, including annual investigations into public housing financing, numerous cases of misappropriated funds have been exposed. This heightened scrutiny made it difficult for River District to secure subsidies for its inflated plans. Consequently, the government gradually lost interest in welfare housing and officially ceased all new public housing construction in 2018.
The local government’s second tactic was to minimize its own expenditure to enhance its fiscal benefits. The excessive construction of low-rent housing was a deliberate choice: it was significantly more cost-effective than the provision of public rental housing. An internal document revealed that the final cost for low-rent housing was only 1,000 yuan per square metre, less than half the cost of public rental housing, even when taking into consideration all expenses and subsidies.Footnote 59 Table 1 presents a comparison of the relevant expenditure for providing the two types of public housing in River District. An official from the provincial public housing authority explained: “offering low-rent housing is more cost-effective for the local government … On one hand, it helps the local government to ‘save’ construction costs of 800 yuan per square metre; on the other hand, it seems to ‘earn’ additional subsidies of 500 yuan per square metre.”Footnote 60 Supporting this perspective, another local official emphasized: “the most critical issue for public housing provision work is the quantity, and whether the housing units have been built [i.e. not whether the units have been occupied]. Which types of public housing have been constructed is not that important.”Footnote 61 This points to a focus on meeting nominal construction targets rather than actual housing needs.
The Real Costs of Public Housing Construction in River District in 2016 (yuan/m2)

Table 1 Long description
The table compares per square meter construction costs, government subsidies, and resulting real costs for low-rent housing versus public rental housing in River District in 2016, using yuan per square meter. Low-rent housing has a construction cost of 1,700, supported by a 500 central subsidy and a 200 provincial subsidy, leaving a real cost of 1,000. Public rental housing has a higher construction cost of 2,500, with a 200 central subsidy and no provincial subsidy, leaving a real cost of 2,300. The real cost for public rental housing is more than double the low-rent housing real cost. Subsidies cover a much larger share of low-rent housing costs than public rental housing costs. Figures are summarized from interviews with local housing officials, so they reflect reported values rather than audited accounting records.
Source: Author’s summary. Data from interviews with officials from River District housing security centre, 15, 16 March 2016.
In a third tactic, local governments utilized housing welfare resources to secure bank loans. The construction of public housing was exclusively carried out in collaboration with state-owned enterprises. Once the houses were completed, the local government transferred the property rights of the public housing to these enterprises as capital, enabling them to access funding through bank loans or equity markets. Since Chinese local governments are statutorily prohibited from engaging in direct market borrowing, these specialized state-owned enterprises, known as local government financing platforms (defang zhengfu rongzi pingtai 地方政府融资平台), were able to raise funds through private sources. Motivated to “borrow more money from the banks to relieve the local government’s fiscal pressure,” local officials endeavour to drive up the value of public housing.Footnote 62 As the deputy mayor of the River District government explained, locating public housing projects in downtown areas helps to “preserve and increase” the value of public housing within the jurisdiction.Footnote 63 This explains the counterintuitive geographical arrangement of welfare housing programmes in River District. Additionally, the flawed assessment methods used in the district further expose the gaps and inaccuracies in public housing development. Instead of evaluating the distribution and impact of housing, these assessments focus solely on the quantity of construction starts and completions
The behaviour of the River District government also finds resonance in broader patterns of public rental housing (PRH) provision in local China. Research by Ying Cao and colleagues reveals that PRH supply is often misaligned with actual demand, influenced more by local fiscal autonomy and central–local power dynamics than by genuine housing needs.Footnote 64 Their findings suggest that local governments may meet nominal construction targets, thereby accessing subsidies, without ensuring that the housing is accessible or suitable.
The public housing provision practices of River District illustrate how certain localities in China exploit flaws in the policy process to ostensibly implement the policy while, in reality, they twist it to suit their immediate needs. The distorted housing policy enables access to subsidies from public sources and financing from private sources, addressing the fiscal gap but compromising long-term welfare. We classify this type of public housing as “extractive,” as it prioritizes immediate gains over sustainable well-being.
The Drivers of For-profit Welfare Housing Provision
The local governments of Trinity District and River District both implemented divergent strategies that leveraged welfare provision to generate local financial gains. The Trinity District government exhibited entrepreneurial behaviour by investing welfare resources to create a business-friendly environment in anticipation of economic and fiscal gains in the future. In contrast, the River District government acted as an extractor, prioritizing short-term gains over long-term benefits by exploiting public housing provision to earn “quick cash.”
Such fiscally oriented public housing provision is not a scenario peculiar to these two districts. For example, in 2016, Haidian District 海淀区 in Beijing allowed high-tech start-ups to rent public housing at a discounted price, and several local governments offer welfare housing benefits directly to talented professionals. For instance, Shenzhen municipality announced it would build 350,000 public housing units during the city’s 13th Five-Year Plan period (2016–2020), of which 280,000 would be set aside to attract and retain talented professionals, leaving only 20 per cent to meet the basic housing needs of low-income groups, as mandated by the central government. Moreover, many local governments become extractive welfare providers, prioritizing short-term gains over long-term benefits. A report issued in the 2010s by the National People’s Congress Standing Committee pointed out that “Local governments disregard the reality and overstate their construction projects in an attempt to obtain subsidies from the central government” and that this was a “serious issue” for public housing provision in China.Footnote 65 The National Audit Office’s 2015 findings uncovered a staggering number of unassigned public housing units – 57,500 units, to be exact – in five provinces.Footnote 66 It is important to note that these figures are not the result of a comprehensive nationwide survey but rather a random audit inspection. This implies that the problem of unassigned public housing units in China may be much more severe than previously acknowledged.
We posit that local fiscal pressure plays a pivotal role in shaping the policy direction of local governments, affecting their choice of welfare provision model. As suggested by Youqin Huang’s work, fiscal constraints and a performance evaluation system skewed towards hard economic targets underlie the lack of commitment to conventional low-income housing.Footnote 67 This points to a direct causal pathway where fiscal exigencies compel local states to devise housing solutions that are fiscally sustainable or even beneficial to them.
Fiscal self-sufficiency serves as a measure of a government’s fiscal pressure. It indicates the ratio of local governments’ budgetary revenue to their budgetary expenditure, signifying the local government’s ability to maintain a budget balance. In general, a higher fiscal self-sufficiency rate reflects a lower level of fiscal pressure. However, the self-sufficiency rate of Chinese local governments dropped from 61.8 per cent in 2000 to 52.7 per cent in 2017, reaching its lowest point at 52.9 per cent in 2009. This demonstrates the pervasive and severe fiscal pressure faced by local governments in China.
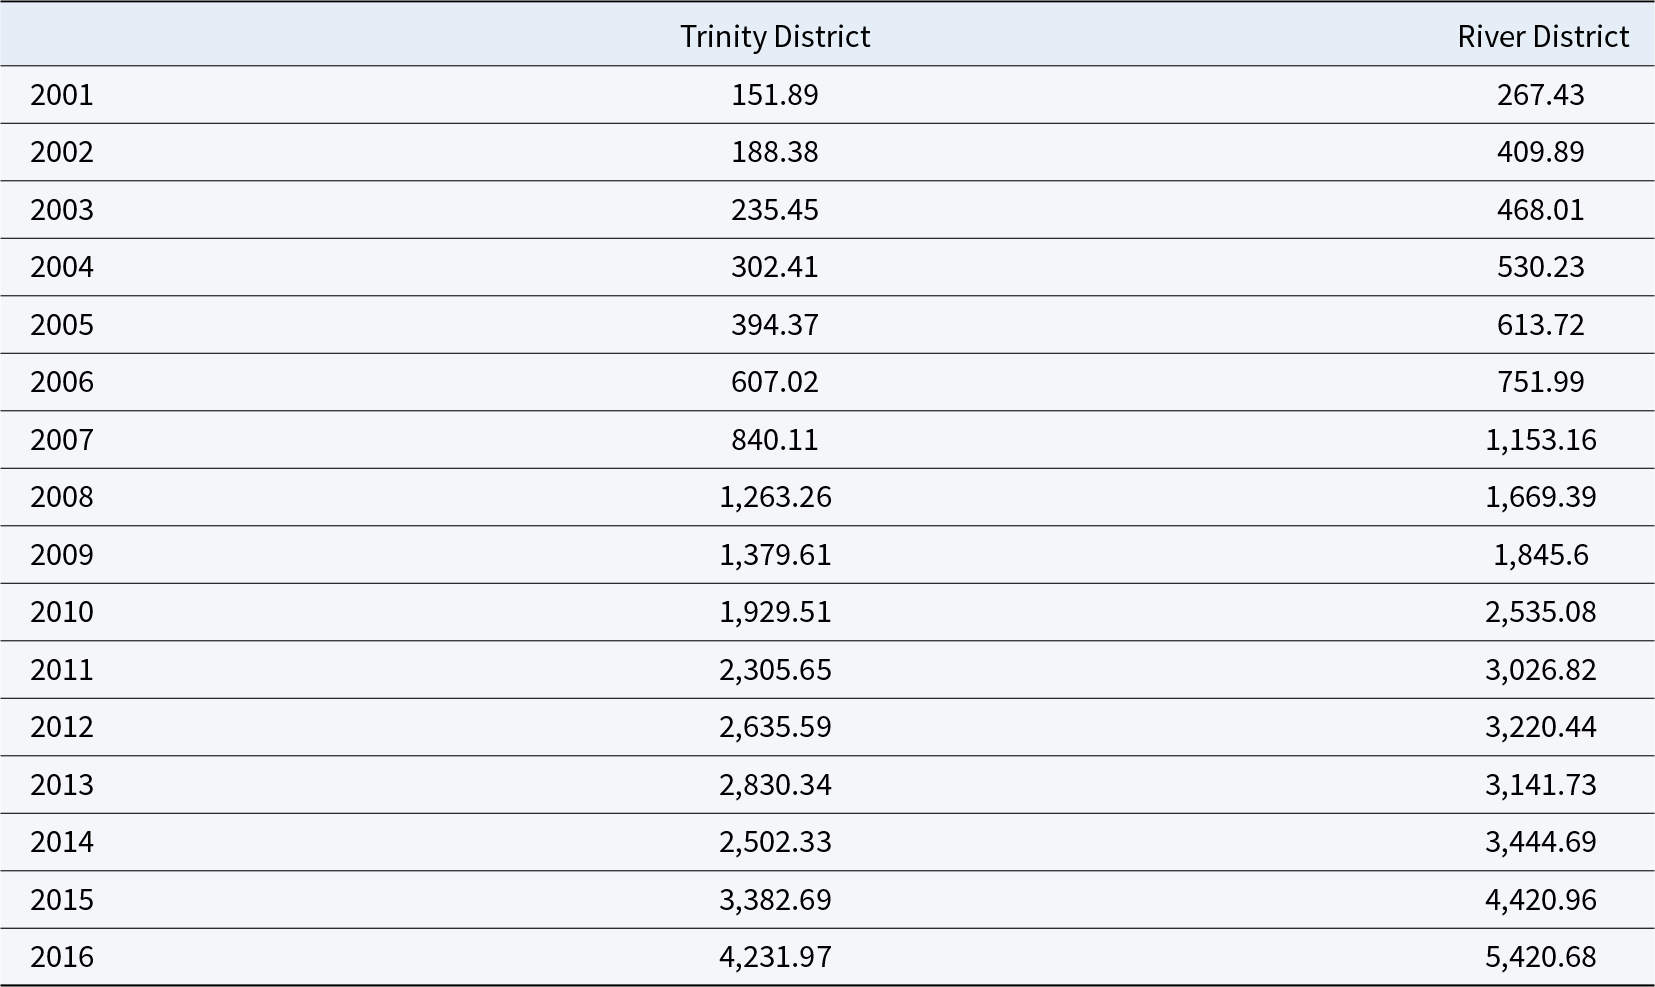
Faced with varying degrees of fiscal pressure, local governments adopt diverse approaches to alleviate this burden. The cases of Trinity District and River District illustrate how the pressure can be relieved through a welfare provision programme. Table 2 displays the scale of fiscal deficit in both districts from 2001 to 2016, revealing a persistent issue of imbalanced revenue and expenditure in both areas since the beginning of the 21st century. Moreover, despite a common upward trend in fiscal deficits, the scale of the deficit differs significantly between the two districts. Specifically, River District consistently experienced higher deficits than Trinity District over the 16 years. On average, River District’s deficits were 46 per cent greater than those of Trinity District during this period.
Fiscal Deficits in Trinity District and River District, 2001–2016 (million yuan)

Table 2 Long description
Annual fiscal deficits are listed for Trinity District and River District from 2001 through 2016, in million yuan. River District records a larger deficit than Trinity District in every year shown. Both districts generally trend upward over time, with Trinity increasing from 151.89 in 2001 to 4,231.97 in 2016 and River increasing from 267.43 to 5,420.68. Growth accelerates after the mid-2000s, with notable jumps around 2007 to 2008 in both districts. River District rises from 1,153.16 in 2007 to 1,669.39 in 2008, while Trinity rises from 840.11 to 1,263.26. There are brief slowdowns or dips, including River edging down from 3,220.44 in 2012 to 3,141.73 in 2013 and Trinity dropping from 2,830.34 in 2013 to 2,502.33 in 2014. By 2016, the gap remains substantial, with River about 1,188.71 million yuan higher than Trinity. Values are presented as deficits and should be interpreted as reported amounts for each year rather than as causes or policy impacts.
Source: Author’s calculation from Chongqing Municipal Bureau of Statistics Reference Cao, Daichun, Huang and Zhu2002–2018.
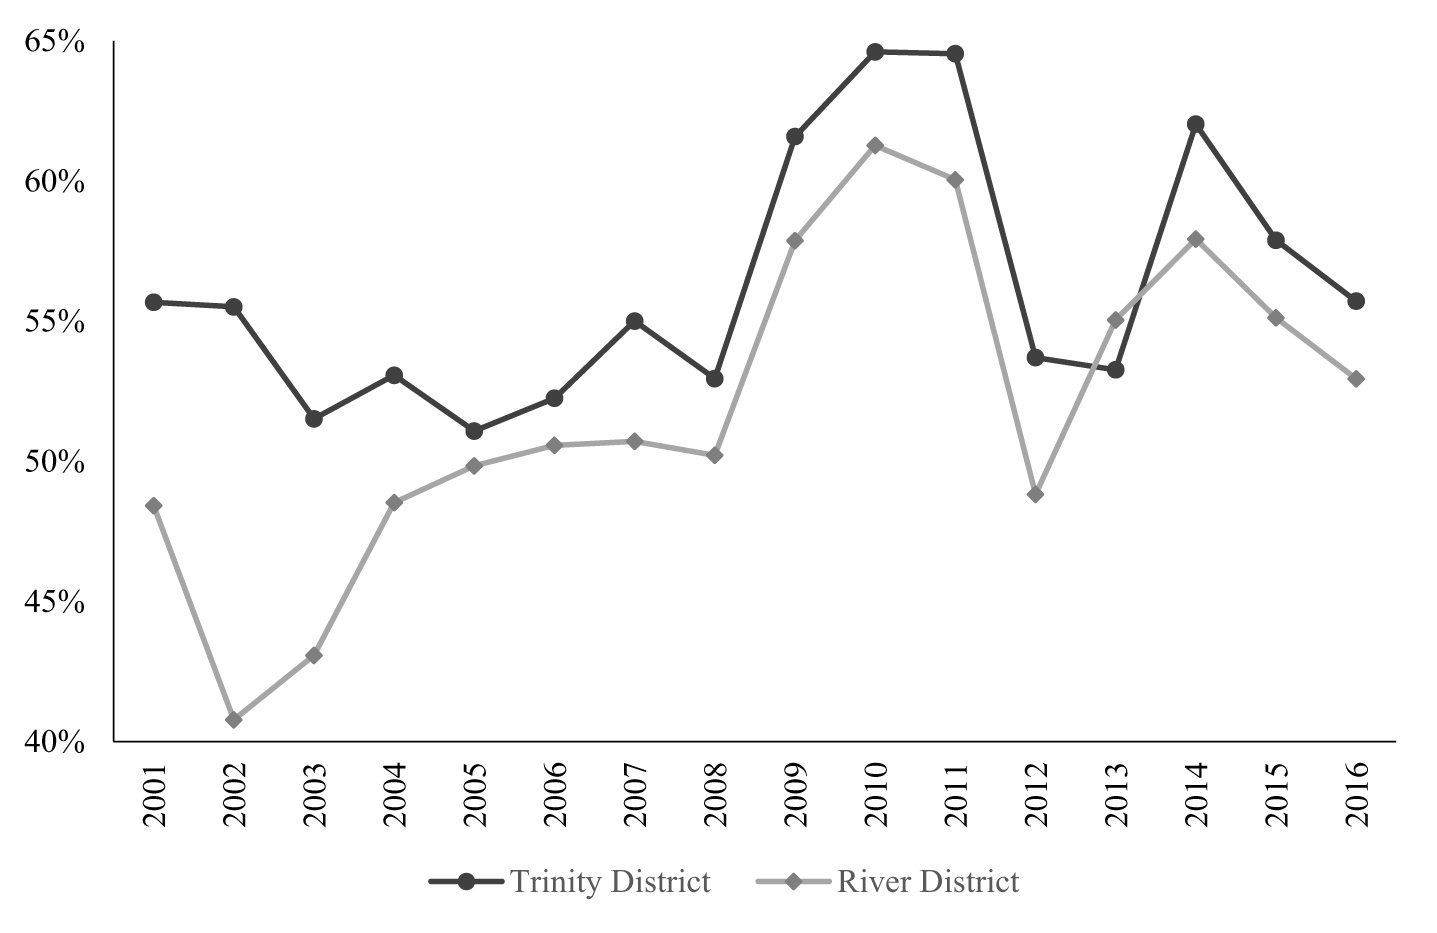
Looking at fiscal pressure from another perspective, Figure 3 further compares the fiscal self-sufficiency rate of the two districts. From 2001 to 2016, Trinity District maintained a higher rate of fiscal self-sufficiency than River District in general. This difference was particularly salient before 2010, with some narrowing of the gap in later years. In addition, when comparing the fiscal self-sufficiency rate of the two districts with the national average, Trinity District’s rate is generally higher than the national average (53 per cent), while River District’s rate is significantly lower. These two sets of data demonstrate clearly that Trinity District experienced a much lower level of fiscal pressure than River District.
Fiscal Self-sufficiency Rates for Trinity District and River District, 2001–2016

Two types of welfare provision emerged in response to very different fiscal pressures. With lower fiscal pressure, Trinity District opted to generate constant financial returns. Guided by local industrial policies, the Trinity District government created a business-friendly environment by offering public housing to enterprises for use as dormitories, a strategy that can yield financial rewards. To ensure efficient repayment of the government’s investment in the welfare system, public housing benefits are selectively allocated to groups that contribute, or are expected to contribute, the most in terms of tax revenue, such as the employees of high-growth-potential companies. In essence, the entrepreneurial model tailors welfare resources to attract investment, thereby stimulating local GDP growth and increasing tax revenue.
In contrast, faced with greater fiscal pressure, the River District government seized the opportunity to develop public housing in order to quickly meet the shortfall in local finances. First, it maximized subsidies from higher levels of government by capitalizing on social welfare provision. For instance, at the initiation of the welfare housing programme, the district government proposed an ambitious housing plan to secure greater “programme-specific subsidies” from the central and provincial governments. Second, the local government aimed to minimize its welfare expenditure. It opted for a specific type of public housing that did not align with local housing needs, as it was less expensive to build but attracted more subsidies. Third, in addition to exploiting internal opportunities for generating income, the government sought external financial support. It took the risk of mortgaging the property rights of public housing units to banks to secure loans.Footnote 68
The different levels of local fiscal pressure have not only driven the creation of for-profit welfare provision but have also determined the choice of for-profit welfare provision strategy. As many have suggested, without electoral checks and balances, political career concerns remain the dominant, if not the only, factors that incentivize local officials to perform.Footnote 69 Therefore, the underlying driving force behind such a rational action lies in the “target responsibility system” (TRS), a general personnel control system that allows upper-level governments to manage their subordinates.Footnote 70 The TRS acts as a powerful mechanism for managing local officials, prompting them to align their local policy initiatives with doctrines and priorities set by higher tiers of government. These political doctrines and priorities effectively function as the terms of an implicit yet binding political contract.Footnote 71 The key terms of this contract are determined by top national priorities, which usually include poverty alleviation, economic performance, social stability and environmental protection, followed by provincial and municipal priorities.
However, the increasing investment in social welfare and counterintuitive welfare strategies at the local level cannot be solely attributed to the local government’s concern for social stability, which is a widely accepted explanation in the existing literature.Footnote 72 We argue that the pursuit of economic development and revenue generation, which are key metrics for promotion, is the primary motivator behind local governments’ enthusiasm for and distinctive approaches to for-profit welfare policies. Under China’s local government and cadre assessment system, economic and fiscal performance remains the most critical indicator, despite the central government’s emphasis on fostering more “inclusive growth” (baorong zengzhang 包容增长) to build a harmonious and well-off society and enhance rural–urban integration. In our assessment of Trinity District government and River District government, among the seven major items for cadre performance evaluation, revenue generation and economic growth accounted for 21 per cent and 18 per cent, followed by environmental protection (15 per cent), urban–rural construction (14 per cent), scientific-educational-cultural-health development (13 per cent), open cooperation (11 per cent) and employment (8 per cent).Footnote 73 This is consistent with Huang’s discussion of social welfare as constituting “soft” targets, which are difficult to measure and achieve compared to “hard” economic targets.Footnote 74 As social welfare indicators hold no veto power, it is unsurprising that the two districts exploited every possible opportunity presented by the loopholes and flaws in the assessment of public housing projects to maximize their fiscal revenue, by either misallocating housing to enterprises or crafting grand, impossible plans for the wrong kind of housing. Moreover, given their similar socio-economic conditions and political pressures from above and below, the only major difference between the sub-municipal jurisdictions is local fiscal pressure, which eventually engendered different approaches to welfare development for profit-making.
Conclusion and Discussion
It is commonly perceived that public services are viewed as a social expenditure that does not take economic returns into account. However, we find that some local governments in China, operating under significant institutional pressures, do not treat welfare provision as a pure social expenditure. Instead, they instrumentalize it, devising distinct fiscally oriented models to serve local economic and fiscal mandates. Through a controlled comparison of two districts within the same municipality, this paper has identified and theorized two such models: an entrepreneurial model, which leverages AH to attract industrial investment and cultivate a future tax base, and an extractive model, which repurposes AH projects to secure immediate funds and alleviate pressing fiscal burdens. These findings challenge conventional understandings of welfare state development and offer a new framework for analysing subnational governance in a non-Western context.
Our analysis makes three interconnected contributions to the literature. First, we develop a novel analytical typology – the entrepreneurial versus the extractive model – that moves beyond monolithic, national-level explanations of Chinese welfare. This framework reveals that “welfare” at the local level is not a uniform category but a malleable instrument strategically shaped by state actors to pursue divergent, and often competing, objectives. Second, we reframe the understanding of local policy implementation. Where much of the literature characterizes local deviation from central mandates as “shirking,” “selective implementation” or outright failure, our evidence points to a more proactive and rational dynamic of strategic repurposing. Local governments are not simply failing to implement policy; they are actively reorienting it to align with their most pressing local imperatives. Third, we identify the degree of local fiscal pressure as the key causal mechanism driving this strategic divergence. The intensity of a government’s fiscal distress directly shapes its time horizon and strategic calculus, compelling it towards either long-term investment or short-term extraction.
While local governments under fiscal pressure likely employ a portfolio of strategies to generate revenue, AH policy presents a uniquely attractive vehicle for these endeavours for several reasons. First, AH programmes involve large-scale capital construction, creating significant physical assets. These housing units can then be used as collateral, allowing local government financing platforms to secure bank loans that would otherwise be inaccessible. Second, AH is often tied to dedicated “programme-specific” subsidies from higher levels of government, creating a direct opportunity to extract funds by proposing ambitious, and sometimes inflated, construction plans. Third, the performance metrics for welfare provision are often considered “soft” targets compared to “hard” economic indicators. Officials are frequently evaluated on easily quantifiable outputs, such as the number of units under construction, rather than on complex social outcomes like whether the housing actually serves the needy. This creates implementation gaps that local leaders can strategically navigate to meet their more pressing fiscal and economic mandates.
The emergence of these fiscally oriented welfare models carries significant implications for the future of social equity and governance in China. The manipulation of welfare provision for government revenue maximization poses significant risks to equitable and sustainable welfare development. While any large-scale housing construction can be argued to have ancillary economic benefits, such as job creation or supporting industrial growth, the fiscally oriented models we identify tend to sideline the primary social objectives of AH. Consequently, resources are diverted from the most vulnerable populations, potentially deepening social inequalities and leading to unsustainable welfare infrastructures. This dynamic, where the economic functions of welfare can overshadow its social mission, resonates with historical and global patterns of public investment but requires critical assessment, particularly within China’s unique institutional context of intense fiscal pressure and potent top-down performance management.
The logic, the rationale and the operation of fiscally oriented welfare provision are not exclusive to China. Historically, Western nations have also employed ambitious public housing initiatives as a means to stimulate investment and foster economic growth, particularly during periods of crisis. Franklin Roosevelt’s New Deal housing programmes in the United States and the British government’s revival of social housing construction after the 2008 financial crisis serve as prominent examples. The entrepreneurial and extractive mindset behind the welfare state has become a pervasive phenomenon in both Western and non-Western countries and requires more in-depth comparative analysis.
Lastly, this research is not without limitations. The first is data accuracy. Given the fragmented data provided by different local departments, we believe that the data we analysed are very close to the truth. However, the validity of our arguments should be cross- and double-checked when more data become available. Second, considering the vast landscape of China’s local governments, although we identified the illustrative cases of public welfare housing, the extent to which we can claim the formation of a fiscally oriented welfare state can still be questioned. The fiscal orientation logics are hypothesized to be relevant across a broader range of Chinese localities, although their specific manifestations may vary. When more district-level and project-level data are available, further research could quantitatively examine the impacts of the ongoing welfare housing provision. Third, we need to acknowledge that our arguments regarding fiscally oriented welfare provision have limited relevance across different policy areas. Such a policy as welfare housing, which has been leveraged for increasing local fiscal revenues, is rarely found in other policy domains. Exceptions occur where land and real estate are involved and operated by local government financing platforms in areas such as education, elder care and anti-poverty initiatives. Tracking the evolution of these practices is crucial for understanding the long-term trajectory of the Chinese welfare state and its capacity to balance economic development with social equity.
Acknowledgements
We are grateful to the editor and anonymous reviewers for their valuable comments on this paper. Funding for this research was provided by Chongqing Social Science Planning Fund (No. 2022NDQN06), National Social Science Fund of China (No. 24CDJ054), Chongqing Social Science Planning Fund (No. 2022NDQN06), Chongqing Municipal Education Commission Humanities and Social Sciences Fund (No. 25SKJD016) and Fundamental Research Funds for the Central Universities (No. 2025CDJSKDPT10).
Competing interests
None.
Ge XIN is a chair associate professor at the School of Public Administration and Policy of Shanghai University of Finance and Economics. He holds a PhD in politics and public administration from the University of Hong Kong. His research focuses on state–society relations, local governance and public and nonprofit management.
Hanyu CHEN is an associate professor at the School of Marxism, Chongqing University. He holds a PhD in politics and public administration from the University of Hong Kong. His research focuses on Party-building, social welfare and local governance.