Introduction
In-work poverty is rising in the UK. A recent study finds that the risk of in-work poverty has increased by more than 20 per cent since 2004/5 and that as many as six in ten people experiencing poverty in the UK were living in households where someone was in work in 2014/15 (Hick and Lanau, Reference Hick and Lanau2017). This rise in in-work poverty is significant for many reasons, one of which is that the UK has, in international terms, one of the most extensive systems of in-work supports via the tax credit system (e.g. Kenworthy, Reference Kenworthy2015). Tax credits provide a means-tested supplement to the incomes of families in work or with children, and the rise in in-work poverty has led to questions about the efficacy of tax credits in tackling working poverty.
This article examines the relationship between tax credits, social security more broadly and in-work poverty, and explores how this has changed over time. To do this, we present an analysis of (i) the income packages of working families and (ii) the performance of tax credits in relation to anti-poverty objectives, drawing on data from the Households Below Average Income survey between 2004/5 and 2014/15. We do so not only in relation to tax credits but also seek to understand these in relation to social security more broadly, exploring how these payments, jointly, help (or do not help) to lift working households from poverty.
We examine the performance of tax credits and social security over the past decade, yet we are acutely aware that the social security system is undergoing dramatic change (Dwyer and Wright, Reference Dwyer and Wright2014). The amalgamation of six benefits, including Working and Child Tax Credit, into Universal Credit is ongoing and numerous social security cuts have been pre-announced and will be implemented until (at least) the end of the decade (Millar and Bennett, Reference Millar and Bennett2017). In short, the future looks quite different from the recent past. Nonetheless, in-work poverty has risen over the past decade, and in this article we seek to identify some lessons from the last decade in order to inform thinking about tackling in-work poverty going forward.
The article is made up of five sections. In the next section, we provide a brief sketch of how in-work supports have evolved and explain how they function. Sections 2 and 3 present the research design and methodology, and information about the data, respectively. Section 4 presents our analysis, which is organised into three sub-sections, composed of our two methodological approaches and decomposition of results by selected household types. The conclusion summarises the key findings.
The evolution of tax credits in the UK
While tax credits are often associated with the New Labour administrations, their origins can be traced back to the Family Income Supplement, introduced by a Conservative government in 1971, which provided support for low income working families where at least one person worked twenty-four hours per week (Dilnot and McCrae, Reference Dilnot and McCrae1999). Subsequent reform under the Thatcher government reduced the minimum hours of work to sixteen and renamed the scheme Family Credit, which, in turn, became Working Families Tax Credit in 1999 under New Labour. As Brewer and Browne (Reference Brewer and Browne2006) note, the introduction of Working Families Tax Credit was not simply a re-branding of Family Credit – rather, the scheme became considerably more generous, by increasing the amounts people could receive, increasing the amount they could earn before any withdrawal occurred, and reducing the taper rate, so that people could keep more of their credit as earned income increased.
A second major reform of tax credits occurred in 2003, which divided Working Families Tax Credit into two payments, Child Tax Credit (CTC) and Working Tax Credit (WTC). Child Tax Credit was created by amalgamating: the child elements of the Working Families Tax Credit, the Children's Tax Credit, as well as child allowances and family premiums for out-of-work payments, Income Support and Jobseeker's Allowance (Brewer, Reference Brewer2003). Child Tax Credit is made up of a family element (one per eligible family) and a child element (one per child). The family element was paid in full to people earning up to £50,000; the more generous per-child elements only to families at much lower levels of income (Brewer, Reference Brewer2003).
Working Tax Credit then replaced the remaining portions of Working Families Tax Credit with the Disabled Person's Tax Credit. Entitlement was extended to those without children (and who were not disabled) though, as we see below, the coverage of WTC for childless families remained low. The expectation following the 2003 reforms was that CTC would rise in line with earnings, while WTC would increase with prices (Cracknell, Reference Cracknell2004: 5). In practice, the 2003 reforms left tax credits with a complex mix of sub-components, which were not always uprated in so uniform a fashion (for example, the family element of CTC has been frozen in cash terms since 2004/5, whereas the child element of CTC rose in excess of earnings in April 2004 and 2008 and with earnings in other years (Cracknell, Reference Cracknell2007)). On this basis, then, one might expect the evolution of Child Tax Credit to be more generous than Working Tax Credit. Tax credits were a central component of New Labour's attempts to ‘make work pay’ and to eliminate child poverty.
The Coalition government, which came to power in 2010, lamented the growing expense, in aggregate terms, of tax credits, and sought to focus ‘tax credits on lower income families’ (HM Treasury, 2010: 34). Many significant cuts were implemented to tax credits, including the withdrawal of the family element of CTC, which had previously extended to those with incomes of £50,000, a change to the taper rate which meant that tax credits were withdrawn more quickly as earnings rose, an increase in the minimum hours required to gain entitlement for WTC from sixteen to twenty-four, changing the indexation of tax credits from the RPI index to the less generous CPI index, and outright freezes in WTC from 2011–12 to 2013–14 (Cracknell, Reference Cracknell2010: 8; Hills, Reference Hills2015: 17). One justification offered for cutting tax credits was their apparent lack of effectiveness in reducing in-work poverty (HM Treasury, 2010: 31), a claim we examine in this article.
Research design and methods
The analytic approach adopted in this article is to combine analysis of (1) the income packages of working households with that of (2) the performance of tax credits, and social security more broadly, in relation to anti-poverty objectives. The income package framework is typically composed of three measures – the coverage of a given payment, the amounts received by recipients, and the share that these amounts represent in total household income (e.g. Bradshaw and Finch, Reference Bradshaw and Finch2002; Maître et al., Reference Maître, Nolan and Whelan2005; Skinner and Main, Reference Skinner and Main2013). These statistics can be used to explore the balance of income from work and social security (e.g. Rainwater, Reference Rainwater1995) – in this case in relation to working families.
However, the income package framework cannot straightforwardly be used to draw inferences about the relationship between social security and poverty, and previous research has found that nations with a similar composition of their income packages between work and social security may display sharply diverging poverty rates (Hobson, Reference Hobson and Sainsbury1994). This leads us to draw on a second framework that examines the performance of tax credits in relation to anti-poverty objectives. Again, this framework has three key measures – the effectiveness, potential and efficiency of specific payments in reducing poverty. Poverty reduction effectiveness is intended to reflect the extent to which social security reduces the poverty gap. It is possible to compare effectiveness across different types of social security payment (Sainsbury and Morissens, Reference Sainsbury and Morissens2002) or to analyse the extent to which earnings or social security help to lift families from poverty (Gardiner and Millar, Reference Gardiner and Millar2006).
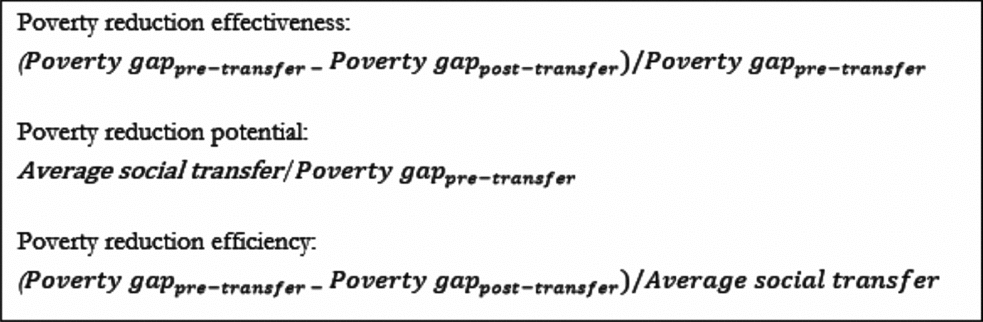
Our analysis also draws on two lesser-utilised measures of social security performance – namely, poverty reduction potential and poverty reduction efficiency (Watson and Maître, Reference Watson and Maître2013: ix). Poverty reduction potential relates to the ‘aggregate spend on social transfers expressed as a ratio to the aggregate market income poverty gap’ (ibid) and measures the extent to which the level of spending on particular payments, if fully targeted, would be sufficient to reduce poverty. Poverty reduction efficiency refers to ‘the proportion of social transfers that contribute to reducing the market income poverty gap’ (ibid) and thus focuses on the extent of anti-poverty targeting of social transfers. Figure 1 presents how these measures have been constructed.
The construction of the social security performance measures

It must be acknowledged that the effectiveness, potential and efficiency of poverty reduction relate only to one of the key goals of social security – namely, to reduce poverty. They do not take into consideration other important goals of social security, such as sharing with families the cost of rearing children, investing in children in order to generate future social and economic returns, or incentivising employment (Barr, Reference Barr2012). Moreover, while the goals of social security can be stated in the abstract, particular administrations may place little or even no weight on some of these goals. Irrespective of the weight placed on the goal on anti-poverty objectives by any particular administration, however, we believe there is value in examining the relationship between social security change and poverty – indeed, this is perhaps of particular importance when this has not been a central focus of government.
Before proceeding, we must note one issue relating to the method of constructing poverty reduction effectiveness adopted in this article: in the standard methodology which examines effectiveness for all transfers, social transfers are deducted from net post-transfer income, and then this pre-transfer income measure is compared vis-à-vis the post-transfer poverty line to examine the change in the poverty gap (or headcount). In this article, when we focus on a particular payment, we deduct only this specific payment from net, post-transfer income. For example, we compare post-transfer income pre-Child Tax Credit with the poverty rate post-all transfers in order to examine the effectiveness of Child Tax Credit. Analysis of this kind leads to a sequencing problem, since it also matters what is counted before CTC is considered. In this way, the effectiveness of a particular payment is dependent not only on the generosity of the payment relative to the poverty line but also the distance to the poverty line before the payment is considered. This limitation affects all studies using this method, and is the cost one must accept to avail oneself of the advantages of this framework in assessing social security performance. In our analysis, we assume all other transfers – and other income sources – remain the same, both pre- and post-payment. An alternative approach, utilising microsimulation, would have allowed for an interaction between social security benefits, and thus for other income sources to adjust when a particular payment was removed (e.g. in the calculation of net income pre-Child Tax Credit). However, the value-added of such an approach depends crucially on the assumptions made about the take-up of various payments, and these can be challenging to identify accurately. We prefer here to maximise what can be learned from the analysis of information on actual benefit receipt.
Data and method
The analysis in this article draws on data from the Households Below Average Income/Family Resources Survey. The HBAI/FRS is the primary UK survey for analysing social security and poverty. Our focus in this article is on the period 2004/5 to 2014/15; that is, from the implementation of the 2003 tax credit reforms to the most recent period. The unit of analysis in this article is the household, and we use the terms ‘household’ and ‘families’ interchangeably. We exclude pensioner households from the analysis and, where indicated, analysis is restricted to households where at least one member is in paid employment.
Measuring in-work poverty requires us to define ‘work’ and ‘poverty’, respectively. The measure of work is where at least one working-age adult in the household has spent at least one hour in paid employment in the week preceding the survey (i.e. the ILO definition of employment). While this appears to utilise a different threshold in relation to hours worked than are contained in tax credit rules, it is important to bear in mind that, post-2003, there is no condition relating to hours worked for Child Tax Credit, which, as we show below, is the more significant of the two tax credits. Our measure of poverty is based on a relative income threshold set at 60 per cent of median equivalised income, after housing costs. An equivalence scale is used to adjust total household income to account for economies of scale in larger households and to enable comparisons in the standard of living of different household types.
This has been the standard definition of in-work poverty in UK studies but it differs from the official EU definition on two grounds: first, the European definition applies a more restrictive measure of ‘working’, which focuses only on circumstances where a person is in employment for seven or more months per year; and secondly, European studies typically count only workers as experiencing in-work poverty rather than all household members (e.g. Crettaz, Reference Crettaz2011; Eurofound, 2017)
This focus on all (working-age) individuals in the household has at least one significant advantage over the standard European approach: if we only count workers in the definition of in-work poverty, then the employment and income variables will be measured using different units of analysis, since the income variable (and thus the poverty status) considers all income sources in the household and thus, implicitly, all individuals, while the employment variable focuses on workers only. In our view, the exclusive focus on workers frustrates understanding in-work poverty as a problem requiring a ‘whole household’ solution and risks the common, if erroneous, conflation between in-work poverty and low pay (see Hick and Lanau, Reference Hick and Lanau2017: 5–10 for a discussion).
Examining social security performance typically relies on the analysis of net income components. One challenge for the present analysis is that in the HBAI dataset there is no measure of net (i.e. after tax) social security income and no net values for the social security components that make up net household income. But in the UK some payments are taxed, so we are not straightforwardly able to compute effectiveness in the usual way, since we cannot deduct net social security income from net household income to measure effectiveness. We are left with three potential solutions, none of them ideal:
1. Conduct the analysis in relation to gross income only;
2. Analyse only non-taxed social security payments (so that the gross and net amounts are equivalent, thus no error is introduced);
3. Assume all social security payments are net amounts (even though we know for some payments this assumption in not true).
Option 1 is, in our view, not favourable. Poverty comparisons are made using disposable income, and there is good reason for this: as Brady (Reference Brady2009: 40) reminds us, ‘people live in a posttax and posttransfer world’. However, some forms of social security are taxable and the data do not contain the net elements of these payments that contribute to net household income.
Thus, we have primarily adopted #2, but also include elements of #3. Specifically, we present analysis of Working Tax Credit, Child Tax Credit, Child Benefit and Housing Benefit, which are all untaxed and can be treated as net amounts. We analyse these benefits individually, and, jointly, labelling the amalgamated figures ‘four benefits’. We then also present data for all payments, but as #3 above indicates, we know the precise values will over-state the true impact of social security in reducing poverty (since we are treating some gross income values as if they were net amounts). While we cannot trust the precision of the figures for ‘all benefits’, this measure can still be useful in terms of giving us a sense of the direction of travel over time (e.g. if effectiveness for all payments is rising or falling). We believe this is the optimal solution to the data limitations that exist.
To reduce measurement error – known to affect the extremes of the income distribution in particular – the top and bottom 3 per cent of the income distribution were excluded from the analysis. Additionally, we also excluded cases with negative income. This results in a total loss of between 7 and 8 per cent of the sample for each year. All analyses are weighted using the household weight provided with HBAI. Finally, a note on terminology: for the purposes of this article we use the term “social security” to refer to all cash benefits, including tax credits, unless expressly stated otherwise.
Analysis
The analysis is divided into two parts: the first, an analysis of the income packages of working families; the second, an analysis of the performance of social security and tax credits for different groups.
A. Tax credits and the income packages of working households
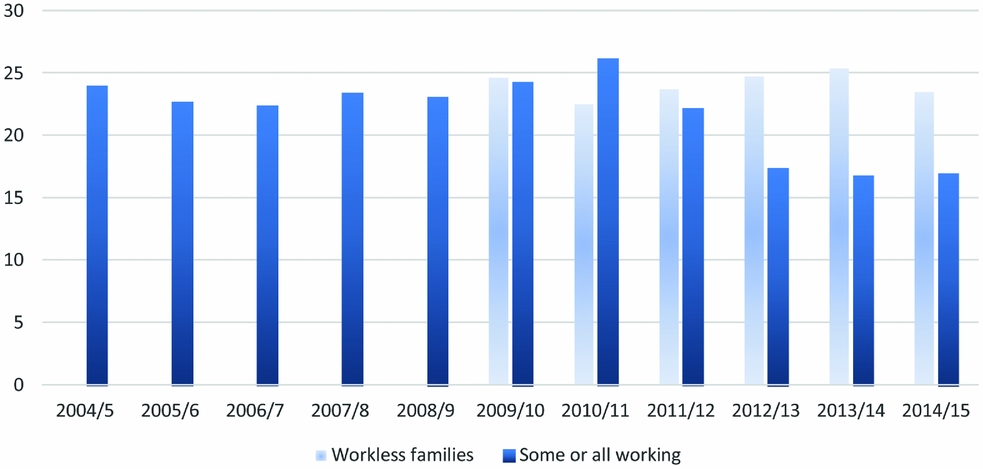
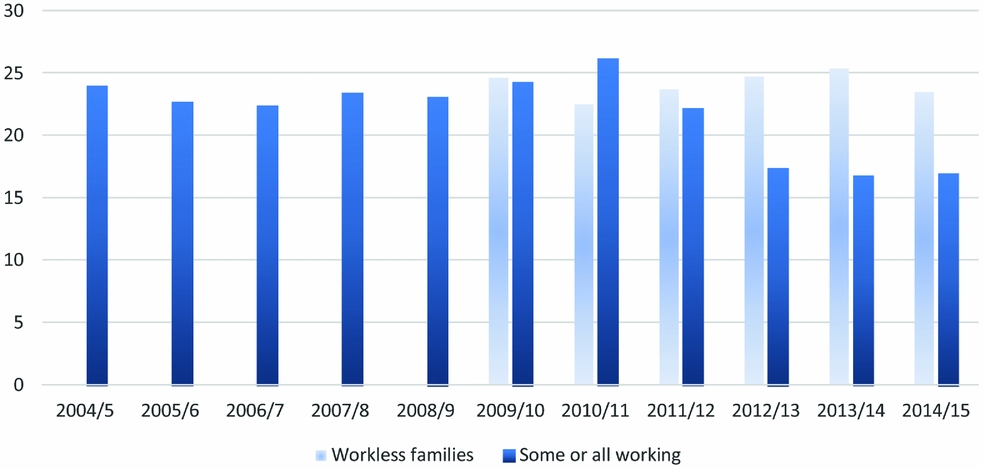
We begin by examining the coverage of tax credits over time for working families, comparing this in the first instance to recent trends for families who are out of work. Coverage here refers to actual receipt of tax credits and is thus a function of both eligibility and take-up. Figure 2 shows that tax credit coverage was reasonably stable for working families between 2004/5 and 2009/10; there was a modest spike in 2010/11, followed by a substantial fall, of almost ten percentage points, by 2014/15. In contrast, the probability of receipt for workless families has been reasonably stable since 2010/11.Footnote 1 Of course most tax credit recipients continue to live in working households because most households have someone who is in paid work (Hick and Lanau, Reference Hick and Lanau2017). Nonetheless, it is significant to note that, in the period after 2010/11, tax credit coverage for working families declined in a way that it did not for workless households and, by 2014/15, the probability of a workless family receiving tax credits was greater than that of a working family. These differences are partly explained by trends in take-up rates: the latest official data indicate that take-up of CTC for workless households is 98 per cent; in contrast, take up of CTC and WTC amongst working households is 80 per cent and 65 per cent, respectively (own calculation of figures from HMRC, 2016: 15, 18). Nonetheless, Figure 2 challenges one of the many misconceptions regarding tax credits – namely, that they are only received by families in work: indeed, their coverage amongst working families has been declining in a way that it has not amongst workless families.
Coverage of tax credits by household employment status (%)
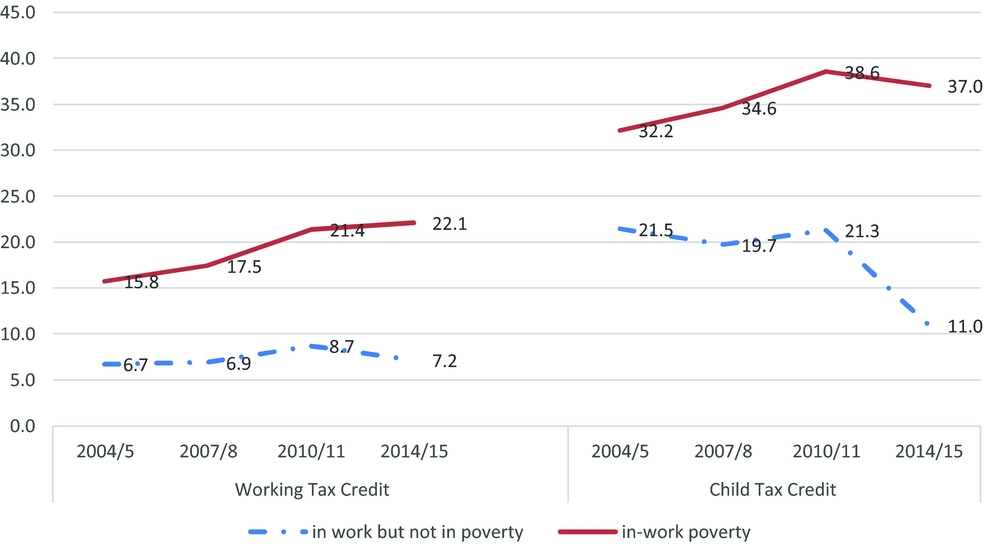
In Figure 3, we demonstrate coverage trends separately for Child and Working Tax Credit for working households, and disaggregated by poverty status. We find that in the period between 2004/5 and 2010/11, coverage for both Working Tax Credit and Child Tax Credit increased, especially amongst working poor households. In contrast, post-2010/11, changes in WTC coverage are modest, rising slightly for working poor households while falling for non-poor households, while coverage of Child Tax Credit falls sharply for non-poor households. It is worth emphasising that this fall in coverage post-2010/11 in relation to CTC cannot be explained with reference to changes in take-up of this payment, which increased modestly between 2010/11 and 2014/15 (HMRC, 2016: 19). Thus, in relation to CTC, this reduction in coverage represents an entitlement, or eligibility, effect rather than a take-up effect. Take-up of WTC also increased modestly between 2010/11 and 2014/15, so the observed increase in coverage for working poor households may be partly due to changes in take-up in this period.
Coverage of Working Tax Credit and Child Tax Credit by poverty status, working households only (%)
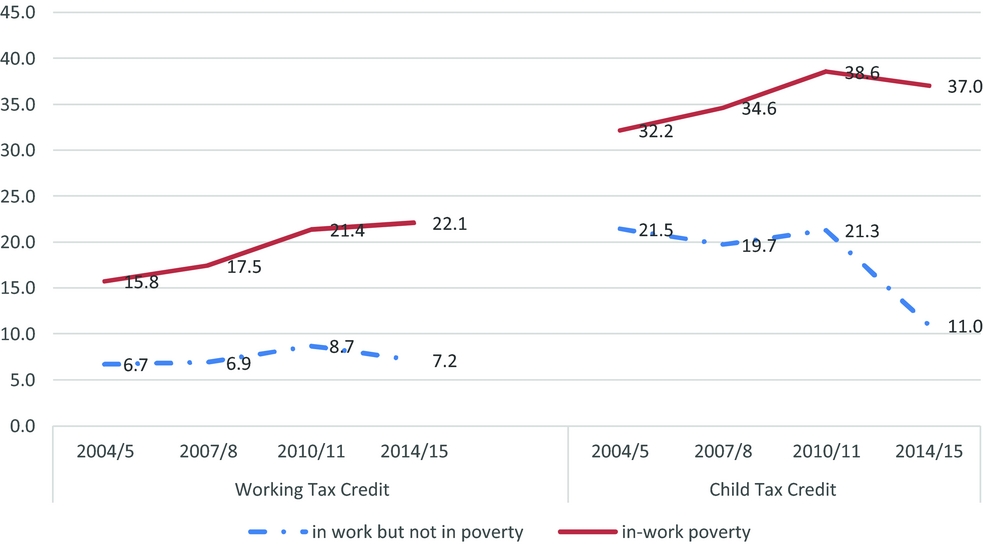
One may ask why tax credit coverage is so low – for working poor households especially. An important reason for this is that almost half of all working poor households do not have any children, and coverage of tax credits for such families is less than 10 per cent (own analysis). In contrast, at least 65 per cent of households with one child receive tax credits, and coverage rises as number of children increases. Thus, tax credit coverage, even amongst working poor households, is perhaps lower than many people imagine.
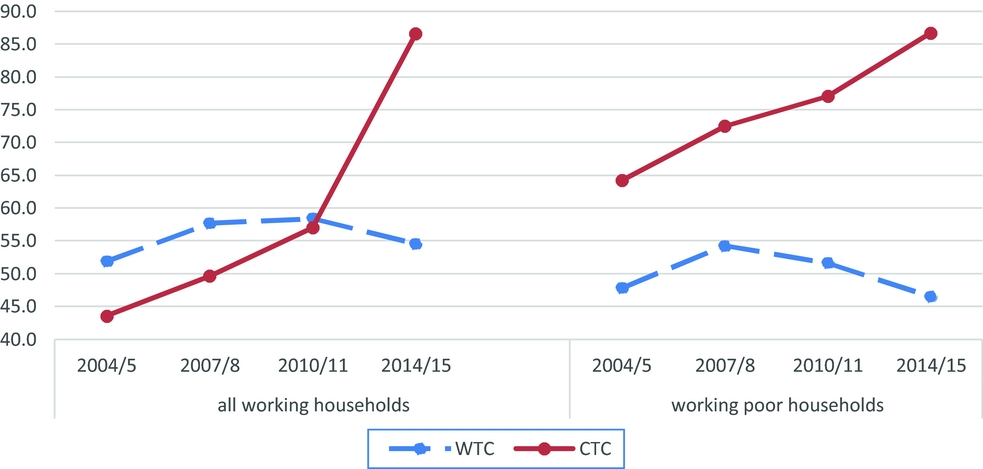
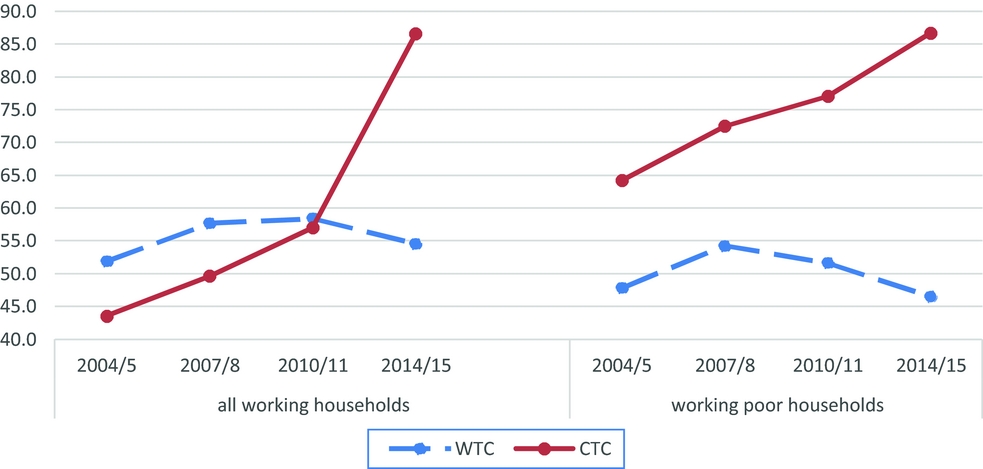
Turning to trends in average tax credit awards (Figure 4), we observe different trends for CTC and WTC post-2007/8, with CTC becoming more generous than WTC over time. The average WTC award has fallen for all working households in real terms since 2010/11 (and for working poor households since 2007/8). In contrast, average CTC awards have increased for all working households, most noticeably in the period since 2010/11, where the average award rose from £57/week in 2010/11 to £87/week in 2014/15 (at 2014/15 prices).Footnote 2 This is largely explained by withdrawing eligibility for CTC from higher earners, as Hills (Reference Hills2015) has also noted, though average claims for working poor households rose by ten pounds per week over the same period (from £77 to £87), which cannot, in our view, be explained by policy change (though, we must note, the median award for such households increased rather more modestly, by £2.50, over the same period).Footnote 3
Average WTC and CTC awards, all working households (left) and working poor households (right), £ per week in 2014/15 prices
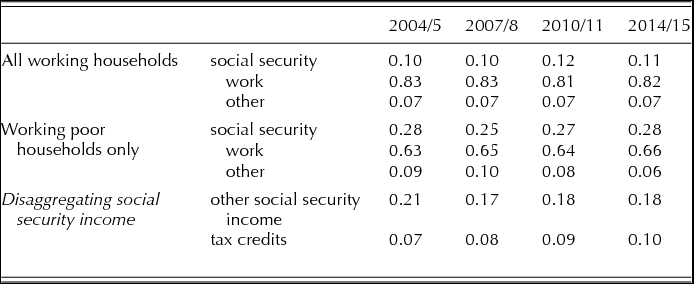
The final perspective in the income package framework is the share of total household income accounted for by specific payments. In order to see how tax credits relate to wider social security receipt, in Table 1 we examine the share of household income accounted for by social security; by tax credits in particular; and how this differs between all working households and working poor households. Because we examine all social security payments (and because gross amounts differ from net amounts for some payments; see above), we present share statistics for gross household income here.
Income shares by source, all working households and working poor households only

Source: HBAI, respective years
Working households obtain 80–85 per cent of their income from work, on average, either as wages or as income from self-employment. This income is supplemented by around 10 per cent from social security income, and 7 per cent from other sources; which includes occupational pension income of any retired household members, and any investment income. If we restrict our attention to working poor households, however, we observe quite a different balance in terms of income source. Working poor families obtain around two-thirds of their income from (self-)employment, on average, in the four periods considered here. Social security (including tax credits) accounts for between 25–30 per cent of a working poor household's income – more than two and a half times the average rate for all working households. Thus, social security income represents an important component of working poor households’ incomes. Indeed, Hick and Lanau (Reference Hick and Lanau2018) find that four in ten exits from in-work poverty co-occur with a rise in social security income of more than 20 per cent.
Lest we assume that this social security income is all in the form of tax credits, we can decompose this by tax credits and other social security income. The final panel presents this decomposition in the four periods in question, and demonstrates that tax credits account for between one-quarter to one-third of social security receipt in each period. It is important that this is borne in mind when constructing policies that tackle in-work poverty.
While differences by income source are starker than the extent of change over time, some changes may be noted in relation to the latter, too. While the income shares contributed by social security, work and other income remained constant for all working households between 2004/5 and 2007/8, income from (self-)employment grew faster than social security income for working poor households. This situation was reversed between 2007/8 and 2010/11, with social security income growing faster than earnings. In the final period, between 2010/11 and 2014/15, social security income continues to rise as a share of household income, but only for working poor households, not for all working households. Across the three periods, tax credits account for a rising share of social security income.
Overall, tax credits play a more limited role in the income packages of working poor families than might be assumed. This is because less than half of households experiencing working poverty receive tax credits, while three-quarters of this group receive other forms of social security. A clear difference, again, relates to family composition. More than two-thirds of households with children who experience working poverty receive tax credits – in contrast, just 10 per cent of households without children do so. This is partly an entitlement effect, but also one of take-up: official estimates suggest that take-up of WTC amongst entitled persons without children is just one-third (HMRC, 2016: 18), with more than a million entitled persons not claiming Working Tax Credit.
The detailed information on social security in HBAI allows us to explore in greater depth the make-up of the remaining social security income. Another one-third of total social security income of working poor households is made up of Housing Benefit and Child Benefit. The importance of Housing Benefit for working poor households has been increasing, from a 3 per cent share of household income in 2004/5 to a 6 per cent share in 2014/15 of the incomes of working poor households. The remaining one-third is a combination of other payments, including Employment and Support Allowance and JobSeeker's Allowance. These findings matter because, in policy terms, they highlight the extent to which cuts to working-age payments, including to out-of-work payments (or to the out-of-work elements of Universal Credit), will impact on households experiencing in-work poverty. There is thus greater interdependence between out-of-work payments and in-work poverty than is perhaps often assumed.
B. The performance of social security in reducing poverty amongst working families
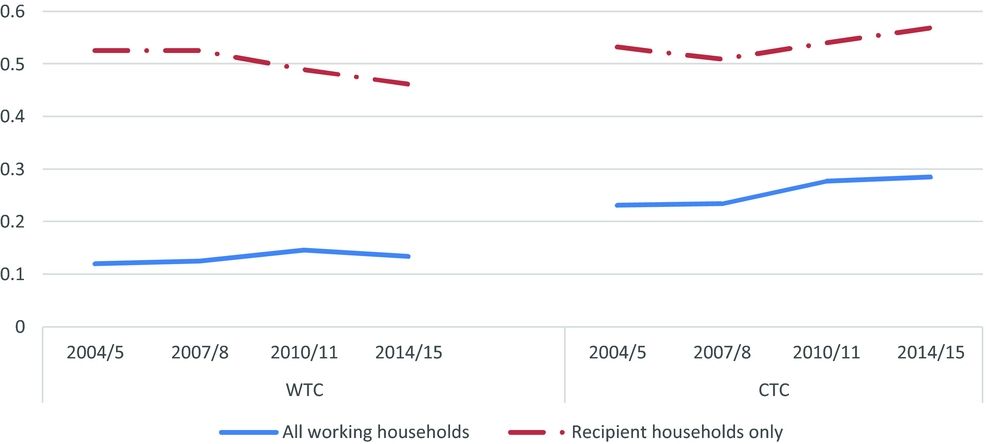
We have seen above the trends in coverage, amounts and shares of tax credits and other forms of social security. But what do these changes mean in terms of the reduction of poverty? As noted above, poverty reduction effectiveness reflects to what extent social security payments succeed in reducing the pre-transfer poverty gap, expressed as the proportion of this pre-transfer poverty gap that is reduced by the transfer in question. Figure 5 shows changes in the poverty reduction effectiveness of Working and Child Tax Credit between 2004/05 and 2014/15.
Poverty reduction effectiveness of tax credits over time, working households only
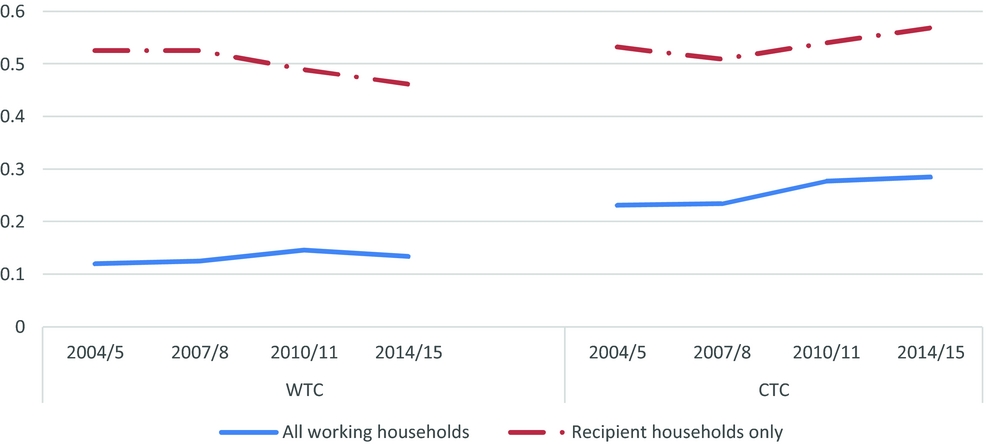
It is worth considering the figures at a point in time before examining the trend over time. Figure 5 shows that the reduction in the poverty gap amongst all working households that can be attributed to Working Tax Credit was between 10–15 per cent in all periods, while the respective figure for Child Tax Credit is between 20–30 per cent (the solid lines). Thus, CTC appears to be more effective than WTC in reducing poverty amongst working households. However, when we focus on recipient households only (that is, the dashed lines), we observe that this difference between WTC and CTC is more modest, with poverty reduction effectiveness for both measures between 45–55 per cent in most periods. The greater poverty reduction effectiveness for CTC amongst all households is thus primarily explained by its more widespread coverage.
This is significant: while tax credits account for a relatively small proportion of total household income (as discussed above), they play a major role in reducing the pre-tax credit poverty gap of recipient households. Indeed, the proportion of the pre-tax credit poverty gap for recipient households that is filled by these two payments jointly is 64 per cent in 2014/15 (not shown here). The reason for the lower estimates for all working households compared to those for recipient households is that coverage of tax credits for working poor families is far from total, as we have noted.
Over time, and especially since 2007/8, we see poverty reduction effectiveness falls for WTC and rises for CTC for recipient households. This is broadly consistent with the trends in average awards discussed above. The exception is perhaps in relation to the period between 2004/5 and 2007/8, where increasing coverage and average awards does not lead to a rise in poverty reduction effectiveness, because the pre-tax credit poverty gap was growing during this period.
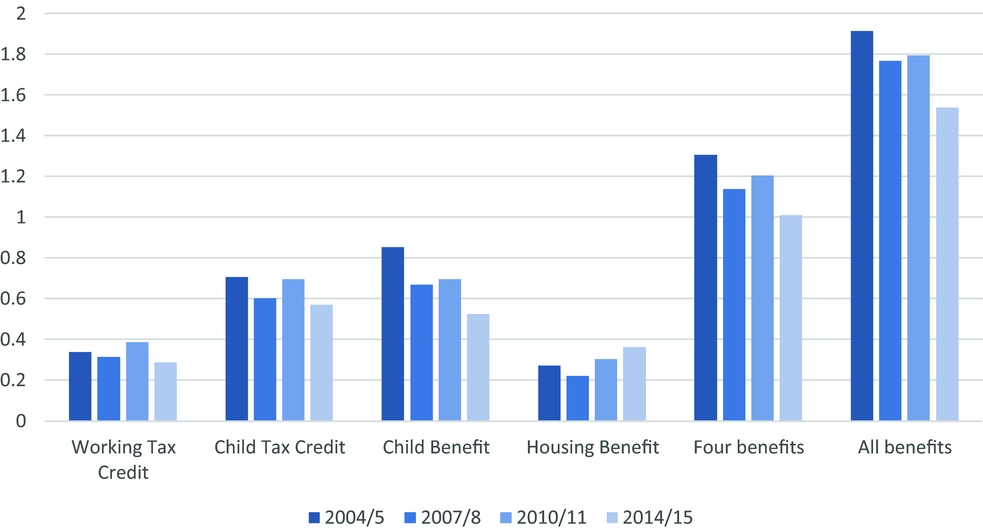
Turning then to poverty reduction potential, if we compare potential across payment type (which, as we have noted above, is complex), we see that the amount of tax credit payments is, even with perfect targeting, insufficient to eliminate poverty amongst working households (Figure 6). If we take into consideration all four of the main payments examined here or, indeed, all payments (which, as we have noted, will be an over-estimate), these total amounts would be sufficient to eliminate in-work poverty entirely if they were fully targeted.
We can also examine Figure 6 in terms of the trend over time for any given payment. The four benefits noted here – WTC, CTC, Child Benefit and Housing Benefit – make up, as we have noted, about two thirds of the social security income of poor working households. The poverty reduction potential for tax credits moves in a ‘zig-zag’ formation over the period consideration here.
Poverty reduction potential by payment over time, working households only
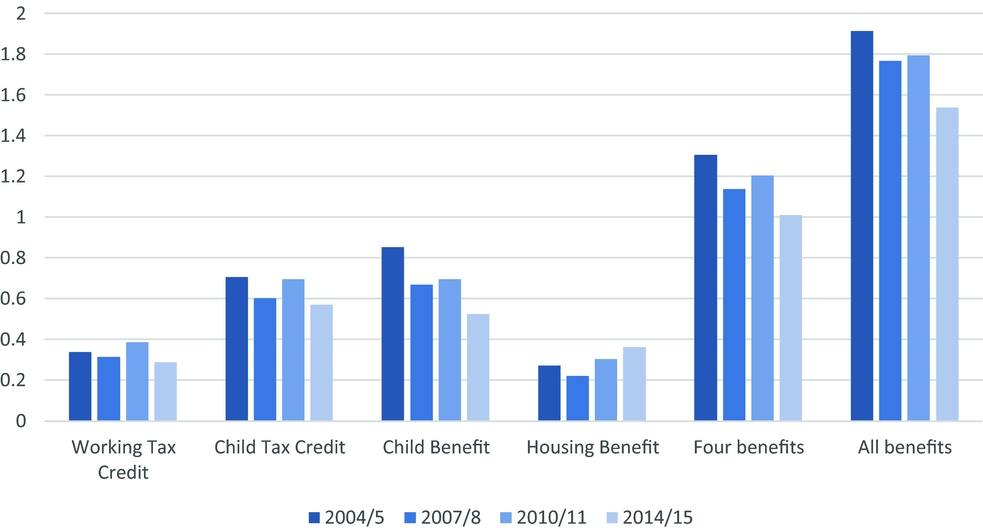
Between 2004/5 and 2007/8, spending on tax credits (or, indeed, four benefits or all benefits), increased in real terms, but failed to keep pace with the growing pre-transfer poverty gap, leading poverty reduction potential to fall. The opposite happened between 2007/8 and 2010/11, when spending increased more sharply in real terms, rising faster than the poverty gap, thus increasing potential. In the final period between 2010/11 and 2014/15, real spending fell in aggregate terms, while the poverty gap increased, leading to a reduction in poverty reduction potential.
In terms of other identified payments, the poverty reduction potential of Child Benefit fell sharply throughout the period, while Housing Benefit rose from 2007/8 onwards. Focussing on the measures for these four benefits jointly, and for all benefits, we note that these display sharply falling figures for poverty reduction potential, demonstrating that, taken together, the capacity of the social security system to fully eliminate poverty amongst working families, if fully targeted, has declined over the period.
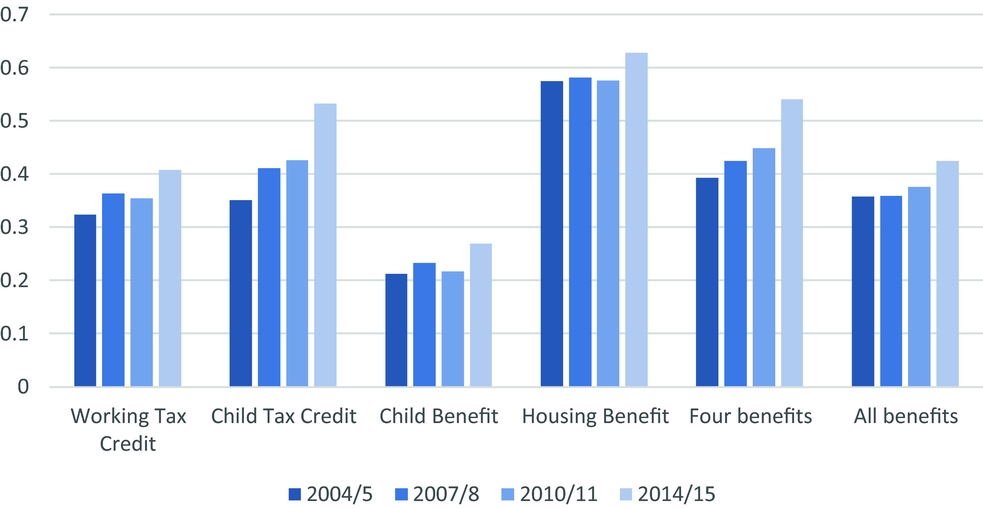
Turning to poverty reduction efficiency (Figure 7), which relates to the proportion of spending devoted to poor recipients, we can observe that the efficiency of tax credits rose throughout the period. This reflects two quite different mechanisms. In the first two periods, when Labour was in office, the coverage for both CTC and WTC increased and this increase was concentrated amongst working poor families, causing efficiency to rise. In the final period between 2010/11 and 2014/15, effectiveness continues to increase because while tax credits have been cut, these cuts have disproportionately fallen on the non-poor, especially in the case of Child Tax Credit, where entitlement was removed entirely for higher earners. The cumulative effect of these developments means that the proportion of Child Tax Credit spent on poor recipients rose from 35 per cent to 53 per cent between 2004/5 and 2014/15.
Poverty reduction efficiency by payment over time, working households only
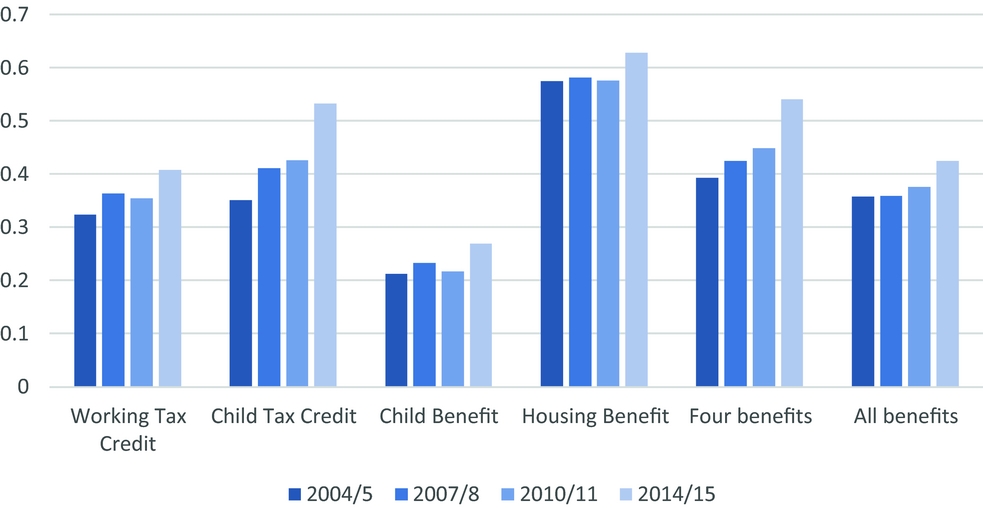
The efficiency of Child Benefit rises in the final period, when the removal of entitlement for better-off families comes into play, and efficiency for Housing Benefit also rises, demonstrating the effect of the growth in spending amongst those experiencing in-work poverty. These four benefits are targeted to a greater extent than social security as a whole (‘all benefits’), though efficiency for the latter rises, too.
It is sometimes suggested that comparisons relative to the poverty line are driven by variability in terms of the latter, especially when this is set at 60 per cent of median income and thus varies from year to year. To test the significance of this, we have re-run the analysis presented in Figures 5–7 using a fixed poverty line set at 60 per cent of 2014/15 median income, adjusted for CPI inflation in other years (this analysis is not presented here but is available from the authors on request). The central findings presented here continue to be observed. The primary deviation is in 2004/5 when applying a fixed line, poverty reduction potential was somewhat lower than is observed in Figure 6, and poverty reduction efficiency marginally greater than observed in Figure 7: this is due to the fact that a fixed line, adjusted only for inflation, is somewhat higher than the actual relative income poverty line in 2004/5 (or, put another way, the growth in household incomes outstrips inflation between 2004/5 and 2007/8). However, these differences are modest and, significantly, the key conclusions identified here are robust to the selection of either a relative or fixed income poverty line.
Decomposing these trends by household type
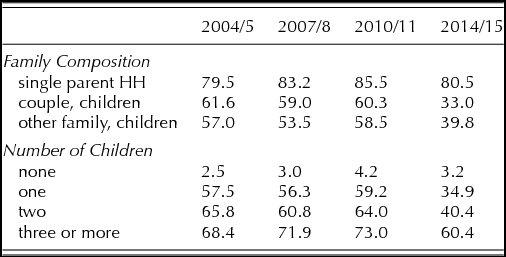
In this penultimate section, we focus on how the aforementioned trends have borne out for households based on two characteristics: family composition and the number of children in the household. In Table 2, we present trends in tax credit coverage by these two criteria. Coverage for single parent working households is higher than that for families with two of three children. Coverage for this group increased prior to 2010/11 and falls thereafter, though the changes in all periods are modest. In contrast, coverage for families with two or more adults is around 60 per cent in the three earlier periods, but falls sharply, below 40 per cent, by 2014/15. Thus, the reductions in tax credit coverage have been experienced primarily amongst families with two or more adults (in practice, mostly households with adult children).
Coverage rates for tax credits by family composition and number of children over time, all working households (%)

Source: HBAI, respective years
In terms of the number of children in the household, we first observe that coverage of tax credits for working families without children (which became possible after the 2003 reforms) is extremely low – around 3 or 4 per cent. Coverage increases in line with the number of children in the household but, again, the cuts between 2010/11 and 2014/15 have had a differential effect, being sharpest on families with one or two children. Thus, the cuts to tax credits post-2010/11 have left them concentrated to a greater extent on single parent families and families with larger numbers of children.Footnote 4
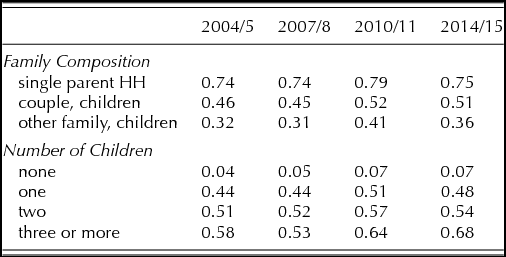
In Table 3, we demonstrate how the effectiveness of tax credits in reducing poverty varies by family composition and number of children in the household, measured using the poverty gap (see Figure 1 for formula). Poverty reduction effectiveness of tax credits is higher for families with fewer adults and with greater numbers of children. It is concerning is that the direction of policy has been to remove third and subsequent children from CTC entirely for new claimants from April 2017, given that policy has been most effective amongst this household type (even if this accounts for a small share of working poor households, see Hick and Lanau, Reference Hick and Lanau2017). Ghelani and Tonutti (Reference Ghelani and Tonutti2017) estimate that this two-child restriction will result in an additional 266,000 children experiencing relative poverty by 2019–20.
Poverty reduction effectiveness of tax credits over time, selected family characteristics, all working households

Source: HBAI, respective years
Focussing on the trend over time, we observe, contrary to the picture as regards coverage, that reductions in effectiveness are reasonably similar for the different family types. One possible reason for this might be that cuts have been made across the board (in terms of changing the income thresholds, etc.), rather than being targeted on specific family types. Households and groups find themselves in quite different positions pre-transfers and this may explain why changes in terms of coverage appear to be starker than those in terms of poverty reduction effectiveness. What we observe overall is a concentration of tax credits on single parent families and those with greater numbers of children, with declining effectiveness in reducing poverty post-2010/11.
Conclusions
In-work poverty is rising in the UK. In this article, we have examined the relationship between tax credits, social security more broadly, and in-work poverty using two complementary methodologies – by analysing the income packages of working households and by examining the performance of tax credits in relation of anti-poverty objectives. The preceding analysis generates five conclusions.
First, the tax credit cuts imposed by the Coalition government reduced coverage amongst working households, at a time when CTC coverage remained stable amongst workless households. By 2014/15, workless households were more likely to claim tax credits (i.e. CTC) than those where someone was in work.
Secondly, Working Tax Credit and Child Tax Credit were cut in the period post-2010/11 in quite different ways. Coverage for WTC remained reasonably stable, but average awards fell. In contrast, coverage of Child Tax Credit reduced, especially for non-poor working households, to a considerably greater extent than for Working Tax Credit, but average awards for those recipients who continued to be entitled to CTC rose in this period.
Third, tax credits can be highly effective at reducing in-work poverty for households that receive them, but their capacity to reduce in-work poverty is blunted by low coverage. If we look at poverty reduction effectiveness (the proportion of the poverty gap that is reduced by the payment in question), we see that this is greater for CTC than for WTC (0.2 – 0.3 vs 0.1 – 0.15). On closer inspection, this difference is explained to a substantial extent by the greater coverage of CTC. Indeed, if we focus only on recipients (thus controlling for coverage), we find that 45–55 per cent of the pre-tax credit poverty gap is reduced by CTC and WTC, and almost two-thirds of the pre-tax credit poverty gap of recipient households is reduced by these tax credits jointly. The stark difference between effectiveness for recipients and for all working families can be explained, at least in part, by the relatively low coverage of tax credits overall. This is most dramatically apparent in the case of working families without children. While the 2003 reforms extended coverage of WTC to this group, the proportion of working poor households without children who do, in fact, receive tax credits is very low (<10 per cent), while such households make up almost half of those who experience in-work poverty. This is a key reason why tax credits are not more effective in reducing poverty amongst working households.
Fourth, when considering working poor households, we must be cognisant of the fact that only about one-third of the social security income received by such households comes from tax credits. Housing Benefit and Child Benefit accounts for another third, with the former accounting for a growing share of the incomes of working poor households over the past decade, while the final third is made up of other payments, including JSA and ESA. Households experiencing in-work poverty depend on quite a wide range of payments and thus cuts to both in- and out-of-work payments will aggravate in-work poverty.
Fifth, tax credit cuts have had varied implications for different households. Across the four periods considered here, the coverage of tax credits, and their effectiveness in reducing poverty, has been greatest amongst households with fewer adults (especially lone parent families) and with greater numbers of children. The tax credit cuts post-2010/11 have concentrated tax credits on such families (coverage), though this has not resulted in sharply differentiated reductions in poverty reduction effectiveness, which has been to some extent across the board rather than clearly related to household composition. The high levels of effectiveness in reducing poverty amongst larger families makes eliminating entitlement to Child Tax Credit for third and subsequent children all the more problematic, if attempts to tackle both child poverty and in-work poverty are deemed important.
Tackling in-work poverty requires a clearer understanding of the way that social security, and tax credits in particular, contributes to the income adequacy of working families. It requires understanding that while tax credits may be expensive, they have also proved effective in reducing in-work poverty in the UK. But it also requires being mindful that tax credits account only for a minority share of social security income of working poor households; that they are received by few of the one-half of working poor households without children, and that such households rely on a complex mix of employment, tax credit and other social security income. Understanding this complex interaction can help us to more effectively tackle in-work poverty.
Acknowledgements
The material presented in this article comes from a research project funded by the Nuffield Foundation (award ECO/42545). The authors thank Fran Bennett, three reviewers, and participants at an event on in-work poverty held at the Nuffield Foundation in London in January 2017, at which a draft of this material was presented. The remaining errors are ours alone.