Introduction
Antibiotic exposure in acute care remains an antibiotic stewardship priority given the high antimicrobial resistance (AMR) rate, adverse outcomes (e.g., Clostridioides difficile infection and drug-related events), and significant economic costs. In 2019 alone, AMR led to 141,000 deaths in the Americas and 15,000 in the US, with older adults more affected.Reference Murray, Ikuta and Sharara1–Reference Amin, Dhanani and Patel3 Older adults commonly experience multimorbidity, polypharmacy, and increased susceptibility to drug-drug interactions and organ toxicity.Reference Ladines-Lim, Fischer, Linder and Chua4–7 Recent national emergency department (ED) data (2016–2021) showed antibiotics prescribed in 18.6% of visits, with nearly one in three lacking guideline support. Among older adults, 24.6% of prescriptions were inappropriate, including 12.6% with a plausible indication and 12.0% without.Reference Ladines-Lim, Fischer, Linder and Chua4
Improving prescribing appropriateness in the ED, one of the main AMR drivers, requires attention to two distinct aspects. Overuse exposes patients to immediate harms without benefit, whereas underuse withholds indicated therapy and increases the risk of clinical deterioration when bacterial illness is present. Yet national literatureReference Ladines-Lim, Fischer, Linder and Chua4,Reference Hersh, King, Shapiro, Hicks and Fleming-Dutra8,Reference Linder10 often focuses on overuse, leaving underuse less visible. Parsing overuse and underuse by diagnosis tiers provides a clearer map for stewardship: reducing unnecessary exposure where antibiotics are not indicated while ensuring timely treatment when necessary.
Prescribing differences likely reflect clinical case-mix and contextual forces—access, follow-up capacity, and practice culture—in time-pressured ED encounters.Reference Al Mohajer, Slusky, Nix and Nicodemo11–Reference Young, Strey and Lee13 Area-level indicators (e.g., Social Vulnerability Index [SVI] and the Social Deprivation Index [SDI]) quantify these impacts and are linked to delayed presentation, differential ED utilization, and testing access that influence triage and whether antibiotics are started or deferred;Reference Al Mohajer, Slusky, Nix and Nicodemo11,14–Reference Van Dyke21 prior work often uses one index, limited geography, or utilization (not guideline concordance), rarely examines overuse and underuse together, and conventional regression is vulnerable to confounding from unmeasured system and community factors.Reference Ladines-Lim, Fischer, Linder and Chua4,Reference Hersh, King, Shapiro, Hicks and Fleming-Dutra8–Reference Linder10
Because most prior ED/ambulatory studies report adjusted associations—not the causal effect of community deprivation on guideline concordance—an instrumental-variable (IV) approach is deemed appropriate.Reference Angrist and Pischke22 Building on prior work, we use the maximum state Earned Income Tax Credit (EITC) as our instrument: a policy-driven refundable tax credit for low-income workers that shifts long-run economic conditions correlated with SVI/SDI but—once state and month-year effects are accounted for—has no plausible direct pathway to ED prescribing; in prior analyses, it was a strong instrument that supported potential causal interpretation.Reference Al Mohajer, Slusky, Nix and Nicodemo11
This study evaluated the causal effects of community vulnerability and deprivation (SVI, SDI, and SDI components) on ED antibiotic guideline concordance in the US, explicitly partitioning non-concordance into overuse and underuse.
Methods
Data sources
We used five data sources: (1) Electronic health record (EHR) data from CommonSpirit Health facilities obtained through TheraDoc (Premier, Inc., Charlotte, NC), (2) the SVI from the Centers for Disease Control and Prevention,14 (3) the SDI from the American Community Survey,15 (4) the American Hospital Association (AHA) Annual Survey,23 and (5) the Tax Policy Center’s maximum EITC data set.24 First, the EHR data set included patient demographics, comorbidities, vital signs, disposition status, antibiotic prescriptions, patient and facility addresses, and diagnostic codes. Second, the SVI and SDI data were linked to encounters using the patient census tract. Third, we extracted the number of staffed beds from the AHA Annual Survey.23 Additionally, hospital teaching status was identified from a national database,25 and metropolitan/rural designation was determined using Rural-Urban Commuting Area (RUCA) codes based on hospital ZIP codes.26 Fourth, maximum EITC rates were obtained from the Tax Policy Center and linked at the state level.24
Study sample
We included all ED encounters for patients ≥65 years between January 1, 2015, and December 31, 2024, from CommonSpirit Health facilities. Encounters required the international classification of diseases (ICD)-9 or ICD-10 diagnostic codes. We excluded 21,915 encounters from addresses outside the 50 US states, the District of Columbia, and those with missing patient or facility address data.
Study outcomes
Our primary outcome was antibiotic guideline concordance, defined as antibiotic administration within 24 hours of ED presentation that was appropriate for the encounter’s diagnosis tier. We followed the Infectious Disease Society of America guidelines (published before December 2024), operationalized through the diagnosis-based tier framework described by Ladines-Lim et al. Reference Ladines-Lim, Fischer, Linder and Chua4 Subsequently, ICD-9 and ICD-10 codes were assigned to one of three tiers: Tier 1, antibiotics almost always indicated; Tier 2, sometimes indicated; Tier 3, not indicated. Tier assignments were based on established algorithms and reviewed by one infectious disease specialist (MA). For encounters with multiple diagnoses, the highest applicable tier was used. We included secondary outcomes, such as antibiotic overuse, defined as prescribing when not indicated (Tier 3 or indication not available), and antibiotic underuse, defined as not prescribing when indicated (Tier 1). Tier 2 diagnoses were considered appropriate whether or not antibiotics were prescribed, as the decision depends on clinical judgment and could not be adjudicated without chart-level context.
Independent variables
Our primary contextual exposures were tract-level SVI and SDI; higher scores indicate greater vulnerability/deprivation. SDI comprises seven indicators: poverty, low education, nonemployment, single-parent households, renting, overcrowding, and no vehicle.14,15
Covariates included patient factors (age, biological sex, race/ethnicity, marital status, insurance, Charlson Comorbidity Index,Reference Charlson, Pompei, Ales and MacKenzie27 Systemic Inflammatory Response Syndrome (SIRS) score,Reference Bone, Balk and Cerra28 systolic blood pressure, and travel time in minutes from residence to facilityReference Giraud29 and institution factors (staffed beds, teaching status, and RUCA-defined metropolitan/rural location).26
Statistical analysis
The primary analysis used two-stage least squares (2SLS) IVs regression with the state maximum EITC as the instrument (Figure 1). Stage 1 regressed SVI/SDI (or SDI components) on the instrument; stage 2 used fitted values to estimate associations with antibiotic guideline concordance and secondary outcomes.Reference Kleiber and Zeileis30,Reference Cameron and Miller31 Models used linear probability specifications, and results are expressed as percentage-point changes in probability. Instrument strength was assessed by the first-stage F-statistic and endogeneity by the Wu–Hausman test. Models adjusted for all covariates above and included month-year and state fixed-effects with patient-clustered robust standard errors; analyses used ivreg in R.Reference Kleiber and Zeileis30 As a comparison, we fit matched fixed-effects OLS models.
Instrumental variable framework using maximum EITC to estimate the effect of SDI/SVI on guideline concordance.
Notes: this directed acyclic graph illustrates how the maximum earned income tax credit (EITC) is used as an instrument (Z) to estimate the effect of the social deprivation index (SDI) or social vulnerability index (SVI) (X) on the concordance rate (Y). The instrumental variable (IV) approach rests on three assumptions: relevance (the EITC is strongly correlated with SDI and SVI), exclusion restriction (the EITC influences guideline concordance only through these indices, with no direct effect), and no unmeasured confounding (other potential confounders, such as state policies, are addressed in the model). EITC, earned income tax credit; SDI, social deprivation index; SVI, social vulnerability index. Adapted from: Al Mohajer M, Slusky D, Nix D, Nicodemo C. Investigating socioeconomic deprivation and antibiotic prescribing among older medicare patients using an instrumental variable approach. antimicrobial stewardship and healthcare epidemiology. 2025;5(1):e110. https://doi.org/10.1017/ash.2025.185. Licensed under CC BY 4.0.Reference Al Mohajer, Slusky, Nix and Nicodemo11

We assessed spatial autocorrelation in two steps: (i) univariate global Moran’sI and LISA cluster maps for SVI, SDI, and antibiotic concordance separately, and (ii) bivariate LISA to examine local association between SVI-concordance and SDI-concordance.Reference Anselin32 Missing data (sex, race/ethnicity, staffed beds, insurance, marital status, SIRS, SBP) were imputed via the mice package, with complete-case analyses for comparison; coefficient differences were tested using z-tests.Reference Van Buuren and Groothuis-Oudshoorn33 We set α = 0.0005 using Good’s standard value (.05/√[n/100]).Reference Good34
SVI and SDI were rescaled prior to analysis so that a one-unit increase corresponds to a 10-percentage-point (ppt) increase in the original index. All coefficients are reported as percentage-point (pp) changes in outcomes per 10-ppt increase in the exposure.
The study was approved by the Baylor College of Medicine IRB (H-56,277). All analyses were performed using R version 4.5.1.
Results
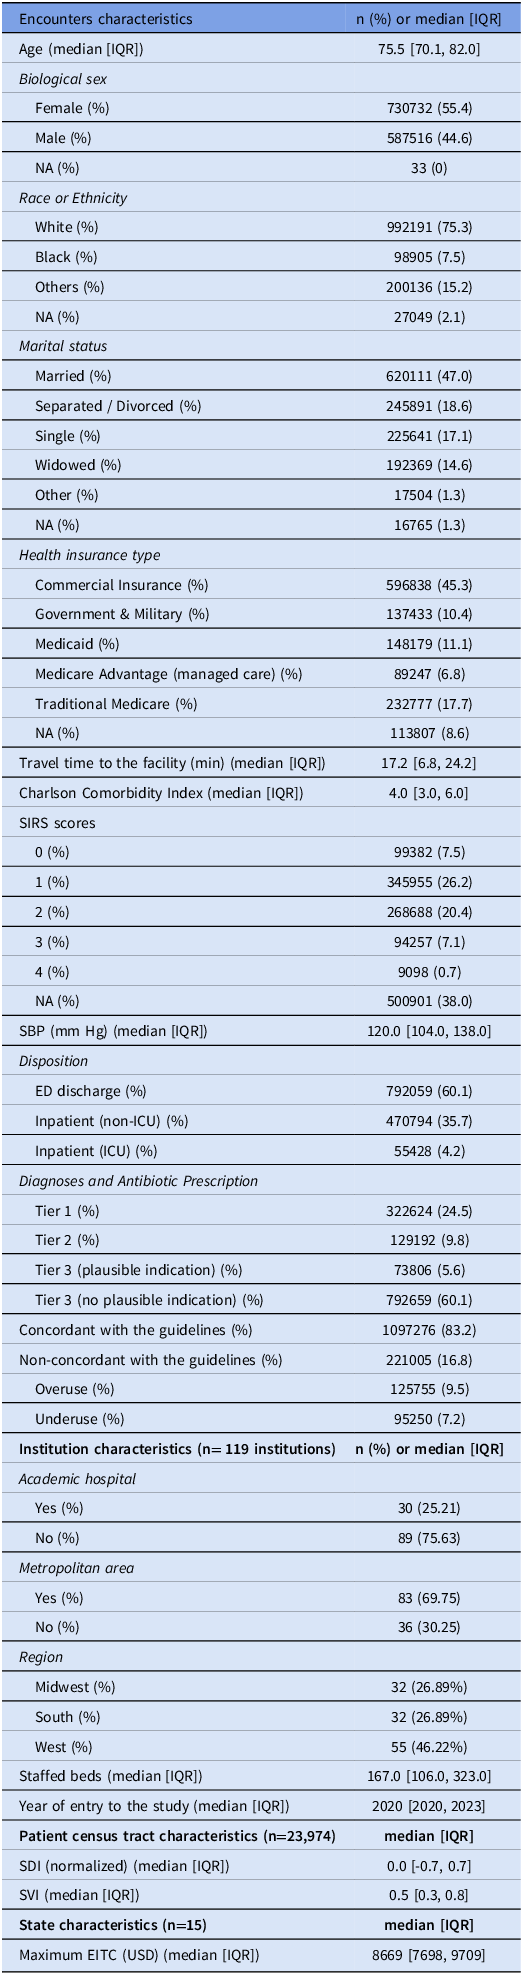
Study characteristics
Among 790,562 patients (1,318,281 encounters), median age was 75.5 years; 55.4% were female; race/ethnicity was 75.3% White (Black 7.5%, other 15.2%) (Table 1). Across 119 EDs in 15 states, 86.0% were metropolitan and 41.0% academic (median 167 staffed beds). At the census-tract level (23,974 tracts), disadvantage was moderate (SDI median .0 [IQR −0.7–0.7]; SVI .5 [IQR 0.3–0.8].
Study characteristics of the included individuals (n = 790,562 patients, 1,318,281 encounters)

Notes: ED, Emergency Department; EITC, Earned Income Tax Credit; ICU, Intensive Care Unit; IQR, Interquartile Range; NA, Not Applicable; SDI, Social Deprivation Index; SIRS, Systemic Inflammatory Response Syndrome; SBP, Systolic Blood Pressure; SVI, Social Vulnerability Index.
Primary outcomes
The overall guideline concordance was 83.2%, with 16.8% non-concordance (overuse 9.5%; underuse 7.2%). From 2015 to 2024, concordance increased modestly from 78.4% to 83.8%, overuse rose from 5.4% to 10.8%, and underuse declined from 16.2% to 5.4%. COVID-19 was the most frequent reason for overuse (20.1%), and urinary tract infection diagnosis codes were the most frequent reason for underuse (33.6%). By tier, antibiotics were prescribed in 80.8% of Tier 1 encounters, 28.1% of Tier 2 encounters, and 15.9% of Tier 3 encounters
Factors associated with the primary outcome
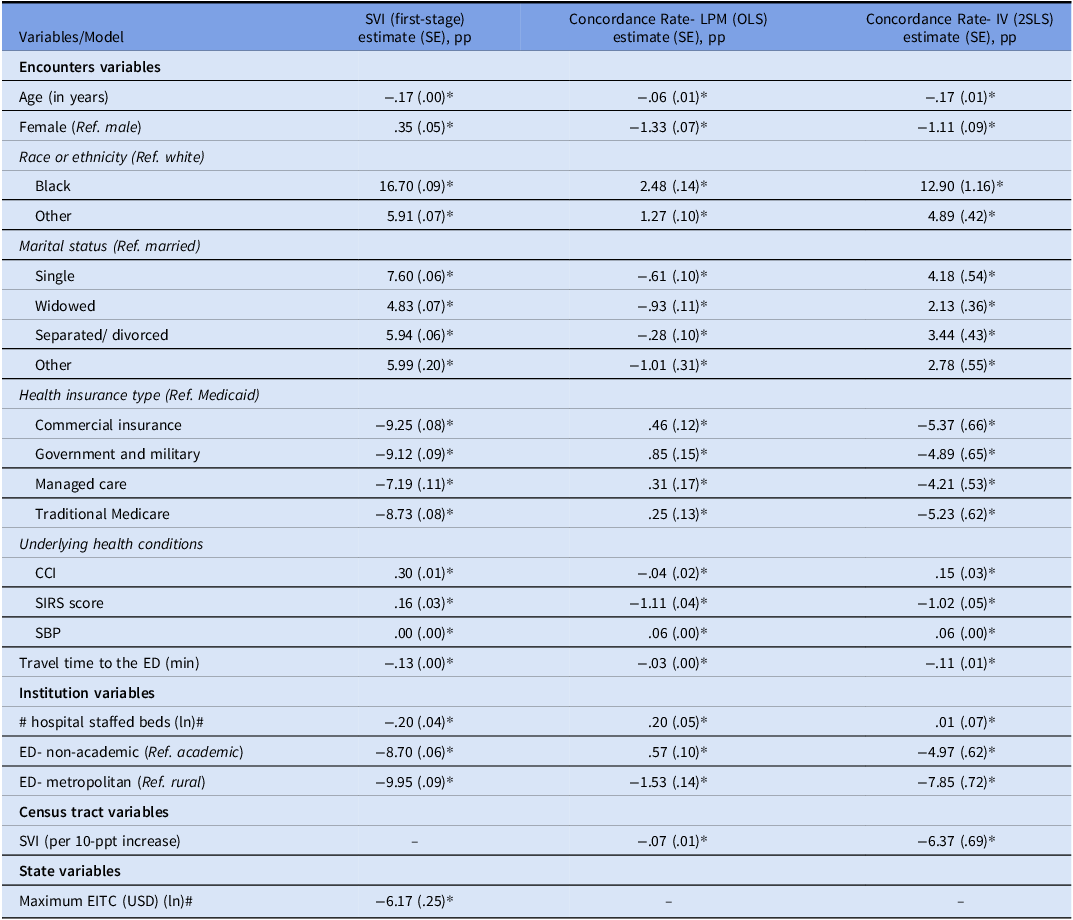
Yearly trends in concordance were similar across all SVI and SDI quintiles (≤1 pp) (Figure 2). In the primary IV models, the instrument was strongly relevant (first-stage F = 348 for SVI; 413 for SDI). A 10-ppt higher SVI predicted a 6.37 pp lower probability of concordance (SE 0.69 pp; P < .0005; Table 2), and a 10-ppt higher SDI predicted a 1.84 pp lower probability (SE .20 pp; P < .0005; Supplementary Table 1). Naïve, fixed-effects OLS models yielded much smaller associations: .07 pp lower probability per 10-ppt SVI (SE .01; P < .0005; Table 2) and 0.02 pp lower probability per 10-ppt SDI (SE .01; P < .0005; Supplementary Table 1).
Trends in guideline-concordant antibiotic selection by SVI and SDI quintiles across ED from 15 US-states, 2015–2024.
Notes: Annual concordance (%) by SVI (Panel A) and SDI (Panel B) quintiles, 2015–2024; Q1 = least disadvantaged, Q5 = most disadvantaged. SDI, social deprivation index; SVI, social vulnerability index.

Association between the social vulnerability index (SVI) and antibiotics concordance across ED from 15 US-states, 2015–2024

Notes: Models controlled for institution state, month–year, and institution year of entry. Robust standard errors were clustered at the patient level.
* P <.0005 based on the Good standardized value (.05/√[n/100]).
# Log-transformed values were used to normalize the data. Abbreviations: 2SLS, two-stage least squares; CCI, Charlson Comorbidity Index; ED, emergency department; EITC, Earned Income Tax Credit; IV, instrumental variables; LPM, linear probability model; OLS, ordinary least squares; pp, percentage points; ppt, percentage-point change in the index; Ref, Reference category; SBP, systolic blood pressure; SIRS, systemic inflammatory response syndrome; SVI, Social Vulnerability Index. First-stage F = 348 (P < .0001) indicated a strong instrument. The Wu–Hausman test (P < .0001) supported the use of IV over OLS. SVI effects are reported per 10-percentage-point increase. Outcomes are reported in percentage points.
Higher concordance was observed among Black and other racial/ethnic groups (vs White), non-married individuals, those with higher CCI, and those with higher SBP at presentation; lower concordance was associated with older age, female sex, non-Medicaid insurance, higher SIRS score, longer travel time to the ED, metropolitan location, and non-academic facilities (Table 2). Complete-case IV models produced directionally consistent estimates (−5.9 vs −6.4 pp for SVI; P = .956, Supplementary Table 2), but complete-case was less precise (larger SEs).
Secondary outcomes
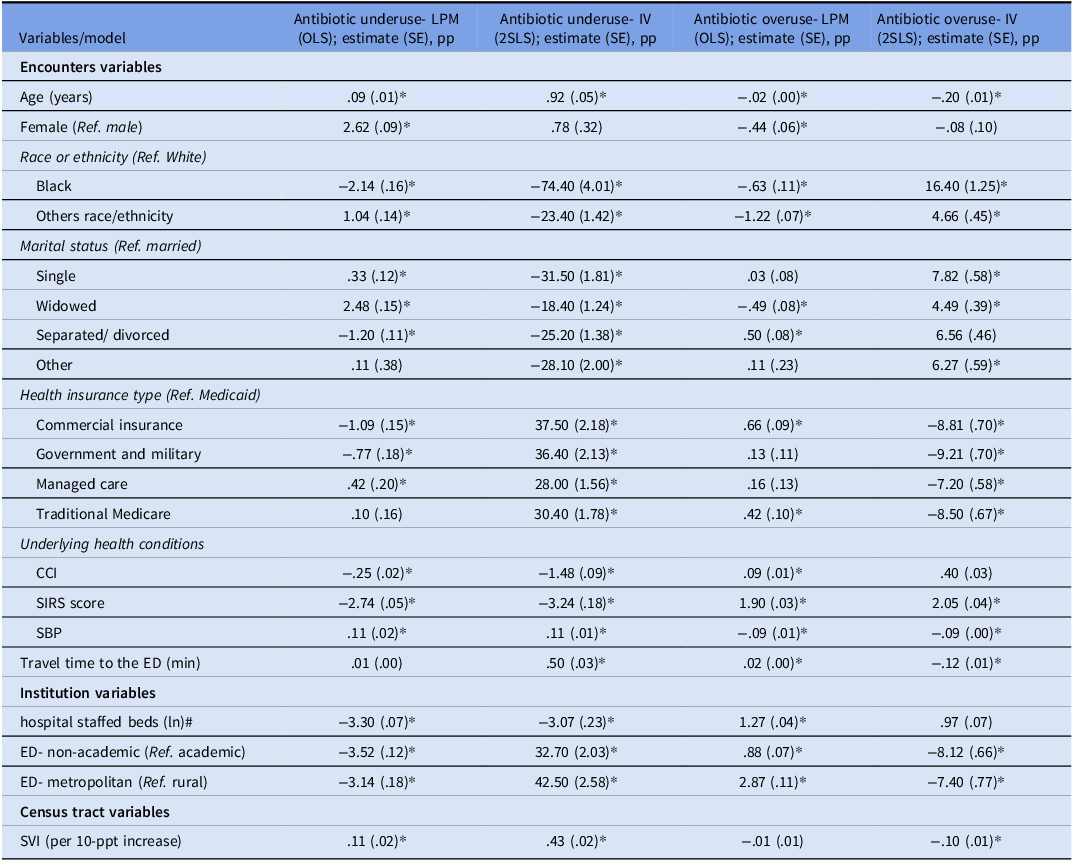
Overuse and underuse showed comparable yearly patterns across deprivation quintiles (≤1 pp) (Supplementary Figure 1). In the primary IV models, a 10 ppt higher SVI predicted .43 pp higher underuse (SE .02; P < .0005) and .10 pp lower overuse (SE .01; P < .0005; Table 3). A 10 ppt higher SDI predicted .12 pp higher underuse (SE .01; P < .0005) and .30 pp lower overuse (SE .02; P < .0005; Supplementary Table 3). As a robustness check, fixed-effects OLS estimates were much smaller: for SVI, .11 pp higher underuse (SE .02; P < .0005) and .01 pp lower overuse (SE .01; P = .270; Table 3); for SDI, .04 pp higher underuse (SE .01; P < .0005) and .01 pp lower overuse (SE .00; P = .0152; Supplementary Table 3). Complete-case IV estimates were markedly attenuated and less precise than the imputed estimates (Supplementary Table 2).
Association between the social vulnerability index (SVI) and secondary outcomes across ED from 15 US-states, 2015–2024

Notes: Models controlled for institution state, month–year, and institution year of entry. Robust standard errors were clustered at the patient level.
* P < .0005 based on the Good standardized value (.05/√[n/100]).
# Log-transformed values were used to normalize the data. Abbreviations: 2SLS, two-stage least squares; CCI, Charlson Comorbidity Index; ED, emergency department; IV, instrumental variables; LPM, linear probability model; OLS, ordinary least squares; pp, percentage points; ppt, percentage-point change in the index; Ref, Reference category; SBP, systolic blood pressure; SIRS, systemic inflammatory response syndrome; SVI, Social Vulnerability Index. SVI effects are reported per 10-percentage-point increase. Outcomes are reported in percentage points.
Black and other racial/ethnic groups, Medicaid insurance, and unmarried status were associated with less underuse and more overuse. Higher comorbidity, elevated SIRS score, and lower SBP indicated more empiric treatment (less underuse, more overuse), whereas longer travel time, metropolitan location, and nonacademic EDs were associated with more underuse (and less overuse).
SDI components
In IV models, all seven SDI components were inversely associated with guideline concordance (Supplementary Table 4). A 10-ppt higher tract prevalence of nonemployment was associated with a .34-pp lower concordance (SE .10, P < .0005), household crowding with a .29-pp lower concordance (SE .08, P < .0005), and no vehicle with a .11-pp lower concordance (SE .02, P < .0005). Poverty, single-parent households, and renter-occupied housing showed smaller but highly precise associations (−0.06 to −0.08 pp, SE .01, P < .0005). First-stage F values ranged from 12.7 for nonemployment to 360 for renter-occupied housing. Similar patterns were observed for antibiotic overuse and underuse, with nonemployment and household crowding yielding the largest absolute effects, and poverty, single-parent households, and renter-occupied housing producing the most precise estimates.
Geographic clustering
Spatial clustering of predicted SVI and SDI values from the IV model was evident (Moran’s I = 0.88 and 0.85, respectively; P < .0001), indicating that census tracts with higher predicted deprivation or social vulnerability were geographically adjacent. There were 2,003 high-SVI and 1,717 high-SDI census tracts adjacent to other high-deprivation tracts. These high-high clusters were concentrated in the South, whereas low-low clusters (1,816 for SVI and 1,741 for SDI) were primarily in the Midwest.
Concordance with guidelines showed spatial clustering (Moran’s I = 0.05, P < .0001). There were 913 high-high and 1,036 low-low clusters. High-high clusters were concentrated in the Northwest and Midwest; low-low clusters were concentrated in the South and Southwest.
Predicted SVI from the IV model was spatially associated with antibiotic concordance (Moran’s I = −0.04, P = .0003). The bivariate LISA map (Figure 3) showed 801 high-SVI/low-concordance clusters in the South and 636 low-SVI/high-concordance clusters in the Midwest.
Bivariate LISA map of IV-predicted SVI and guideline-concordant antibiotic selection across US census tracts.
Notes: Global Moran’s test showed spatial dependence between predicted SVI and guideline concordance (I = −.04, P = .0003), indicating a modest negative spatial association. The distribution included 625 high-SVI/ high-concordance, 725 low-SVI / low-concordance, 636 low-SVI / high-concordance, 801 high-SVI/ low-concordance, and 3,338 non-significant clusters. High-SVI/ low-concordance clusters were largely located in the South, and low-SVI/ high-concordance clusters were mainly seen in the Midwest. Predicted SVI values were obtained from the instrument value model using maximum EITC. The adjusted values were then obtained after regressing on other variables. LISA, local indicators of spatial association; SVI, social vulnerability index.

Discussion
We show that higher SVI and SDI levels are associated with lower guideline concordance in US EDs among older adults, driven by increased antibiotics underuse, partially offset by modest reductions in overuse. Our findings suggest that structural disadvantage thus shifts the balance between indicated and discretionary use, increasing undertreatment while tempering overuse.Reference Al Mohajer, Slusky, Nix and Nicodemo11 While the descriptive quintile trends showed only modest differences, the IV estimates clarified that deprivation causally increased underuse while slightly reducing overuse, underscoring how adjusted models reveal a stronger inequity signal than raw patterns alone.
In contrast, temporal trends demonstrated that concordance rose between 2015 and 2020 and remained high through 2024, but this pattern reflected declining underuse alongside rising overuse. Much of the latter was linked to empiric antibiotic use during the early COVID-19 pandemic and the frequent absence of a plausible coded indication.Reference Ladines-Lim, Fischer, Linder and Chua4 COVID-19 accounted for a large share of overuse, while UTI diagnoses contributed most to underuse; however, diagnosis codes may include presentations later determined to be asymptomatic bacteriuria or noninfectious syndromes, which could inflate apparent underuse. These trends mirror prior national reports of rising empiric use and persistent diagnostic uncertainty in older adults, especially for urinary and respiratory syndromes, where appropriateness is often difficult to adjudicate.Reference Ladines-Lim, Fischer, Linder and Chua4
Consistent with prior literature, disadvantaged populations are more likely to receive non-concordant antibiotic prescribing.Reference Al Mohajer, Slusky, Nix and Nicodemo11–Reference Young, Strey and Lee13,Reference Kissler, Klevens, Barnett and Grad35 Deprivation-related constraints—such as delayed presentation and reduced outpatient continuity and follow-up capacity—may increase diagnostic uncertainty and shape clinicians’ thresholds for initiating indicated therapy.Reference Butler, Petterson, Phillips and Bazemore17,Reference Mullachery, Li and Melly19,Reference Kissler, Klevens, Barnett and Grad35 The same constraints may limit discretionary prescribing when antibiotics are not indicated, reducing overuse.Reference Linder10,Reference Al Mohajer, Slusky, Nix and Nicodemo11,Reference Kissler, Klevens, Barnett and Grad35 For instance, nonemployment, household overcrowding, and limited infrastructure showed the strongest associations with lower concordance. This points to mechanisms tied to transportation, household constraints, and instability of work and caregiving arrangements. Prior work links area deprivation to differences in access and utilization; our results extend that literature by relating specific components to tier-defined prescribing outcomes in the ED.14,Reference Butler, Petterson, Phillips and Bazemore17,Reference Morenz, Liao, Au and Hayes20,Reference Kissler, Klevens, Barnett and Grad35
After adjusting for deprivation and facility characteristics, antibiotic overuse was more common among older adults who were non-white, unmarried, and insured through non-Medicaid plans, with higher rates also observed in larger, academic, and rural EDs. This pattern is consistent with lower treatment thresholds in settings or patient groups where clinicians perceive greater risk of clinical deterioration and weaker safety nets for follow-up or continuity of care.Reference Ladines-Lim, Fischer, Linder and Chua4,Reference Linder10,Reference Palms, Hicks and Bartoces36 For race and ethnicity, higher concordance was observed among Black and other racial/ethnic groups, reflecting markedly lower underuse despite modestly higher overuse. Several ambulatory and ED studiesReference Seibert, Hersh and Patel12,Reference Young, Strey and Lee13,Reference Goyal, Johnson and Chamberlain37 have reported lower overall antibiotic use among Black and Hispanic patients, although limited in incorporating causal inference for area-level socioeconomic conditions. In an older ED population with atypical presentations, clinicians anchored on physiologic instability or anticipated barriers to return care, lowering the threshold to “cover” with antibiotics.Reference Ladines-Lim, Fischer, Linder and Chua4,Reference Linder10 Rural EDs, compared with metropolitan EDs, may face constrained access to imaging, laboratory turnaround, and next-day clinics, which can push toward empiric treatment in low-probability scenarios and help explain the rural-to-urban overuse gradient we observed. In contrast, longer patient travel time was associated with higher underuse and lower overuse, suggesting that patient-level access constraints may operate differently than facility rurality and may reflect referral patterns or delays in early antibiotic initiation.Reference Mullachery, Li and Melly19,Reference Kissler, Klevens, Barnett and Grad35,Reference Palms, Hicks and Bartoces36
Predicted SVI and SDI were spatially clustered, as was concordance, with high-disadvantage/low-concordance clusters in the South and low-disadvantage/high-concordance clusters in the Midwest. These patterns are consistent with broader regional differences, where the South has higher poverty, more rural hospital closures, and weaker public health investment, while the Midwest has greater primary care availability and stronger continuity of services.Reference Butler, Petterson, Phillips and Bazemore17,Reference Mullachery, Li and Melly19,Reference Van Dyke21,Reference Kissler, Klevens, Barnett and Grad35 Such contrasts help explain why prescribing diverges regionally and highlight the importance of targeting stewardship to the local health system context. The IV results are consistent with a potential causal interpretation under IV assumptions. Maximum state EITC exhibited strong first-stage associations with both SVI and SDI, and the IV estimates for underuse and overuse were directionally consistent with OLS but larger in magnitude, which is expected if unmeasured features of access and practice culture bias conventional estimates toward the null. As a policy-determined exposure that varies across states and time and does not plausibly affect a clinician’s antibiotic choice except through community deprivation when state and temporal effects are modeled, EITC meets standard relevance and exclusion criteria used in the literature.Reference Al Mohajer, Slusky, Nix and Nicodemo11,Reference Angrist and Pischke22,Reference Anselin32,Reference Larrimore38,Reference Hoynes and Patel39 Conversely, the high F-statistics, agreement across specifications, and coherence with the component analysis increase confidence in the direction and structure of the associations. These findings suggest ED stewardship could monitor underuse and overuse separately and stratify performance by patient and neighborhood factors to identify inequities. Because tiering relies on diagnosis codes, any metric should be paired with audit safeguards against coding drift. The tier-by-prescribing framework lends itself to automated dashboards and iterative decision support linked to orders/symptoms, and spatial clustering can guide where to prioritize interventions.
The study has limitations, including the potential misclassification from diagnosis coding and tier assignment, using a single infectious disease specialist, unobserved clinical considerations not captured in the EHR, and measurement error in geocoding and travel time. SVI was originally developed for disaster-management vulnerabilityReference Flanagan, Gregory, Hallisey, Heitgerd and Lewis16 and may not fully capture deprivation constructs most relevant to healthcare delivery, introducing measurement error when applied to prescribing outcomes. Complete-case IV estimates were generally less precise and sometimes attenuated relative to imputed models, consistent with reduced sample size and potential selection bias due to missing covariates. Outcomes reflect antibiotics administered within 24 hours of ED presentation; for admitted patients, some early antibiotic decisions may reflect inpatient rather than ED teams. ICD-coded UTIs may include asymptomatic bacteriuria or noninfectious syndromes, potentially overstating underuse. Because underuse and overuse were uncommon (∼7–10%), IV estimates may appear large and should be interpreted cautiously. Moreover, the study setting may limit generalizability beyond participating systems and regions.
Despite these limitations, the study draws on a large, multi-state, encounter-level EHR dataset; applies a tier-based framework that separates underuse from overuse; examines both SVI and SDI, including SDI components; uses an IV design with strong first-stage performance; and incorporates spatial methods that move beyond individual-level associations to identify tract-level clustering relevant for implementation. In summary, area-level disadvantage was linked to greater underuse and lower overuse, with clear geographic clustering, while patient- and facility-level factors showed the opposite tendency, with non-White, non-married, and higher-acuity patients, and larger, academic, and rural EDs more often receiving empiric therapy. Stewardship that addresses both sides of error, targets disadvantaged communities, and builds safeguards in settings prone to overuse is most likely to improve outcomes and advance equity.
Supplementary material
The supplementary material for this article can be found at https://doi.org/10.1017/ice.2026.10410.
Acknowledgments
The encounter-level EHR data analyzed in this study are subject to IRB and data-use agreements and are not publicly available. Analytic code is available from the authors upon reasonable request.
Author contributions
Conception and design of the study (MA, CN). Data acquisition: (MA, SS). Data cleaning: (MA). Statistical analysis and methodology: All authors. Drafted the initial manuscript: (MA). Critically revised and approved the manuscript: All authors.
Financial support
None.
Competing interests
All authors declare no conflicts of interest.