Lameness is one of the most important reasons for culling in dairy cows (ADR, 2010). Next to infectious claw diseases, non-infectious claw disorders like white line disease and sole ulcer are significant causes of lameness. Corium changes that lead to incorporation of serum, blood or cell detritus in the horn precede the overt expression of these diseases (Mülling & Lischer, Reference Mülling and Lischer2002; Bergsten, Reference Bergsten2003). After 8–12 weeks, the pathologic changes of the corium appear outside the claw as yellowish, crumbly horn or red discolouration of varying intensity (haemorrhages), evident during claw trimming (Lischer & Ossent, Reference Lischer and Ossent1994). The reasons for these corium changes are not clearly understood. Different internal and external factors seem to have an influence. For example, nutritional status, hormonal changes near the time of calving, diseases of other organ systems, and genetic influences have been discussed (Greenough & Vermunt, Reference Greenough and Vermunt1991; Mülling & Lischer, Reference Mülling and Lischer2002; Bicalho & Oikonomou, Reference Bicalho and Oikonomou2013). Mechanical stress to the claws (as a result of housing conditions) seems to be a key factor (Van Der Tol et al. Reference Van Der Tol, Metz, Noordhuizen-Stassen, Back, Braam and Weijs2002; Knott et al. Reference Knott, Tarlton, Craft and Webster2007; Telezhenko et al. Reference Telezhenko, Bergsten, Magnusson, Ventorp and Nilsson2008), as does body condition. Espejo et al. (Reference Espejo, Endres and Salfer2006), Hoedemaker et al. (Reference Hoedemaker, Prange and Gundelach2009), Green et al. (Reference Green, Huxley, Banks and Green2014) and Foditsch et al. (Reference Foditsch, Oikonomou, Machado, Bicalho, Ganda, Lima, Rossi, Ribeiro, Kussler and Bicalho2016) found an association between lameness and lower body condition of cows. Bicalho et al. (Reference Bicalho, Machado and Caixeta2009) and Machado et al. (Reference Machado, Caixeta and Bicalho2011) observed that, when the body condition score (BCS) decreases, the digital cushion within the claw becomes thinner and its shock absorbing function declines. Because thinner cows seem to be more prone to claw disorders, an unanswered question concerning body condition is the extent to which changes in fat mobilisation pp plays an aetiological role in claw pathology. Cows with a high BCS at calving often suffer from fat mobilisation syndrome with many negative effects. High FFA and BHB as well as low glucose concentrations can be used as markers for negative energy balance, with resulting fat mobilisation syndrome and ketosis (Drackley, Reference Drackley1999; Van Knegsel et al. Reference Van Knegsel, De Vries Reilingh, Meulenberg, Van Den Brand, Dijkstra, Kemp and Parmentier2007). The present study investigated whether changes in energy metabolism pp especially increased mobilisation of fat pp are associated with claw health. For example, a possible mechanism might be the release of mediators, accumulated in fat tissue, which could influence blood vessels in the corium (Fürll, Reference Fürll2000; Andersen, Reference Andersen2003; Fischer, Reference Fischer2004).
Materials and methods
The study group consisted of the same animals from a study on the use of thermography to monitor sole haemorrhages that has already been reported (Wilhelm et al. Reference Wilhelm, Wilhelm and Fürll2015).
Farms and management
The study was carried out in 2008 on 146 Holstein Friesian cows from three dairy farms in eastern Germany (Saxony and Thuringia) with herd sizes of 562 (farm A), 530 (farm B) and 623 (farm C). All lactating cows were kept in free-stall barns and the average milk yield in 2007 was around 9000 kg for all farms. All farms had calving boxes with concrete and straw litter. In farm A, lactating cows were kept on solid mastic asphalt with automatic scrapers and cow mattresses in cubicles leading to a 24 stall rotary parlour. Late lactating and dry cows were kept on rubber instead of mastic asphalt. Heifers were kept on concrete covered with straw litter. Walkways to the milking parlour and the holding pen were slatted concrete. In farm B, the flooring was concrete and cleaned by tractor with a front scraper twice daily and the cubicles straw bedded. Walkways, holding pen and rotary were the same as in farm A. In farm C, the walkways and holding pen had a slatted rubber floor. The 24-stall side-by-side-milking parlour was also rubber coated. The free-stall alleys had rubber flooring and cow mattresses in cubicles. Exceptions were the dry cows and heifers; they were kept in concrete alleys and free-stalls with straw litter. All three farms had an animal:feeding place ratio as well as an animal:cubicle ratio of no more than 1:1. The alleys and cubicles were the same in all three farms and within recommended dimensions.
All cows were offered a total mixed ration (TMR) twice daily in performance-adapted feeding groups (dry group I and II, lactation groups). The diets met the nutrient requirements for cows (GfE, 2010). In all farms the rations were based on grass and maize silage. The dry group I in farm A received both, whereas in farms B and C no maize silage was offered to dry group I. In farm B a performance-adapted dairy concentrate was additionally offered via automatic feeding stations to lactating cows. In all three farms cows stayed in the same feeding and housing group for the examination period until 8 weeks pp. In all farms, cows were milked twice daily. All cows received regular hoof trimming twice a year. The routine claw trimming in farms A and B was performed by the same claw trimmer at the time of dry off and in mid-lactation. Farm C used a different claw trimmer; here the claw trimming was performed independently of the lactation stage, twice a year. All three farms commenced routine claw trimming only after first calving. There was no routine claw trimming done on the study animals for the period of examination.
Data collection and study design
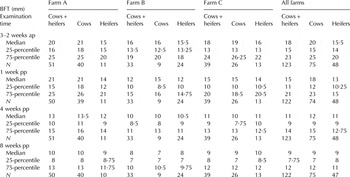
Repeated examinations were undertaken on 146 animals of the three farms. Measurement of back-fat-thickness was undertaken at four examination times on all available animals, though as can be seen from Table 2, two were not available due to bad measurability. The BFT was measured using the method described by Staufenbiel (Reference Staufenbiel1997) at the point with the highest measurable layer of fat in the sacral region between the tuber ischia and tuber coxae (at the transition from the caudal one-quarter to one-fifth) (Schröder & Staufenbiel, Reference Schröder and Staufenbiel2006). A portable ultrasound scanner (Honda Electronics HS-101 V, Aichi, Japan) with a 5 MHz rectal probe was used. As a contact agent, 70% diluted alcohol was used.
The back-fat-thickness (BFT) was measured four times: 3–2 weeks pre- or ante-partum (ap), 1 week pp, 4 weeks pp, and 8 weeks pp and to calculate the reduction in BFT, the value measured at 8 weeks pp was subtracted from the value measured at 3–2 weeks ap. The daily decrease in BFT should not exceed 0·14 mm to prevent health problems resulting from negative energy balance (Schröder, Reference Schröder2000). This implies a cut-off value of 10·3 mm in the examination period (10–11 weeks). Animals were thus classified into two groups: one group with less than and one group with greater than a 10·3 mm decrease in BFT.
Blood was taken from the jugular vein immediately after restraining the animal in the trimming chute or feeding fence. Some 123 cows (75 cows, 48 heifers) were used for analysis: 51 (40 cows, 11 heifers) from farm A, 33 (9 cows, 24 heifers) from farm B, and 39 (26 cows, 13 heifers) from farm C. The 23 cows that were excluded left the farms for different reasons before the end of the 2 months in lactation. All animals that calved in the examination period were enrolled (simple random sampling).
The blood samples were centrifuged at 3800 g for 10 min. The serum was pipetted into microfuge tubes and stored at −18 °C until the laboratory analyses. The analyses were done in the laboratory of the Large Animal Clinic for Internal Medicine of the University of Leipzig. The following “normal” reference ranges were used: <150 µm/l ap and <620 µm/l pp for FFA; <0·62 mm/l for BHB irrespective of stage of lactation; and similarly within 2·22–3·3 mm/l for glucose (Fürll, Reference Fürll2004).
In the first week pp and 8 weeks later, the animals were restrained in the trimming chute and the hoofs were trimmed by one of the research team members (farm veterinarian). An angle grinder with trimming disc with blades (Bosch GWS 11–125 CIE Professional, Bosch, Leinfelden-Echterdingen, Germany, aluminium, 7 hard-metal-cutting blades) as well as a left and right hoof knife were used. Then the ground contact area of the claws was photographed with a digital camera (Kodak V705 Dual Lens Digital Camera, Kodak, Rochester, USA) for later assessment (lens parallel to the ground contact area at a distance of about 30 cm, with flash).
In total, 984 photographs (123 cows – 4 photographs per cow, 2 examinations) were evaluated blinded on two consecutive days by the same person. The following scores were assigned: 0 = no signs of alteration; 1 = slight haemorrhages in a specific area of the sole horn (white line and/or sole-bulb junction); 2 = yellow discolouration, softening of the whole sole horn (waxy appearance); 3 = clear haemorrhages in a specific area of the sole horn (white line and/or sole-bulb junction); 4 = slight haemorrhages of the whole sole horn; 5 = severe haemorrhages in a specific area of the sole horn (white line and/or sole-bulb junction); 6 = clear haemorrhages of the whole sole horn, presence of sole ulcers. Sole in this context means the ground contact area of the claws.
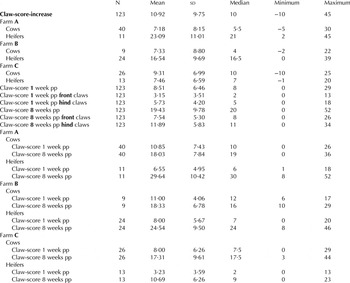
For each animal, all eight claws (fore and hind limbs, lateral and medial) were evaluated and a total (score) was created. Afterwards the difference between the score at 8 weeks pp and the score at 1 week pp, hereafter termed the claw-score-increase, was calculated to obtain a meaningful value of the change in claw situation over the first 2 months of lactation. For example, if the value was in the negative range or 0, then an improvement or no change in the first 2 months of lactation had occurred. The higher the score in the positive range, the more the claw health had decreased.
Statistical analysis
The statistical analyses were done in WinSTAT® for Microsoft® Excel 2007.1. The variables were tested for normal distribution by the Kolmogorov-Smirnov-test. If they were normally distributed, the paired t-test was used to determine differences between the examination times. In the case of non-normally distributed variables, the Wilcoxon-test was used. Relationships between the measured blood parameters and the claw-score-increase were determined by Pearson-correlation. To calculate differences at the same examination time between groups, the unpaired t-test or Mann-Whitney-U-test was used. To test for differences between the 3 farms and between cows and heifers, the ANOVA procedure and, as post-hoc test, the Least Significant Difference test were used. Alpha was set at P < 0·05.
Results
The assigned claw-scores are shown in Table 1. Overall, a deterioration of claw health occurred in the first 2 months of lactation (P < 0·001). The mean claw-score-increase of all animals (cows and heifers combined) was x̄ = 10·92 ± 9·75. In comparison, cows had a mean claw-score-increase of x̄ = 7·93 ± 7·8, and thus fewer claw horn changes in the form of haemorrhages than heifers (x̄ = 15·58 ± 10·7) (P < 0·001). Comparing the three farms, farm C showed the lowest claw-score-increase (x̄ = 8·7 ± 6·8) followed by farm A (x̄ = 10·6 ± 10·9) and farm B (x̄ = 14·0 ± 10·2). The difference between farm C and farm B was significant (P < 0·05) but not between A and B or A and C.
Descriptive statistics of claw-scores

The difference between cows and heifers in farm A was highly significant (x̄cows A = 7·18 ± 8·15; x̄heifers A = 23·09 ± 11·01; P < 0·001), in farm B as well (x̄cows B = 7·33 ± 8·8; x̄heifers B = 16·54 ± 9·69; P < 0·02) but no difference could be found in farm C (x̄cows C = 9·31 ± 6·99; x̄heifers C = 7·46 ± 6·59).
Development of BFT throughout lactation
The BFT values of cows and heifers of the three farms are shown in Table 2.
Descriptive statistics of backfat-thickness (BFT).

A slight (non-significant) increase in BFT occurred from the time of drying off until about 3–2 weeks ap. With the onset of lactation, BFT steadily decreased. The decreases in relationship to the respective previous examination times are highly significant (P < 0·001).
Altogether, cows had a higher starting level of back-fat (P < 0·001) at dry off (3–2 weeks ap in heifers), as well as 1 week pp. After 4 and 8 weeks in lactation, no differences were found between cows and heifers.
A strong correlation (r = 0·839, P < 0·001) was found between the BFT at 3–2 weeks ap and the BFT decrease throughout the first 2 months of lactation (BFT 3–2 weeks ap – BFT 8 weeks pp) (x̃BFT decrease = 8 (5/13) mm).
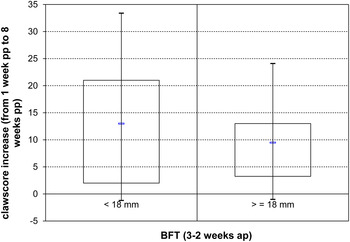
By grouping the animals into low BFT (3–2 weeks ap < 18 mm) and high BFT (3–2 weeks ap ≥ 18 mm) cohorts, a slight, significant difference (P = 0·03) in claw-score-increase was revealed (Fig. 1). Animals in the low BFT group showed more severe claw horn changes.
Differences in claw-score-increase between animals with low back-fat-thickness (BFT) (n = 55) and high BFT (n = 68).

When considering cows and heifers separately, the difference was also seen (but it is not significant).
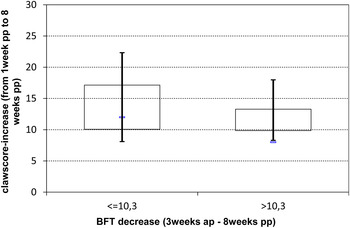
When looking at the intensity of the BFT decrease, it was found that animals that showed a greater decrease were non-significantly less prone to SH than animals that showed a slighter decrease (P = 0·02: Fig. 2). A significant difference was observed for heifers considered separately (P = 0·04), but not for cows considered separately.
Differences in claw-score-increase between animals with a higher back-fat-thickness (BFT) decrease (>10·3 mm) (n = 46) and animals with a lower BFT decrease (<=10·3 mm) (n = 77).

When comparing the three farms, the BFT in farm B was significantly lower compared to farm A at all examination times, and compared to farm C in two examination times (1 week pp, 4 weeks pp). Between farm A and C, only at 4 weeks pp was a significant difference seen (P < 0·05).
A slight and non-significant negative correlation between BFT-decrease and claw-score-increase could be found when considering all animals (−0·17; P < 0·03). When looking at the farms this is confirmed by farm A (−0·25; P < 0·04), but not by the other ones. Also when looking at cows and heifers separately no significant effect was observed.
Animals having FFA concentrations above the reference range in the first week pp had a lower claw-score-increase (x̄above ref. = 8·4 ± 8·7) compared to animals that stayed within the reference range (x̄within ref. = 13·7 ± 10·2) (P < 0·01). (Cows: x̄above ref. cows = 5·7 ± 7; x̄within ref. cows = 10·6 ± 7·4; P < 0·01; Heifers: x̄above ref. heifers = 13·9 ± 9·3; x̄within ref. heifers = 17·2 ± 11·9; n.s.)
Comparing the three farms, a difference was found between farm A and B (P < 0·02) and between C and B (P < 0·001) at 4 weeks pp (x̄A = 534 µm/l; x̄B = 279 µm/l; x̄C = 709 µm/l), and between farm B and C (P < 0·02) at 8 weeks pp (x̄A = 282 µm/l; x̄B = 192 µm/l; x̄C = 402 µm/l).
Between cows and heifers, a difference was found at 1 week pp (P < 0·05) (x̄heifers = 660 µm/l; x̄cows = 892 µm/l).
A similar relationship to that for FFA was found for BHB. The claw-score-increase was significantly (P < 0·0001) higher in animals that stayed within the reference range (x̄within ref. = 14·0 ± 10·5; x̄above ref. = 7·4 ± 7·5). (Cows: x̄above ref. cows = 6·4 ± 6·8; x̄within ref. cows = 10·5 ± 8·8; P < 0·03; Heifers: x̄above ref. heifers = 10·3 ± 9·2; x̄within ref. heifers = 17·5 ± 10·7; P < 0·05).
For the three farms, a difference at 3–2 weeks ap was found between farms A and C, and between A and B (P < 0·001) (x̄A = 0·63 mm/l; x̄B = 0·37 mm/l; x̄C = 0·41 mm/l). In the first week pp (x̄A = 0·97 mm/l; x̄B = 0·54 mm/l; x̄C = 0·68 mm/l), differences between farm A and B and between A and C (P < 0·01) were found. At 8 weeks pp, farm A was different from C (x̄A = 0·72 mm/l; x̄B = 0·58 mm/l; x̄C = 0·46 mm/l) (P < 0·001).
Between cows and heifers, differences at all examination times were found: 3–2 weeks ap (x̄heifers = 0·44 mm/l; x̄cows =0·56 mm/l); 1 week pp (x̄heifers = 0·52 mm/l; x̄cows = 0·92 mm/l); 4 weeks pp (x̄heifers = 0·51 mm/l; x̄cows = 0·71 mm/l); 8 weeks pp (x̄heifers = 0·50 mm/l; x̄cows = 0·66 mm/l) (P < 0·01).
Animals with glucose concentrations within the reference range showed a lower claw-score-increase than animals above the reference range (x̄within ref. = 7·8 ± 6·9; x̄above ref. = 11·8 ± 10·3) (P < 0·05). (Cows: x̄above ref. cows = 8·3 ± 8·3; x̄within ref. cows = 6·6 ± 5·9; n.s.; Heifers: x̄above ref. heifers = 15·6 ± 10·9; x̄within ref. heifers = 15·3 ± 9·6; n.s.).
For the three farms, differences between farm A and B (P < 0·002) and between C and B (P < 0·05) at 3–2 weeks ap (x̄A = 3·75 mm/; x̄B = 4·04 mm/l; x̄C = 3·84 mm/l) as well as 8 weeks pp (x̄A = 3·71 mm/l; x̄B = 3·44 mm/l; x̄C = 3·75 mm/l) (P < 0·005) were found.
Between cows and heifers, a difference at 1 week pp was found (P < 0·001) (x̄heifers = 4·09 mm/l; x̄cows = 3·54 mm/l).
Discussion
In the present study, animals with a higher body condition (represented as a higher BFT) had fewer and less severe SH than animals with a lower body condition. If it is assumed that SH are a preliminary stage of lameness, then these results are in line with those of Espejo et al. (Reference Espejo, Endres and Salfer2006), Hoedemaker et al. (Reference Hoedemaker, Prange and Gundelach2009) and Green et al. (Reference Green, Huxley, Banks and Green2014), who found that under-conditioned cows or cows with BCS < 3 at calving were afflicted more often with lameness than cows with higher BCS, or that cows with BCS < 2·5 had an increased risk of treatment for lameness in the following 4 months. Bicalho et al. (Reference Bicalho, Machado and Caixeta2009) showed that cows with higher BCS had thicker digital cushions with better shock absorbance.
In the present study, animals with high fat mobilisation suffered less from SH than animals with normal fat mobilisation. Thus, a decrease in body fat seems not to have a negative effect on the development of SH in the first 2 months of lactation.
Having demonstrated a strong correlation between BFT at dry off and BFT decline through the first 2 months of lactation, it can be assumed that animals with high fat mobilisation had a higher starting body fat content than animals with normal fat mobilisation. This maybe explains why animals with normal fat mobilisation are more prone to claw disorders. A low body fat content at calving seems to be worse for claw health than is high fat mobilisation in the first 2 months of lactation. This is also confirmed by the observed relationships between blood concentrations of FFA or BHB and claw health. Animals that exceeded the reference values of FFA and BHB in the first week pp, that is animals with metabolic disorders like fat mobilisation syndrome and/or ketosis, had fewer claw changes in the first 2 months of lactation than animals that stayed within the reference range. So, whilst too high fat mobilisation has many negative consequences for the cow, including disturbed reproductive performance, ketosis, milk-fever, mastitis, metritis, dislocation of the abomasum or placental retention (Mulligan & Doherty, Reference Mulligan and Doherty2008), for the claws the outcome seems worse if the cow starts with less body fat reserves in lactation. When considering cows and heifers separately the described relationships can only partially be reproduced (for instance, there is no significance between excessive FFA and claw-score-increase in heifers). This may be due to the absence from the study group of very high BFT heifers.
Considering heifers and cows separately, the connection between higher claw-score-increase and lower BFT decrease is significant only for heifers. Cows with high and normal fat mobilisation showed no difference in the development of SH. Because the heifers started with a lower BFT in lactation than cows, and because the constitution of the digital cushion of heifers is still somewhat rudimentary (Räber et al. Reference Räber, Scheeder, Ossent, Lischer and Geyer2006), it seems that heifers especially suffer when they have a body condition that is too low. Bicalho et al. (Reference Bicalho, Machado and Caixeta2009) found significantly thinner digital cushions in heifers as well. Possibly cows, with their better constituted digital cushion, are better able to compensate for an insufficient body condition affecting the claws.
When comparing the farms it was noted that both the cows and heifers of farm B had the lowest BFT and the lowest FFA as well as the lowest BHB until 4 weeks pp. Low FFA and BHB concentrations suggest a healthy metabolic status, with a low likelihood of fat mobilisation syndrome and ketosis. The finding that the farm with the lowest BFT and FFA/BHB concentrations also had the most SH further supports the results of Espejo et al. (Reference Espejo, Endres and Salfer2006), Hoedemaker et al. (Reference Hoedemaker, Prange and Gundelach2009) and Green et al. (Reference Green, Huxley, Banks and Green2014), if it is supposed that severe SH are followed by lameness causing claw disorders. However, the different ground surfaces and differences in the feeding rations in the three farms and the high proportion of heifers in farm B should be considered as potential factors contributing to the stronger afflictions observed for farm B animals.
Also, ethological considerations should be discussed. In a herd, newly integrated heifers and animals with low body condition scores have a lower rank. This leads to fewer opportunities for adequate rest, and so the claws are more stressed (Phillips & Rind, Reference Phillips and Rind2001; Nordlund & Cook, Reference Nordlund and Cook2008).
The results of the blood glucose analysis are an indication that pp insulin resistance may be contributing to corium changes. Overall, animals with glucose concentrations above the reference value had more SH. There is some evidence that insulin resistance may be connected with laminitis development in horses. For example, Bailey et al. (Reference Bailey, Habershon-Butcher, Ransom, Elliott and Menzies-Gow2008) found an increased incidence of insulin resistance in ponies with laminitis. De Laat et al. (Reference De Laat, Sillence, Mcgowan and Pollitt2012) showed an influence of hyperglycaemia and hyperinsulinaemia on the hoof corium of horses. So, it is possible that the claw corium of cows reacts to hyperglycaemia and hyperinsulinaemia in the same way as in horses. However, the occurrence of insulin resistance cannot be concluded on the basis of a high glucose concentration pp alone. So, a postulated connection to laminitis has to be verified by further study.
Numerous studies revealed a positive influence of rubber flooring on the health of claws (Platz et al. Reference Platz, Ahrens, Bendel, Meyer and Erhard2008; Telezhenko et al. Reference Telezhenko, Bergsten, Magnusson, Ventorp and Nilsson2008; Ouweltjes et al. Reference Ouweltjes, Holzhauer, Van Der Tol and Van Der Werf2009). For optimal claw health, shock absorption seems to be vital. Thus, internal factors such as fat mobilisation affecting the digital cushion as well as external factors such as flooring surfaces and appropriate claw trimming are important to claw health and seem to be able to compensate each other to a certain extent.
Because there were some crucial differences between the farms regarding flooring conditions, feeding rations and other management factors, the results obtained must be considered as preliminary. Moreover, differences in the routine claw trimming (e.g. claw trimmer, quality of claw trimming, time of last claw trimming) might have influenced the results of this study. Further investigation is required to determine more fully the potential influence of energy metabolism on claw disorders. Also, some strong differences between cows and heifers were revealed. However, to be able to specify the influence of age/lactation number and its connection to energy metabolism on the development of SH, further investigation is needed using animal groups that are closer in size. Thus, the observed results should be considered as a first step towards revealing a potential connection between energy metabolism and development of sole haemorrhages.
The results of this study underline the importance of an optimal body condition at calving on claw health. A too low body condition seems to be worse than one that is too high. The negative sequelae of fat mobilisation syndrome were not detectable in the claws in the first 2 months of lactation. It is surmised that the shock absorbing function of the digital cushion increased with higher body fat content, allowing the higher body weight load to be accommodated by the greater cushioning effect of the claws.