I. INTRODUCTION
Carbon dioxide is a greenhouse gas with a vital role in regulating Earth’s surface temperature through heat-trapping from the sun and radiative forcing back to Earth. There is scientific evidence that in the last 10–15 years, alarmingly increased levels of greenhouse gases are causing the Earth to reach record high temperatures in response. 1 Notwithstanding practical implications, a fundamentally sound method to decrease/remove CO2 buildup in the atmosphere is electrochemical (EC) reduction in aqueous media with a catalytic cathode capable of selectively generating hydrocarbon products while excluding hydrogen formation from water electroreduction. Various electrodes derived from main group and transition metals have been deployed for CO2 removal as reviewed elsewhere. Reference Hori, Vayenas, White and Gamboa-Aldeco2,Reference Oloman and Li3 Of these, copper (or oxide-derived copper) is unique in being able to generate C2 and C3 reduction products from CO2. Reference Hori, Takahashi, Koga and Hoshi4–Reference Chen, Handoko, Wan, Ma, Ren and Yeo8 However, it suffers from the handicap that electrocatalytic activity for CO2 reduction decreases rapidly after some tens of minutes of electrolysis. Reference Hori, Murata, Takahashi and Suzuki9–Reference Batista and Temperini12
Efficient CO2 electrolysis requires not only a high catalytic activity but also high CO2 flux to the cathode/electrolyte interface. A three-phase (CO2 gas/solid/liquid) system is known to enhance and extend the EC performance in this regard. Reference Cook, MacDuff and Sammells13 Previous authors have also demonstrated that oxide layers on Cu surfaces derived from copper(I) halide (e.g., chloride) precursors are effective for the selective EC conversion of CO2. Reference Roberts, Kuhl and Nilsson14 The catalyst nanoparticle size and shape were shown to be important factors in ethane and ethylene selectivity. Reference Reske, Mistry, Behafarid, Roldan Cuenya and Strasser15–Reference Roldan Cuenya and Behafarid17
Against this backdrop, we present below systematic studies on the use of electrodeposited copper oxide–copper bromide (Cu2O–CuBr) composite films for the selective EC conversion of CO2 to ethylene. The low solubility of CO2 in aqueous electrolytes was circumvented by the use of gas diffusion layers (GDLs) in a microfluidic electrochemical reactor (MFECR) configuration. Reference Homayuni, Chanmanee, de Tacconi, Dennis and Rajeshwar18 The present study builds upon our recent efforts on the photoelectrochemical and EC reduction of CO2 to various products. Reference Homayuni, Chanmanee, de Tacconi, Dennis and Rajeshwar18–Reference Kecsenovity, Endrodi, Papa, Hernadi, Rajeshwar and Janaky24
II. EXPERIMENTAL SECTION
A. Chemicals, materials and electrodeposition
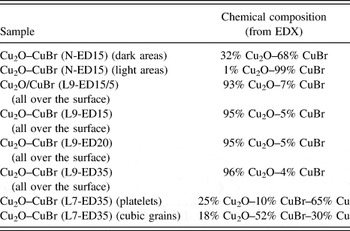
All electrolyte solutions were prepared and all glassware cleaned using deionized water (Millipore MilliQ, 18.2 MΩ-cm; Millipore Corporation, Billerica, Massachusetts). Table I compiles the different films examined in this study for the preparation of Cu2O–CuBr films as well as pristine Cu2O films taken as reference benchmark. Briefly, composite Cu2O–CuBr films were electrodeposited at constant potential for selected times (denoted as “EDτ”) using pH-adjusted aqueous solutions containing copper(II) nitrate (hereafter designated “N” in what follows) or lactate (designated as “L”) and bromide ions in the electrolytic bath. In the case of L-type films, pH 9 or 7 was used with the selected pH adjusted by careful addition of concentrated NaOH or H2SO4; the resulting films are designated below as “L9” and “L7” respectively. The same electrodeposition strategy but omitting bromide in the electrolytic bath was also used for the preparation of pristine Cu2O films as a control for comparison purposes.
Hybrid film composition as determined by EDX analysis.

All electrodeposited films were grown in a conventional three-electrode cell using platinum foil as counterelectrode and Ag/AgCl (satd. KCl) as reference respectively (Fig. S1). A constant potential of −0.4 V (from CHI Electrochemical Workstation 720C, CH Instruments, Austin, Texas) was applied in the respective electrolytic bath which was maintained at the requisite temperature (see below) and the electrodeposited charge (EDQ) was controlled between 2 and 5 C/cm2. The substrate for supporting the films was a GDL electrode (Sigracet 35BC, FuelCellsEtc., College Station, Texas) used as provided by the manufacturer without any chemical treatment before placing its top (dense) face facing the Pt counterelectrode in the electrolytic bath and shielding its back face to avoid any film electrodeposition there.
B. Physical characterization
The surface morphology of the various film samples was characterized using a Hitachi S-5000H field emission scanning electron microscope (SEM; Hitachi Corporation, Tokyo, Japan) operated at an acceleration voltage of 20.0 kV. X-ray diffraction (XRD) patterns were obtained on a Siemens D-500 powder diffractometer (Siemens, Berlin, Germany) with Cu Kα (λ = 1.5418 Å) as the source radiation. Energy dispersive X-ray (EDX) spectroscopy was performed with the instrument accessory and provided the elemental composition of the hybrid catalyst films at selected film spots (see Table I).
C. Electrolysis
Electrolyses were carried out in a custom-designed three-electrode electrochemical cell. Longer-term runs (e.g., 10 h duration) were done with on a custom-made two-electrode gas-tight MFECR with both anode and cathode films grown on the GDL 35 BC as support. Several electrolytes were used and contrasted for the CO2 electroreduction, and in all cases the electrochemical experiments were done either with N2 or CO2 passing through the back of the GDL support (Fig. S2). All potentials used to test the CO2 electrolysis are reported versus RHE (E RHE (V) = E Ag/AgCl (V) + 0.205 V + (0.059 V × pH)) to enable comparison with the literature results. Applied potentials (with a CH Electrochemical Workstation 600C) were from −0.4 to −2.0 V versus RHE.
Carbon dioxide was continuously pumped through the channels located at the back of the GDL/composite catalyst and the gas outlet was connected to a Shimadzu 2014 on-line gas analyzer which was customized for analysis of light hydrocarbons, H2, CO, and CO2 by Custom Solutions Group (Katy, Texas). The custom GC featured a 250 μL sample loop with an automotive valve for sample injection and samples were analyzed every 30 min. Hydrocarbon gases such as methane, ethane, and ethylene were analyzed using an Agilent Al2O3/Na2SO4 capillary column with a flame-ionization detector (FID; Agilent Technologies, San Jose, California). Hydrogen, CO, and CO2 were analyzed using molecular sieve 5A 80/100 and HayeSep Q (80/100 mesh) packed columns with thermal conductivity detectors (TCDs). The carrier gases for the TCD and FID detectors were argon and helium, respectively. The GC data were converted to mass% efficiencies for all of the major electroreduction products.
III. RESULTS AND DISCUSSION
A. Morphologic aspects of the GDL/composite catalyst
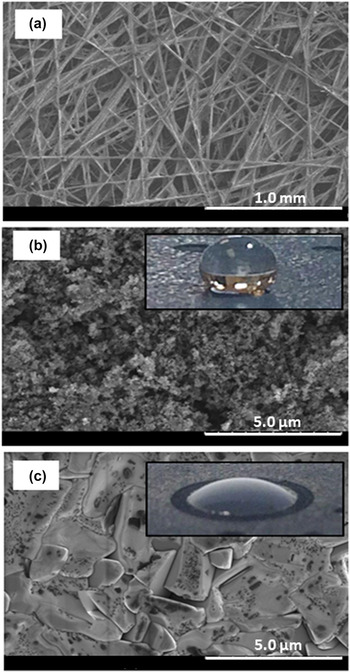
The GDL initially had a paper consistency with thickness: 325 μm, mass: 110 g/m2, porosity: 80% and air gas permeability: 1.5 s. Thus, Fig. 1 shows SEM images of the back [Fig. 1(a)], top of the GDL before [Fig. 1(b)] and after the growth of a Cu2O–CuBr (N-ED30) film [Fig. 1(c)]. The back surface of the GDL clearly was very open [Fig. 1(a)]. Comparison of the bare GDL top with that supporting the Cu2O–CuBr (N-ED30) film [Figs. 1(b) and 1(c)] clearly demonstrated the change from hydrophobic to hydrophilic character triggered by the electrodeposited film (see contact angle photos of a water drop on top of them). We will further address this important feature in the results section below. The surface morphology of the Cu2O–CuBr (N-ED30) film was composed of compact large flat crystals partially covered with small dark entities (see Table I). It is worth noting that the openness of the GDL facilitated CO2 gas passage from the back to its front side to be electroreduced at the hybrid Cu2O–CuBr/electrolyte interface.
SEM images of the gas diffusion layer (Sigracet 35BC GDL) used as support for the electrodeposited composite films. The back and top faces of the GDL are shown in images (a) and (b) respectively, while an electrodeposited Cu2O–CuBr (N-ED30) film on the top face of the GDL is shown in image (c). Contact angle photos of a water drop on top of the bare GDL before (b) and after (c) the growth of the Cu2O–CuBr (N-ED30) film, clearly demonstrated the change from hydrophobic to hydrophilic character triggered by the electrodeposited film.

Lactate species have been commonly deployed for Cu2O electrodeposition. Reference Golden, Shumsky, Zhou, VanderWerf, Van Leeuwen and Switzer25,Reference Wang, de Tacconi, Chenthamarakshan, Rajeshwar and Tao26 The complexing properties of lactate are required during electrodeposition to maintain soluble Cu2+ ions (to be reduced to Cu+) and avoiding chemical precipitation of Cu(OH)2 triggered at any alkaline pH. For L-type films (i.e., grown in the presence of lactic acid), the molar ratio of lactic acid to Cu2+ ion precursor was adjusted to 10, and used at two chosen pHs (9 and 7). The choice of these pH values reflected the facts that (i) the surfactant properties of the lactic acid at pH ≤ 9 are known to promote Cu2O electrodeposited films with preferential (100) crystallographic orientation Reference Wang, de Tacconi, Chenthamarakshan, Rajeshwar and Tao26 ; and (ii) a neutral pH promotes a dominance of n-type semiconductor behavior with high electronic conductivity which is expected to benefit at negative potentials. Reference Wu, Yin, He, Huang, Zhou and Zhang27
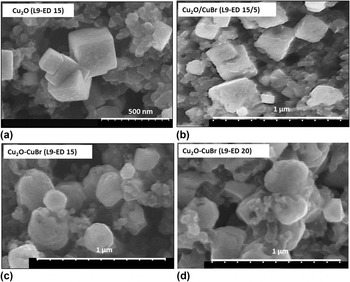
Representative SEM images of films grown from an electrolytic bath containing 0.2 M CuSO4·xH2O + 0.1 M NaBr + 2 M lactic acid at pH 9 are shown in Fig. 2. The pristine Cu2O (L9-ED 15) is shown in Fig. 2(a) to compare with hybrid films prepared sequentially [Fig. 2(b)] and simultaneously [Figs. 2(c) and 2(d)]. The pristine Cu2O film displays intersecting cubic crystals all over the film while the sequential film growth [Fig. 2(b)] shows some crystal erosion as indicated by uneven or rounded corners of the cubic crystals. On the other hand, the simultaneous electrodeposition of Cu2O and CuBr performed at two electrodeposition times [Fig. 2(c) for 15 min and Fig. 2(d) for 20 min] shows that the resulting films were not composed of cubic nanostructures. In fact, Fig. 2 is clear evidence that the {100} cubic lateral planes were only maintained in pristine Cu2O [Fig. 2(a)] and to some extent in the sequentially grown Cu2O–CuBr (L9-ED 15-5) composite [Fig. 2(b)]. Interestingly, no intact cubic crystals (with {100} lateral sides) remained when the bromide precursor was in the electrolytic bath at electrodeposition times ≥15 min [Figs. 2(c) and 2(d)]. Therefore, when the growing cubic Cu2O crystals are exposed during the entire electrodeposition time to the etching effect of bromide in the electrolyte, the resulting films are made of rounded grains which become larger as the electrodepositing time increases [Figs. 2(c) and 2(d)].
SEM images showing the progressive transformation of Cu2O cubic crystals by exposure to 0.1 M NaBr solution during different electrodeposition times. (a) Cu2O grown for 15 min in 0.2 M CuSO4·xH2O + 2 M lactate (b) Cu2O/CuBr containing pre-grown Cu2O (EDτ 15 min) followed by 5 min in electrodeposition bath with bromide (c) Cu2O–CuBr grown for 15 min in 0.2 M CuSO4·xH2O + 2 M lactate + 0.1 M NaBr and (d) same as (c) but grown for 20 min. All electrolytic solutions were adjusted to pH 9 and the deposition potential was −0.4 V.

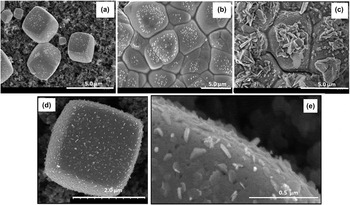
The relative amounts of Cu2O and CuBr in the composite film can be simply tuned by pH control of the lactate bath (see Table I). Thus formation of CuBr could be enhanced by adjusting the pH of the lactic electrolytic bath to 7 instead of 9. The SEM characterization results for L7 films are presented in Fig. 3. These films consisted of macro-sized perfectly perfectly-grown cubic structures [Fig. 3(d)] and contained nanocrystalline rectangular plates incrusted on the surface [Fig. 3(e)]. Besides, L7 films show the striking morphological changes as the EDQ increased [Figs. 3(a)–3(c)]. Compositional assays by EDX also revealed differences in the relative amounts of oxide and bromide relative to the bulk grains but importantly, these films also contained a significant amount of copper unlike the L9 films (see Table I). Other morphological differences between nitrate- and lactate-grown films are worthy of note. In the former case, (111) faces of compact CuBr prevailed [Fig. 1(c)] while in the latter case, perfect cubic entities exposing (100) planes to the electrolyte (Fig. 3) were the norm. XRD data on selected samples are contained in Supplementary Material (see Figs. S3–S5).
SEM images obtained during the growth of composite Cu2O–CuBr (L7-EDτ) films for selected electrodeposition charges: after EDQ = 2 (a, d), 4 (b) and 5 C/cm2 (c). Films were electrodeposited on the Sigracet GDL (35 BC) at −0.4 V (60 °C) using a solution of 0.2 M CuSO4 + 0.1 M CuBr + 2 M lactate adjusted to pH 7. (e) Amplifying the morphology of the platelet incrustations on the cube surfaces.

B. Electrolysis results
The current efficiency for CO2 reduction is known to diminish with decreasing CO2 pressure and at the expense of an increase of H2 evolution. Therefore, in the experiments below, CO2 was constantly forced through the back of the Sigracet GDL at a flow rate in the range: 1–10 mL/min. All data were obtained with the carrier gas flowing through the back channels of the working electrode and thus in contact with the GDL back side which was hydrophobic and free of the hydrophilic Cu2O–CuBr film [Figs. 1(b) versus 1(c)]. The difference in hydrophobicity at the back and hydrophilicity at the top (due to the presence of Cu2O–CuBr film) enhanced transport of freshly-generated hydrocarbon gases to the back of the GDL. This important feature circumvents their accumulation at the electrode top surface which otherwise would have blocked essential catalytic sites thus decreasing the rate of the targeted electrochemical reaction. Reference de Tacconi, Chanmanee, Rajeshwar and Dennis28 Moreover, as aqueous electrolytic media were used, the hydrophobic/hydrophilic properties of the GDL/Cu2O–CuBr cathode also precluded electrolyte ingress to the gas channels located at the back side of the GDL. Reference de Tacconi, Chanmanee, Rajeshwar and Dennis28
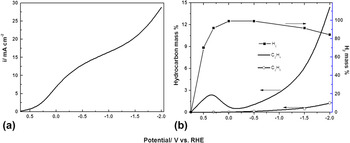
Figure 4 contains representative current density-potential data [Fig. 4(a)] and product evolution profiles as monitored by on-line GC [Fig. 4(b)]. The best performance for ethylene formation occurred at the most negative potentials, although formation was also seen at less negative potentials where CO formation was also detected (data not shown). This latter observation has mechanistic implications as elaborated later. The current was seen to increase with more negative potentials, passing by a slow increase and then growing exponentially at potentials negative of −1.2 V [Fig. 4(a)]. Most interestingly, the amount of C2H4 formation increased significantly in the potential range between −1.0 V and −2.0 V, while H2 formation was seen to decrease proportionally as the potential reached approximately −1.5 V [Fig. 4(b)]. Interestingly, in the −0.2 V/−1.0 V region the current showed almost a plateau [Fig. 4(a)] reflecting a slowdown of H2 formation [Fig. 4(b)].
Current density/potential (a) and product selectivity/potential profiles (b) for composite Cu2O–CuBr (N-ED 15) performing CO2 electrolysis in 1 M KOH solution. These data were obtained with a Sigracet/GDL as support (geometric area = 4.52 cm2) and with a CO2 flow rate of 1 mL/min.

Other relevant findings obtained from the on-line GC detection of products during CO2 electrolysis are as follows:
-
(i) When the carrier gas was nitrogen, the only product detected was hydrogen independently of the gas flow rate; this finding is as expected because there is no CO2 in contact with the working electrode and therefore no formation of hydrocarbons is possible.
-
(ii) Most efficient electrochemical CO2 reduction to ethylene was found in potassium hydroxide as electrolyte and at a concentration of 1 M or higher. Clearly, alkaline media inhibited/delayed hydrogen formation at the cathode. Other electrolytes, such as NaHCO3 and Na2SO4, were found to be less efficient.
-
(iii) Potentials more negative than −0.5 V versus RHE were required to obtain dominance of ethylene among the hydrocarbon products reaching the on-line GC instrument. Other contributor products were: CH4, C2H6, and C3H6. All composite Cu2O–CuBr films also generated H2 gas and the dominance of ethylene versus hydrogen depended on the formulation of the composite film and electrolyte conditions (as elaborated below).
-
(iv) Nitrate-derived (“N”) films were more electrocatalytic for CO2 electroreduction than “L9” films when both were compared in NaHCO3 electrolyte at room temperature. This trend underlined the importance of the CuBr component in the composite film (see, Table I).
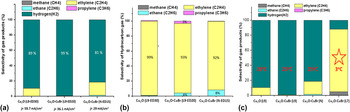
Figure 5(a) compares the product selectivity, as established by on-line GC detection, during 120 min of CO2 electrolysis at room temperature and −1.9 V (versus RHE) using three types of films: Cu2O (L9-ED30), Cu2O–CuBr (L9-ED20), and Cu2O–CuBr (N-ED15). Although the best current performance (∼60 mA/cm2), was found for a Cu2O film electrodeposited from a solution containing lactate at pH 9, the electrochemical reaction generates H2 at 89% mass efficiency and 11% of ethylene [Fig. 5(a)]. When the electrodeposition bath for Cu2O was dosed with bromide in the lactate electrolytic bath, the resulting L9-composite film was found to perform with lower current density (∼36 mA/cm2) and lower formation of hydrocarbons. Finally, the N-hybrid films were found to generate up to 19% mass of hydrocarbons and 81% mass of H2 thus showing improved performance with respect to the Cu2O–CuBr (L9-ED20) film.
Comparison of performance for (a) product selectivity at room temperature, (b) respective hydrocarbon generation and (c) product selectivity at different temperature of three composite Cu2O–CuBr films (L9, L7, and N) performing CO2 electroreduction at −1.9 V (versus. RHE) in 1 M KOH electrolyte at room temperature and at 3 °C. Average current densities for selected films during 120 min of electrolysis are provided in Fig. 5(a). The CO2 flow was 1 mL/min in all cases.

Likewise, Fig. 5(b) shows the hydrocarbon selectivity for the films shown in Fig. 5(a), i.e., leaving aside the amount of hydrogen formed. Interestingly, all films produced ethylene as the major hydrocarbon, but the composite L9 film generated ethane and propylene as minor components while the counterpart film from nitrate showed only ethane as minor component.
A balanced amount of Cu2O and CuBr in the composite film as well as a lower electrolysis temperature (e.g., 3 °C) further promotes ethylene formation from CO2 electrolysis; Fig. 5(c) includes relevant data for L7 type film (see, Table I). The maximum amount of ethylene reached ∼68% for the L7 films at the beginning of the electrolysis and with an average value of approximately 51% throughout the 120 min of electrolysis. Moreover, the average C2H4 production increased for L7 films from 51 to 83% when the electrolysis temperature is kept at 3 °C [Fig. 5(c), last bar]. Thus, a comparison of four electrode compositions for selective ethylene formation is shown in Fig. 5(c). The comparison includes three composite Cu2O–CuBr films of different compositions and a pristine Cu2O film. Thus, on Cu2O (L9), Cu2O–CuBr (L9) and Cu2O–CuBr (N) cathode films, the major gaseous product was hydrogen. However, for the new hybrid Cu2O–CuBr (L7) film, the main product was ethylene which was formed at a current density of ∼53 mA/cm2.
C. Durability over longer electrolysis times
The performance and durability of a GDL/Cu2O–CuBr (L7) cathode was analyzed by emulating durability tests developed for fuel cells. With this aim, a high CO2 flow rate (8 mL/min) through the channels at the back of the GDL was used during continuous CO2 electrolysis for 10 h at −1.9 V versus RHE in 1M KOH electrolyte cooled to 3 °C. The electrolyte flow was kept at 1 mL/min and product formation was sustained remarkably well (Fig. S6). Nevertheless, a slow decrease in electroactivity was observed during this 10 h period of CO2 electrolysis (Fig. S6).
D. Pulsed electrochemical activation (PECA)
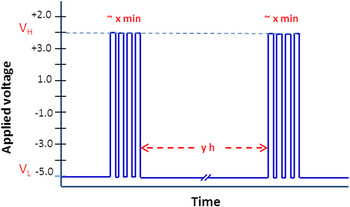
On the thesis that the slow deactivation seen for the cathode (Fig. S6) stems from progressive conversion of the oxide phase to the metallic state, a PECA protocol was developed based on anodic regenerative pulses. The pulse routine (Fig. 6) consisted of rectangular pulses applied periodically (every y hours, with y = 1 to 24) to recover the cathodic current during CO2 electrolysis. The time period (y) in between application of the pulses must also be optimized, as it is necessary to evaluate if it is better to wait long times (i.e., 24 h) and then to do many pulses or to decrease the number of pulses (applied for x min) and to do them more frequently (every hour for instance). The pulse duration and symmetry need to be adjusted as well (from 0.3 to 20 s range). For PECA, the MCFCR was directly connected to a custom-built power supply (instead of a potentiostat) in a two-electrode configuration; i.e., the reference electrode was omitted.
Scheme of the rectangular pulses to be applied periodically to the cathode for re-activation of cathode electroactivity during CO2 electrolysis. Low and high voltage limits for the PECA are defined as V L and V H respectively.

Based on the observation that the highest decrease in current occurred during the first 1–2 h of the process, the PECA routine was applied every hour (instead of after several hours as schematized in Fig. 6) and using 4 pulses with same negative voltage (V L = −5.5 V) and different positive V H (= 1.5, 2.0, 2.5, and 3.0 V) respectively. The results are contained in Fig. S7. Four identical pulses were applied with symmetrical waveforms (10 s at V H and other 10 s at V L). The −5.5 V/1.5 V routine yielded the most satisfactory results in terms of maintaining the film electroactivity for CO2 reduction to ethylene.
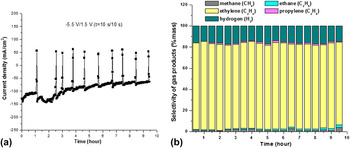
Finally, Fig. 7 shows the stability of current density from a composite Cu2O–CuBr (L7-ED30) film subjected to PECA protocol as well as the GC analysis of gases at the back of the GDL cathode. Figure 7(a) shows the recorded current/time profile which includes the current transients due to the PECA protocol performed every hour. Importantly, the current density was quite steady because of the PECA protocol and the mass% of ethylene was dominant and stable during the 10 h electrolysis [Fig. 7(b)].
Current/time (a) and gas products formed (b) during CO2 electrolysis at 3 °C with a Cu2O–CuBr (L7-ED30) as cathode. The PECA routine was −5.5 V/1.5 V with four (10 s/10 s) pulses.

IV. CONCLUSIONS
This study builds upon previous efforts from our group Reference Homayuni, Chanmanee, de Tacconi, Dennis and Rajeshwar18,Reference Janaky, Hursán, Endrődi, Chanmanee, Roy, Liu, de Tacconi, Dennis and Rajeshwar23 as well related studies on copper oxide–copper chloride in other laboratories. Reference Chen, Handoko, Wan, Ma, Ren and Yeo8,Reference Roberts, Kuhl and Nilsson14,Reference Ogura29 In particular, the present data establish conditions (cathode composite/morphology, electrodeposition history, electrolyte composition, electrolysis temperature) whereby the selectivity in hydrocarbon products (e.g., ethylene/methane ratio) as the extent of hydrogen co-generation can be optimized during CO2 electrolysis. A pulse routine was also developed to periodically re-activate the composite cathode layer for sustained CO2 conversion.
Supplementary Material
To view supplementary material for this article, please visit https://doi.org/10.1557/jmr.2017.134.
ACKNOWLEDGMENTS
This project was supported by a grant from NASA (Award No. NNL 15AA08C).