INTRODUCTION
In November 2014, the Aarhus AMS Centre (AARAMS) received a compact 1MV multielement accelerator mass spectrometry (AMS) system capable of analyzing 3H, 10Be, 14C, 26Al, 41Ca, 129I, 239Pu, and 240Pu from High Voltage Engineering Europa (HVE) (Klein et al. Reference Klein, Mous and Gottdang2006, Reference Klein, van Staveren, Mous and Gottdang2007). For a report on the acceptance tests of all isotopes, see Heinemeier et al. (Reference Heinemeier, Olsen, Klein and Mous2015) and Klein et al. (Reference Klein, Heinemeier, Gottdang, Mous and Olsen2014). This article reports on our progress in 14C analysis.
DESCRIPTION OF THE AMS SYSTEM
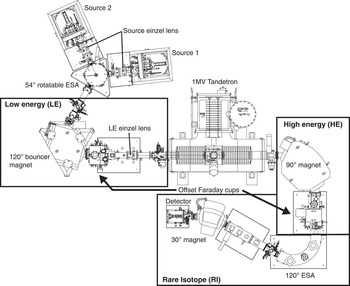
A detailed description of the AARAMS AMS system has been given elsewhere (Klein et al. Reference Klein, Heinemeier, Gottdang, Mous and Olsen2014). Here, we give a short summary with a focus on 14C analysis (Figure 1). The system is equipped with two SO110 solid/gas Cs sputter ion sources, each having a 50-position sample carousel. The ion source is operated at a target voltage of –7 kV, an ionizer potential of –28 kV, and with a Cs temperature of 115°C, yielding a total pre-acceleration potential of 35 kV. The ion source is followed by an einzel lens and a 54° electrostatic analyzer (ESA) set to 3.96 kV, which is also used to switch between the two ion sources. Next follows the low-energy (LE) side 120° magnet that is equipped with a Hall probe for feedback control of the magnet field. It is set to 176.5 mT for mass 13 AMU. The LE magnet chamber is set on different bias voltages (2900 V, 0 V, and –2475 V) for fast switching (bouncing) between the masses 12, 13, and 14 AMU. The stable isotopes are injected for 100 µs, while the rare isotope is injected for 9.75 ms, using most of the injection time. After the LE magnet follows the LE einzel lens and the Tandetron accelerator operating at 1 MV for C+2 analysis. For carbon AMS analysis, we use argon stripper gas at an inlet pressure of 3E-2 mBar. The high-energy (HE) side 90° analyzing magnet is set to 588.0 mT and separates the 12C+2, 13C+2, and 14C+2 ion beams, where after 12C+2 and 13C+2 are measured in two offset Faraday cups. 14C+2 continues through the rare-isotope (RI) beam line, featuring a 120° ESA followed by a 30° magnet set to 577.5 mT before detection. The detector system features a gas-filled ionization chamber with a 10×10 mm2 entrance window and two anodes for ΔE – Eres measurements (Figure 4C). The chamber is filled with isobutane and is operated at 5.5 mBar.
Schematic layout of the 1MV HVE Tandetron accelerator at Aarhus University

RESULTS AND DISCUSSION
We have selected charge state +2 for 14C analysis as an alternative to charge state +1. The maximum yield with charge state +2 is obtained at 1MV acceleration voltage and surpasses the yield for charge state 1+, where the maximum yield is obtained at 0.5 MV (Sung et al. Reference Sung, Hong, Park and Lee2015). However, we will in the near future test and report on the performance of charge state +1 on our AMS system.
Initial tests showed that our existing graphitization system produced graphite of too poor quality for AMS 14C analysis on the new accelerator. The major problem with the existing graphitization system was the oven design, resulting in temperature differences between reactors of up to 100°C. Hence, an effort was made to design ovens that could provide constant and uniform temperatures for all reactors. Furthermore, the initial tests showed too high Li isobaric interference (e.g. Hong et al. Reference Hong, Park, Sung, Woo, Kim, Choi and Kim2010; Heinemeier et al. Reference Heinemeier, Olsen, Klein and Mous2015; Nadeau et al. Reference Nadeau, Vaernes, Svarva, Larsen, Gulliksen, Klein and Mous2015).
New Graphitization System
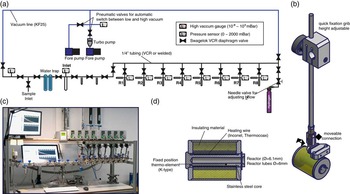
The new graphitization system is constructed using Swagelok VCR components and Swagelok diaphragm valves (DP series) to minimize the use of O-rings and valve dead volume (Figure 2). Where possible, larger parts of the system are welded together to minimize the risk of leaks. The system is equipped with two scroll pumps (Edwards, NXDS10), one for rough evacuation and one to back the turbopump (Edwards, NXDS6). The vacuum system is further equipped with two pneumatic valves for automatic switching between low and high vacuum. The pressure is measured using a wide-range Pirani pressure gauge. Connections to glassware make use of Swagelok Ultra Torr fittings. The overall pressure in the graphitization system when idle is below 1E-4 mBar. During operation, the inlet section can be pumped to ~1E-3 mBar, whereas graphitization reactors can be pumped to below 4.5E-5 mBar. Sample size and reactor pressures are measured using AMSYS (5812) pressure transducers connected to a National Instruments module 9205. The reactor ovens are made of boron-nitride and stainless steel with an Inconel heating wire. Oven temperatures are controlled using Eurotherm 3216 temperature controllers built into a homemade electronic box also providing power. The graphitization system is controlled by a LabView program where also pressure time series of the graphitization reaction are recorded (Figure 2).
(A) Schematic layout of the graphitization system; (B) mounting arm for graphitization oven; (C) graphitization oven; (D) photo of the AARAMS graphitization system.

CO2 for graphitization is admitted through the inlet port and is cryogenically purified using ethanol cooled with liquid nitrogen to a temperature of –80 to –90°C. The sample yield is measured, then a maximum of 1.1 mg C is transferred cryogenically to the reactor (6×50 mm culture tube). If the original sample is larger, it is either chopped or partially discarded. The CO2 is then reduced using hydrogen in excess (2.1× CO2 pressure) with Fe (~2.5 mg) as a catalyst (Vogel et al. Reference Vogel, Southon, Nelson and Brown1984, Reference Vogel, Southon and Nelson1987) at 550°C for 4 hr. Mg(ClO4)2 is used to trap water and is replaced for every second batch (Santos et al. Reference Santos, Southon, Druffel-Rodriguez, Griffin and Mazon2004). The graphitization yield is calculated as final reactor pressure divided by the initial reactor pressure; samples with a yield lower than 90% are discarded. Prior to graphitization, the Fe catalyst is reduced using 400mBar hydrogen at 400°C for 1 hr. Traditionally, quartz glass reactors have been used due to their higher melting point. However, initial tests showed occasionally very high Li counts in the AMS detector. For this reason, we now use reactors of BSi (Pyrex) glass, which appears to yield much lower Li concentrations in the produced graphite (Loyd et al. Reference Loyd, Vogel and Trumbore1991).
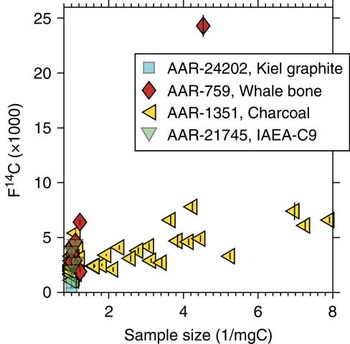
The graphitization system has proven to produce homogeneous graphite yielding a ~25 μA 12C+2 beam in the accelerator. The graphitization system produces 14C/12C background levels well below 5E-15 for various materials (Figure 3). The average 14C age of our standard whale bone pretreated to collagen is 45,170±3170 14C yr calculated as the mean and standard deviation of samples larger than 0.7 mg C, whereas our charcoal background (ABA) provides an average 14C age of 49,000±3124 14C yr. The kauri wood background (cellulose) yielded 45,960±2512 14C yr. The machine background is determined using unprocessed graphite, which yielded 58,650±2032 14C yr.
Size plot of various background materials measured between September 2015 and January 2016. Whale bone (collagen, AAR-759) 14C age=45,172±3170, F14C=0.0036±0.0014 (n=9). Charcoal (ABA, AAR-1351) 14C age=49,016±3124, F14C=0.0022±0.0009 (n=51). IAEA-C9 (cellulose, AAR-21745) 14C age=45,960±2512, F14C=0.0033±0.0010 (n=4). Unprocessed graphite (Kiel graphite, AAR-24202) 14C age=58,647±2032, F14C=0.0007±0.002 (n=4).

7Li+1 Interference
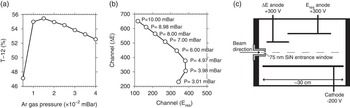
Suppression of the isobaric interference from 7Li2 is very important for 14C measurements at charge state 2+ (e.g. Hong et al. Reference Hong, Park, Sung, Woo, Kim, Choi and Kim2010; Nadeau et al. Reference Nadeau, Vaernes, Svarva, Larsen, Gulliksen, Klein and Mous2015). Hence, we put some effort in optimizing the system settings in order to decrease the number of Li ions reaching the detector. The 12C transmission through the accelerator has been optimized by scanning the stripper gas pressure. Maximum transmission of 12C (T-12) of 55% was observed at a stripper gas pressure of 1.5E-2 mBar (Figure 4A). However, at this low argon pressure, the breakup of 13CH and 7Li2 molecules was not sufficient for the required measurement background. Therefore, we increased the stripper gas pressure to 3.0E-2 mBar to ensure an effective breakup of these molecules in the stripper canal, resulting in a slight decrease of the 12C transmission to 54%. Also, the isobutane detector pressure was varied to ensure maximum isobar separation. With falling detector gas pressure, the ion path gets longer and more energy is deposited at the second anode (Eres). Once the pressure becomes too low, the ions are no longer stopped within the sensitive area and both energy signals drop. Thus, the optimal operating pressure is when the energy is deposited approximately equally in both anodes. The optimal detector gas pressure was found to be 5.5 mBar (Figure 4B–C).
(A) Scanning profile of the carbon transmission (obtained as the measured 12C+2 current divided by the injected 12C– current times one-half to take into account the charge state) as a function of the argon stripper pressure. (B) Optimization of the detector gas pressure. The isobutane pressure is varied from 3 to 10 mBar and the 14C+2 peak centers are plotted. (C) Schematic layout of the gas ionization detector.

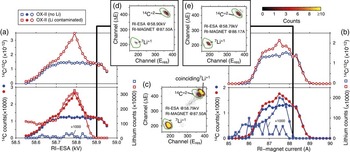
Lithium ions can reach the detector when produced in the ion source as dimer 7Li2 – and subsequent molecule disassociation in the stripper canal, forming two single 7Li+ ions. Because of energy and momentum conservation, the two 7Li ions produced in the breakup of 7Li2 – molecules will equally share the energy of the original 7Li2 molecule. Hence, 7Li+1 will have half the energy of a 14C+2 ion at the exit of the accelerator. The electrostatic rigidity of the 7Li+1 ion and the 14C+2 ion will thus be equal, but the magnetic rigidity of the 7Li+1 ion and the 14C+2 ion will be different because of the small mass difference per nucleon between 7Li (atomic weight 7.016) and 14C (atomic weight 14.003). However, the HE magnet mass resolution is not large enough to completely separate 7Li+1 from 14C+2. Nonetheless, the bending radius of the 7Li+1 ion beam will be slightly larger than the 14C+2 bending radius and the 7Li+1 ion beam will therefore be positioned at the outer side of the reference path. This fact can be exploited to suppress the 7Li+1 ion beam significantly (Hong et al. Reference Hong, Park, Sung, Woo, Kim, Choi and Kim2010). Furthermore, our AMS system is equipped with a 30° magnet (RI magnet) just before the detector, which potentially may help reduce the 7Li+1 ion beam further. It should be noted here that only if both of the Li+1 molecule fragments reach the detector, the resulting event comes close to the 14C region of interest. If one Li is stopped, the detector registers only half of the energy, which is clearly separated from 14C (Figures 5C–E). In the detector spectra, the peak in the lower left corner is 7Li+1, whereas the peak in the upper-right corner close to the 14C region is caused by two coinciding 7Li+1 ions. In itself, the 7Li+1 peak is well separated from the 14C peak. It is only when both 7Li+1 ions reach the detector that 7Li+1 imposes a serious threat against obtaining accurate 14C counts.
Tuning of rare-isotope electrostatic analyzer (RI ESA) and rare-isotope (RI) magnet to avoid Li interference using a clean and Li contaminated OX-II sample. (A) Tuning profile of the RI-ESA. (B) Tuning profile of the BI magnet. Shown in both (A) and (B) are the 14C counts, Li counts, and the 14C/12C ratio. (C) Detector spectrum from a heavily Li contaminated sample acquired with both the RI ESA and RI magnet at their midpoint setting. (D) Detector spectrum from a heavily Li contaminated sample acquired with the optimal RI ESA setting. (E) Detector spectrum from a heavily Li contaminated sample acquired with the optimal RI magnet setting.

An experiment to minimize 7Li interference made use of both the RI ESA and RI magnet. For comparison, we examined a sample heavily contaminated with Li and a sample that previously showed very low Li counts in the detector. In the first experiment, the RI magnet was set to the midpoint of the magnetic field profile, allowing 14C to reach the detector and the RI ESA electric field was scanned (Figure 5A). Figure 4C shows the spectrum at peaking Li interference (VESA=58.79 kV, and RI magnet at 87.5A), while Figure 4D shows a spectrum at a higher ESA setting (VESA=58.9 kV), where 14C is still fully transmitted but the Li interference is drastically reduced. Clearly, the RI ESA midpoint value of 58.79 kV cannot be used without compromising the 14C counts, whereas an RI-ESA electric field value at 58.90 kV substantially reduces the 7Li+1 counts. Coincident 7Li+1 counts are completely removed at this setting (Figure 5D).
A similar experiment is conducted by scanning the RI magnet field with the RI ESA set at the midpoint value (58.79 kV, Figure 5B). When a higher than midpoint RI magnet field value is chosen, the 7Li+1 ions are significantly suppressed even though 7Li+1 coincidence counts are still visible (Figure 5E). Offsetting both the RI ESA and RI magnet significantly reduced the 7Li+1 counts for a sample heavily contaminated with Li from above 300,000 to well below 100. Because of the field control of the RI magnet and because the ion beam position is reproducible within 0.1 mm at the entrance of the RI ESA due to slit stabilization of the 13C+2 ion beam in the HE offset Faraday cup, the settings reported here have been found to be stable over time. Since August 2015, we have not experienced problems with Li during 14C analysis. Prior to this period, Li interference was a serious problem for about 5% of all samples. To further decrease the 7Li+1 ion beam, the X-slit at the entrance to the RI ESA is narrowed.
Current Dependencies of the Transmission of 12C
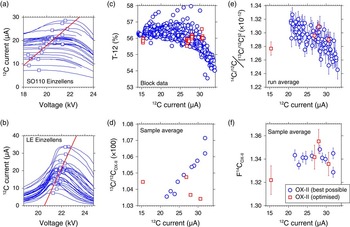
Steerers, analyzers, and other beam-guiding components are flat-top tuned for maximum sensitivity and their settings show no dependency on the source output current. This, however, is not the case for the source and LE einzel lenses, for which the optimal settings do depend on the current (Figures 6A–B). To minimize this effect, we adjust the electric potential of both the source and BI einzel lens to a midpoint value for the expected beam currents. Consequently, we divide our measurement batches into normal-sized (>0.5 mg C) and small-sized samples (<0.5 mg C). Further, we produce all standards to match the sample sizes present in any batch. We use OX-II as our primary standard and add at least two secondary standards to each batch. As a result, we can correct the 13C/12C and 14C/12C data for the output current, as the dependencies are typically linear.
Source einzel lens scanning profiles of the 12C+2 current acquired during tuning of the accelerator in the period from August 2015 to February 2016. (B) LE einzel lens profiles of the 12C+2 current acquired during tuning of the accelerator in period from August 2015 to February 2016. For both (A) and (B), the squared points denote the flat-top midpoint of the profile. The red line (refer to online version for color references) is a linear fit to the flat-top midpoints. (C) The T-12 transmission (0.5 × 12C+2/12C–1) as a function of the 12C+2 current. Blue circles are the transmission value of all block (about 8 blocks constitutes one run) measurements during a routine analysis. (D) The 12C+2 current as a function of the sample (about 8 runs constitute one sample average) averaged 13C/12COX-II ratio. (E) The 12C+2 current as a function of the run averaged fractionation-corrected 14C/12COX-II ratio (for calculation details, please consult Steier et al. Reference Steier, Dellinger, Kutschera, Priller, Rom and Wild2004). (F) F14COX-II as a function of the 12C+2 current. (D–F) Blue circles denote OX-II values acquired during normal routine operation of the AMS system. (C–F) Red squared points are OX-II test samples acquired with the optimal flat-top setting of both the source and BI einzel lenses.

Figure 6A–B show scanning profiles taken over the last 6 months at different currents and different machine settings, which are remarkably consistent. It can be noticed that the optimum point of each profile is a linear function of the 12C+2 current. This linear dependency of the einzel lens electrostatic potential as a function 12C+2 current can be used to predict the optimal source and LE lenses’ electrostatic potential by measuring the 12C+2 current. Figures 5C–F show data from a routine batch where both einzel lenses were set according to the best possible compromise with respect to the expected source yield of the samples. Using these optimized, but fixed, settings results still in a current dependency of the 12C transmission. In particular, currents higher than 25 μA appear to be affected, most probably due to larger space-charge effects at higher beam intensities with a loss of 12C beam through the accelerator as a consequence. Similarly, both the 13C/12C ratio as well as the fractionation-corrected 14C/12C ratios depend on the beam current.
A test to remove this current dependency by adjusting the lens settings used four cathodes of different size. Before running each cathode, the source and BI einzel lens electrostatic potential was set according to a linear fit to the profile top points (Figure 6). With the optimized source and LE einzel lenses, the transmission becomes more or less independent of the 12C+2 current. Furthermore, the 13C/12C ratios and the fractionation-corrected 14C/12C ratios show much more constant values when plotted versus the 12C+2 current. This makes it a promising idea to eliminate the current dependencies of the analysis results by automatically adjusting the source and LE einzel lens determined by the measured 12C+2 current. We are currently in contact with HVE about possibilities for changing the measurement method accordingly.
14C Analysis of International Standards
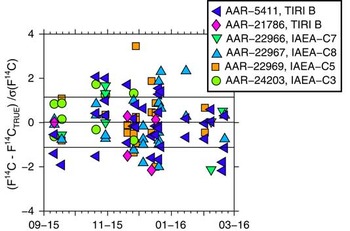
The performance of the 14C system was tested using five different international standards (Figure 7). The TIRI B sample occurs twice as we have two different batches of this standard. All ages are quoted as fraction modern (F14C) and corrected for natural fractionation in accordance with Stuiver and Polach (Reference Stuiver and Polach1977). The isotopic fractionation correction is carried out online using 13C/12C ratios derived from the AMS analysis. For each of the standards, a weighted mean F14C (μw) and standard error (σw) is calculated. Sample sizes range from ~0.1 to 1.1 mg C and are all included in the weighted average value. Reduced χ2 statistics are used to assess if the sample weighted average is normally distributed (Bevington and Robinson Reference Bevington and Robinson2003). The difference between μw is calculated as a z-score z =(μw – true value)/σw. As seen from Figure 7, the majority of the international standards shows z-scores around or less than 1; furthermore, all samples passed the reduced χ2 statistics. In particular, time series with a large number (n>25) of measurements (AAR-5411 and AAR-22967) show very good agreement with their true values.
Time series of international standards covering the period from September 2016 to February 2016: (A) TIRI B standard with consensus F14C=0.5709 (Gulliksen and Scott Reference Gulliksen and Scott1995); (B) IAEA-C7 standard with consensus F14C=0.4953±0.0012 (Le Clercq et al. Reference Le Clercq, van der Plicht and Gröning1998); (C) TIRI B standard with consensus F14C=0.5709 (Gulliksen and Scott Reference Gulliksen and Scott1995); (D) IAEA-C3 standard with consensus F14C=1.2941±0.0006 (Rozanski Reference Rozanski1992); (E) IAEA-C8 standard with consensus F14C=0.1503±0.0017 (Le Clercq 1998); (F) IAEA-C5 standard with consensus F14C=0.2305±0.0002 (Rozanski Reference Rozanski1992).

CONCLUSION
Progress and performance for 14C analysis on the Aarhus HVE Tandetron AMS have been presented. A challenge when running 14C analysis at charge state 2+ is isobaric interference from Li1+. Hence, an effort to minimize isobaric interference from Li1+ has been carried out by optimizing the graphitization procedure. Furthermore, the settings of the high-energy ESA and high-energy 30° second magnet (positioned just before the detector) have been optimized. The machine background is determined using unprocessed graphite to 58,650±2032 14C yr. Processed background materials ranged from 45,100 to 49,000 14C yr. The majority of the international standards agree with their true value within 1.6 standard deviations.
ACKNOWLEDGMENTS
The laboratory technicians at AARAMS are thanked for their help with preparing targets for 14C analysis. Two anonymous reviewers are thanked for their constructive remarks, which helped us to improve the manuscript.