

Introduction
It is well established that brain disorders affect cognition in paediatric populations. The tradition of performance-based assessment to elucidate disorders in attention, language, memory, perception and praxis is firmly in place. This is not the case in the field of social cognition. Indeed, it is only relatively recently that social cognition has been considered an area of competence to be assessed in its own right. While it has long been recognised that many brain disorders, both developmental (e.g., autism spectrum disorders) and acquired (e.g., traumatic injuries, stroke) can impede the normal development of social skills, the assessment of such difficulties was either subsumed under assessment of generic cognitive abilities or overlooked entirely. However, increasingly, researchers have identified social cognition as a distinct area of skill that is crucial to the development of normal social skills during adolescence and which can be disrupted differentially by brain disorders. It is therefore one that needs careful clinical examination.
Social cognition refers to the ability to attend to and identify social cues (such as facial and vocal expressions, gestures and ‘body language’) and to interpret these, in context, to make judgements concerning the emotions, beliefs and attitudes of others and the intentions behind their actions, an ability known as Theory of Mind (ToM). Such abilities are critical not only to understand social behaviour, but also to understand everyday conversation. Communication is a complex phenomenon. There are usually layers of meaning in the simplest conversational exchange, where it is not only what is said, but how it is said, that conveys messages between speakers about the nature of the social interaction, be it a formal encounter, social banter, diplomatic side-stepping and so on. In particular, speakers often convey messages indirectly, such as when hinting, or being sarcastic or ironic, in order to address interpersonal and social goals. The meaning behind such exchanges cannot be understood unless the listener can infer the emotional and mental state of the speaker. Emotion perception is a skill that appears to develop progressively through childhood and early adolescence (Kolb, Wilson, & Taylor, Reference Kolb, Wilson and Taylor1992; McClure, Reference McClure2000). Similarly, the ability to make ToM judgements develops incrementally, linked to growing sophistication in the understanding of indirect language (Winner & Leekam, Reference Winner and Leekam1991). Such maturation intensifies during puberty where social cognition development accompanies the growing preoccupation with social acceptance by peers (Blakemore & Choudhury, Reference Blakemore and Choudhury2006). There are significant gender differences in social cognitive development. Girls demonstrate a consistent advantage over boys for emotion perception from infancy to adolescence (Lee et al., Reference Lee, Krabbendam, White, Meeter, Banaschewski, Barker and Shergill2013; McClure, Reference McClure2000). Young children and pre-pubescent girls also appear to out-perform boys on tasks requiring mentalising ability (Bosacki, Reference Bosacki2000; Hughes & Dunn, Reference Hughes and Dunn1998) as do adult women compared to men (Baron-Cohen, Jolliffe, Mortimore, & Robertson, Reference Baron-Cohen, Jolliffe, Mortimore and Robertson1997).
Social cognition is disrupted in a wide variety of clinical conditions. Indeed, marked impairment in social interaction is a core characteristic of Autism Spectrum Disorder (ASD: American Psychiatric Association, 2000). Consistent with this, children, adolescents and young adults with ASDs and the related disorder of alexithymia generally have poor social cognition (e.g., Baron-Cohen, Reference Baron-Cohen1989; Couture et al., Reference Couture, Penn, Losh, Adolphs, Hurley and Piven2010; Di Martino et al., Reference Di Martino, Ross, Uddin, Sklar, Castellanos and Milham2009; Jellesma, Rieffe, Meerum Terwogt, & Westenberg, Reference Jellesma, Rieffe, Meerum Terwogt and Westenberg2009). Children and adolescents with acquired brain injuries also frequently experience deficits in socio-emotional functioning, peer acceptance and, specifically, social cognition (Beauchamp & Anderson, Reference Beauchamp and Anderson2010; Yeates et al., Reference Yeates, Bigler, Dennis, Gerhardt, Rubin, Stancin and Vannatta2007). For example, adolescents with traumatic brain injuries are often poor at recognising emotions (especially facial affect), a deficit that is not readily accounted for by cognitive function (Tonks, Williams, Frampton, Yates, & Slater, Reference Tonks, Williams, Frampton, Yates and Slater2007b). They also often do not realise when social communication conventions (e.g., bragging) have been violated and do not recognise implied meanings like sarcasm (Turkstra, McDonald, & DePompei, Reference Turkstra, McDonald and DePompei2001). Poor social cognition is also associated with less talk about thoughts and feelings in conversations with peers (Stronach & Turkstra, Reference Stronach and Turkstra2008). Individuals with schizophrenia, likewise, experience deficits in social cognition, including poor understanding of emotional expressions (Edwards, Jackson, & Pattison, Reference Edwards, Jackson and Pattison2002), ToM (Brune, Reference Brune2005; Couture, Penn, & Roberts, Reference Couture, Penn and Roberts2006) and indirect language (Sparks, McDonald, Lino, O’Donnell, & Green, Reference Sparks, McDonald, Lino, O’Donnell and Green2010).
Despite growing interest in the assessment of social cognition in children and adolescents, there are few clinical instruments available, especially in the area of emotion perception. One experimental tool was designed by Dennis and Barnes (Dennis, Barnes, Wilkinson, & Humphreys, Reference Dennis, Barnes, Wilkinson and Humphreys1998) to assess ability to identify real and feigned emotions in schematic line drawings of faces. The real and feigned emotions test is performed poorly by children with ASDs and brain injury in some research (Dennis et al., Reference Dennis, Barnes, Wilkinson and Humphreys1998, Reference Dennis, Agostino, Taylor, Bigler, Rubin, Vannatta and Yeates2013; Dennis, Lockyer, & Lazenby, Reference Dennis, Lockyer and Lazenby2000) but not all (Anderson et al., Reference Anderson, Beauchamp, Yeates, Crossley, Hearps and Catroppa2013).
There are more tests available to assess ToM, either directly or indirectly, in children and adolescents. These usually rely upon responses to written and spoken texts and pictures, as a means to tap understanding of the feelings and beliefs of the story characters. Experimental tasks include the Strange Stories task (Happe, Reference Happe1994), the Faux Pas test (Baron-Cohen, O’Riordan, Stone, Jones, & Plaisted, Reference Baron-Cohen, O’Riordan, Stone, Jones and Plaisted1999), the social problem solving measure (Pettit, Dodge, & Brown, Reference Pettit, Dodge and Brown1988) and the Interpersonal Negative Strategies task (Yeates, Schultz, & Selman, Reference Yeates, Schultz and Selman1991). A similar approach is found in some clinical instruments, e.g., the Pragmatic judgement subtest of the Comprehensive Assessment of Spoken Language test (Carrow-Woolfolk, Reference Carrow-Woolfolk1999), the Social Language Development Test (adolescent form) (Bowers, Huisingh, & LoGiudice, Reference Bowers, Huisingh and LoGiudice2010) and the making inferences subtest of the Test of Language Competence – Expanded Edition (Anderson et al., Reference Anderson, Beauchamp, Yeates, Crossley, Hearps and Catroppa2013; Wiig & Secord, Reference Wiig and Secord1989).
As social cognition is, by definition, an ability to interpret social cues, it is reasonable to question the ecological validity of text or pictorially based approaches to its assessment. One promising approach is the use of virtual reality programs to represent realistic everyday scenarios within which to assess social understanding (Hanten et al., Reference Hanten, Cook, Orsten, Chapman, Li, Wilde and Levin2011). An alternative is to use conventional visual or audiovisual media to assess social cognition in adolescents. There are relatively few such instruments specifically developed for adolescents. One of the few is the Video Social Inference Test (Turkstra, Reference Turkstra2008), which was designed to measure social cognition in adolescents with brain injury. This test uses adolescent actors and has been shown to be sensitive to brain injury but awaits further research as to normative data and standardisation.
As an alternative, some tests that have been developed to assess adult social cognition use audiovisual stimuli and may have applicability to younger people. For example the Florida Affect Battery (FAB; Bowers, Blonder, & Heilman, Reference Bowers, Blonder and Heilman1991) is a comprehensive test of emotion perception which examines both (photographed) facial expressions and tone of voice in 10 subtests involving face and sound affect discrimination, naming, comprehension and selection, matching, or conflict detection (i.e., whether semantic content and prosody conflict) and cross-modal matching. The FAB has been tested with children and has been shown to be sensitive to maturation (Tonks, Williams, Frampton, Yates, & Slater, Reference Tonks, Williams, Frampton, Yates and Slater2007a) and also to the effects of brain injury (Tonks et al., Reference Tonks, Williams, Frampton, Yates and Slater2007b). Its validity in predicting social skills in children and adolescents has not been examined. The Reading the Mind in the Eyes test (Baron-Cohen, Wheelright, Hill, Raste, & Plumb, Reference Baron-Cohen, Wheelright, Hill, Raste and Plumb2001a; Baron-Cohen, Wheelwright, Spong, Scahill, & Lawson, Reference Baron-Cohen, Wheelwright, Spong, Scahill and Lawson2001b) requires participants to choose a term to match mental state based on the eye region of the face. While performance on this task improves with developing maturity (Tonks et al., Reference Tonks, Williams, Frampton, Yates and Slater2007a) and is sensitive to clinical impairments (Baron-Cohen et al., Reference Baron-Cohen, Wheelright, Hill, Raste and Plumb2001a), its construct validity as a measure of ToM has been questioned (Gregory et al., Reference Gregory, Lough, Stone, Erzinclioglu, Martin, Baron-Cohen and Hodges2002; Johnston, Miles, & McKinlay, Reference Johnston, Miles and McKinlay2008).
Another option is the The Awareness of Social Inference Test (TASIT) (McDonald, Flanagan, & Rollins, Reference McDonald, Flanagan and Rollins2011) which is an audiovisual-based tool that was designed to provide an ecologically valid assessment of social cognition for adults with traumatic brain injury (McDonald, Flanagan, Rollins, & Kinch, Reference McDonald, Flanagan, Rollins and Kinch2003). TASIT has three parts (1) Emotion Evaluation Test (EET); (2) Test of Social Inference (Minimal) (SI-M); and (3) Test of Social Inference (Enriched) (SI-E) – each with alternate forms for re-testing. Where Part 1 taps understanding of emotional expression from integrated dynamic facial, vocal and gestural cues, Parts 2 and 3 assess recognition of more subtle emotional states, as well as theory of mind and understanding of pragmatic inference. Part 2 is ‘minimal’ because there are no additional cues apart from the dialogue and demeanor of the speakers. Part 3 is ‘enriched’ due to the provision of a prologue or visual edit that gives extra information regarding the true state of affairs.
TASIT has proven to be sensitive to deficits in social cognition in adults with traumatic brain injuries (McDonald & Flanagan, Reference McDonald and Flanagan2004; McDonald, Flanagan, Martin, & Saunders, Reference McDonald, Flanagan, Martin and Saunders2004; McDonald et al., Reference McDonald, Flanagan, Rollins and Kinch2003; McDonald & Saunders, Reference McDonald and Saunders2005), and predictive of real-world social functioning (McDonald et al., Reference McDonald, Flanagan, Martin and Saunders2004). It is also sensitive to social cognition deficits in individuals with schizophrenia (Kern et al., Reference Kern, Green, Fiske, Kee, Lee, Sergi and Nuechterlein2009; Kosmidis, Aretouli, Bozikas, Giannakou, & Ioannidis, Reference Kosmidis, Aretouli, Bozikas, Giannakou and Ioannidis2008; Sparks et al., Reference Sparks, McDonald, Lino, O’Donnell and Green2010), ASDs (Mathersul, McDonald, & Rushby, Reference Mathersul, McDonald and Rushby2013), fronto-temporal dementia (Kipps, Nestor, Acosta-Cabronero, Arnold, & Hodges, Reference Kipps, Nestor, Acosta-Cabronero, Arnold and Hodges2009; Rankin et al., Reference Rankin, Salazara, Gorno-Tempinia, Sollbergera, Wilson, Pavlica and Miller2009) and right-hemisphere lesions (Blake, Reference Blake2009; Fournier, Calverley, Wagner, Poock, & Crossley, Reference Fournier, Calverley, Wagner, Poock and Crossley2008).
TASIT has also been used to examine deficits in social cognition in adolescents with TBI (McDonald et al., Reference McDonald, English, Randall, Longman, Togher and Tate2013), where it proved to be sensitive to deficits in social communication, as described by both adolescents with brain injury and their parents. It was also sensitive to IQ and injury severity in the clinical group. Thus, despite the fact that TASIT was designed for adults and uses scenes of adult actors in everyday encounters, it appears to be suitable as an instrument to measure social cognition in adolescents. The purpose of the following study was to provide more comprehensive normative data for TASIT in typically developing adolescents than available at the time of publishing the TASIT manual, and to examine the psychometric validity of TASIT for adolescents by comparing performance on Form A and B of the test. It was also designed to provide information regarding the construct validity of TASIT for adolescents, by examining performance patterns with increasing age from 13 to 15 years and according to gender. Specifically, it was hypothesised that TASIT performance would improve with chronological age across these early adolescent years, although possibly not meet adult levels of performance. It was also hypothesised that girls would out-perform boys. Finally, given the language demands of TASIT, the effects of familiarity with English were explored.
Methods
Participants
A total of 665 students were recruited from six high schools in the Sydney metropolitan area between 2002 and 2014. The high schools involved were: two single-sex government schools, one coeducational government school, and three single-sex Catholic schools. Participants were excluded if they or their parents reported any of the following: a history of brain injury or other neurological condition; learning or intellectual disability; developmental delay; an Autism Spectrum Disorder or Asperger's disorder diagnosis; diagnosed psychiatric conditions; uncorrected vision and/or hearing impairments.
Materials
The Awareness of Social Inference Test (TASIT; McDonald et al., Reference McDonald, Flanagan, Rollins and Kinch2003) is an ecologically valid and clinically sensitive measure of simple emotion perception and complex social cognition with established adult norms in healthy and various clinical populations (e.g., traumatic brain injury, schizophrenia and dementias). Participants are required to integrate cues from various sources (e.g., facial expressions, prosody, gesture and social context) to interpret the emotions, beliefs and intentions (i.e., ToM) and conversational meanings imparted by target characters in videotaped conversational interactions. All scripts and response probes in TASIT use simple language (see Appendix A for an example of a script) suitable for schoolchildren. Specifically, according to two well-recognised metrics of readability (Kincaid, Fishburne, Rogers, & Chissom, Reference Kincaid, Fishburne, Rogers and Chissom1975), TASIT scripts were rated 97.7/100 (for Flesch Reading Ease), indicating that they could be understood by an average 11-year-old native English speaker and 1.2 (using the Flesch–Kincaid Grade Level), which indicates that a native English speaker would need 1.2 years of formal education on average to understand the text. There are two equivalent Forms (i.e., versions), A and B, each of which consists of three parts, as follows.
Part 1: The Emotion Evaluation Test comprises 28 short video clips portraying one of six basic emotions (happy, sad, fear, disgust, surprise and anger) or no emotion (neutral); the scripts are all semantically neutral and are enacted by method actors who invoke the genuine emotion in themselves as part of the scene. Participants circle the emotion (from seven randomly ordered choices) that best corresponds to what the character is feeling.
Part 2: Social Inference – Minimal comprises 15 video clips depicting sincere and sarcastic interactions between two actors; the sarcasm items are further divided into simple sarcasm, whereby a neutral dialogue is made sarcastic by the demeanour of the speaker, and paradoxical sarcasm, whereby the script (also enacted sarcastically) makes no sense unless it is understood to be sarcastic, e.g., Gary says ‘Hard at it I see’ and Michael responds ‘I am having a break!’.
Part 3: Social Inference – Enriched comprises 16 scenes of similar type scripts to that in Part 2 but which also contain a visual edit or prologue that conveys additional information about the true state of affairs before or after the dialogue of interest. Eight of the scenes depict sarcastic exchanges and the other eight depict one speaker lying to another, usually in order to be kind. Comprehension in both Parts 2 and 3 is tapped via forced-choice responses (yes/no/don't know) to four response probes per item. These ask questions about what the speakers are: (1) feeling, i.e., their emotional states; (2) thinking, i.e., their beliefs and knowledge about the situation (first-order ToM); (3) doing, i.e., what they intend their conversational partner to think or feel as a result of the interaction (second-order ToM); and (4) saying, i.e., whether they want the literal or non-literal meaning of their message to be believed.
In addition to TASIT, all participants’ parent(s) also completed a screening questionnaire about their child(ren), which asked for information about their child(ren)'s age and level of education completed, neurological and mental health history, sensory problems, language and ethnic background. The questionnaire was administered in order to characterise the sample demographics, identify ineligible participants or potential confounding variables.
Procedure
Ethics approval was sought and obtained to conduct research in New South Wales government and Catholic schools. Researchers from the University of New South Wales (UNSW) contacted principals from ethics-approved schools via letter and subsequently by telephone call to introduce the research and discuss the school's willingness to participant. Mutually convenient testing times were then arranged with principals agreeing to participate. Information sheets and consent forms were distributed to students by their class teacher; students were asked to complete these and give a copy to their parents to review and sign. Parents also completed a screening questionnaire about their child(ren). Only students who returned signed copies of the consent forms – theirs and their parents’ – were allowed to participate.
All testing was done in schools by visiting UNSW researchers who were experienced with administering TASIT. Participants were tested in their class groups during normal lesson times. Depending on timetabling and staff availability, testing lasted between one and two class periods (approximately 40–50 min each). Thus, participants completed one, two or three parts, taken from Form A and/or B; there were no instances where participants completed the same part from both forms. TASIT was administered in line with instructions outlined in the revised manual (McDonald et al., Reference McDonald, Flanagan and Rollins2011) and videos were played on DVD players. Researchers paused the DVD between clips to allow participants time to indicate their responses on their response sheet; for Parts 2 and 3 researchers also read aloud each of the four questions one-by-one for participants. To discourage response sharing, participants were reminded that the research was ‘not a test’ and that their thoughts were the most important part of the research. Upon testing completion, participants were debriefed and thanked for their time and effort.
Data Analysis
Statistical analyses were conducted using IBM SPSS Statistics 22. Descriptive and frequency analyses were used to characterise sample demographics. A series of independent sample t-tests compared performance on Parts 1, 2 and 3 of Forms A and B of TASIT. Analyses of variance (ANOVAs) with planned contrasts (Helmert) were used to compare the performance of adults and adolescents (13-, 14- and 15-year-olds) and younger and older adolescents (13- versus 14- and 15-year-olds; 14- versus 15-year-olds) on Parts 1, 2 and 3 of Forms A and B of TASIT. Finally, analyses of covariance (ANCOVAs), controlling for age, were used to test for gender differences and English language familiarity effects (polynomial contrasts) on performance on Parts 1, 2 and 3 of Forms A and B. Given the large number of planned contrasts, a more conservative p value of .01 was adopted for these analyses. For all other analyses, p < .05 was treated as statistically significant.
Results
Sample Characteristics
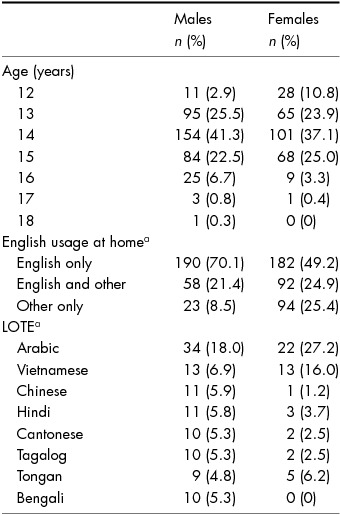
Of the total sample (N = 665), 20 participants (3.0%) met at least one exclusion criterion, resulting in a final sample of 645. Demographic characteristics for the final sample are summarised in Table 1. Recruited participants mainly came from single-sex Catholic schools (boys: n = 145, 22.5% and n = 142, 22%; girls: n = 122, 18.9%), followed by single-sex government schools (boys: n = 144, 22.3%; girls: n = 78; 12.1%) and a coeducational government school (n = 9, 1.4%). The final sample comprised slightly more males (n = 373, 57.8%) than females, and was mostly aged 13 to 15 years old (13: n = 160, 24.8%; 14: n = 255, 39.5%; 15: n = 152, 23.6%) with a relatively small number of participants aged younger than 13 (n = 39, 6.0%) or older than 15 (n = 39, 6.0%). The majority of the sample spoke only English at home (n = 372, 58.0%), followed by English and another language (n = 150, 23.4%), and another language only (n = 117, 18.3%). Six students did not report their language background. The most commonly spoken languages at home other than English, included: Arabic (n = 56, 8.7%), Vietnamese (n = 26, 4.0%) and Chinese/Cantonese (n = 24, 3.7%).
Demographic Characteristics of the Final Sample (N = 645) for Males and Females Separately

aPercentages based on valid percentages; LOTE, Languages Other Than English spoken by ≥5% of male and/or female samples.
The performance of 464 students (69.8% initial sample) who reported speaking English at home (including those who spoke more than one language at home) and who were aged between 13 and 15 was then examined for age and gender effects and used to create norms for Parts 1–3. Students who were younger than 13 or older than 15 were excluded as there were too few available students in these age groups to provide meaningful normative data.
Performance According to Age
Performance on the different parts of TASIT (Forms A and B) for the different age groups is depicted in Tables 2–5. For comparison, mean performance of adults taken from the TASIT manual (McDonald et al., Reference McDonald, Flanagan and Rollins2011) is also included.
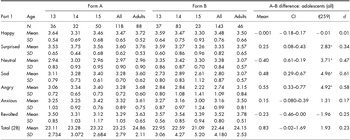
Part 1: Emotional Evaluation Test: Means and Standard Deviations by Age for Each Emotion, Forms A and B, CI = 95% Confidence Interval; t = Independent Sample t-statistic, *p < .01

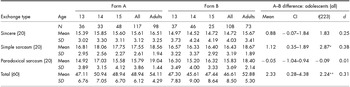
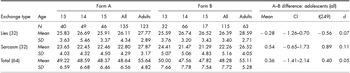
Part 2: Social Inference (Minimal): Means and Standard Deviations by Age for each Exchange Type, Forms A and B, CI = 95% Confidence Intervals; t = Independent Sample t-statistic, *p < .01, **p = .026

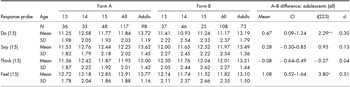
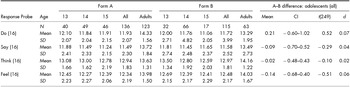
Part 2: Social Inference (Minimal): Means and Standard Deviations by Age for each Probe for Forms A and B, CI = 95% Confidence Intervals; t = Independent Sample t-statistic, *p < .01, **p = .023

Part 3: Social Inference (Enriched): Means and Standard Deviations by Age for each Exchange Type, Forms A and B, CI = 95% Confidence Intervals; t = Independent Sample t-statistic, *p < .01

Part 1
Performance on Part 1 of TASIT (Emotion Evaluation Test) is depicted in Table 2. Total scores on Forms A and B were marginally statistically equivalent (p = .055); however, more variation emerged on the parallel subtests. Specifically, in Part 1, Surprise, Angry and Sad items were easier on A than B, and Neutral items were easier on B than A. In almost all cases the difference was .5 or less of one point (out of a maximum of 4). Analysis of performance across the four ages (13, 14, 15, adult) for Forms A and B confirmed that, in both cases, performance improved with age. This was, however, primarily to do with the superior performance of the adults compared to the adolescents on both Form A and B (see Table 7). Comparisons between individual age groups in adolescence revealed no differences for either Form of Part 1.
Part 2
Overall performance for Part 2 (sincere items, simple sarcasm and paradoxical sarcasm) is depicted in Table 3 while performance on the four different probe types (collapsed across subtests) is depicted in Table 4. Analyses revealed a significant difference between total scores of Forms A and B, such that Form A participants performed slightly better than Form B (2.33 points out of a total of 60: Table 3). Within the different exchange types, simple sarcasm items for Form A appeared slightly easier than those for Form B. Meanwhile within the response probes, Do and Feel questions of Form A were slightly easier than those of Form B.
Analysis of scores on Forms A and B confirmed that, once again, performance improved with age. Adults performed better than adolescents overall on Forms A and B (see Table 7). Moreover, older adolescents (14- and 15-year-olds) were better than younger adolescents (13-year-olds) overall (F(3,231) = 13.85, Ψ = 3.72, p = .003), at recognising paradoxical sarcasm (F(3,231) = 21.51, Ψ = 1.92, p = .003) and at making inferences about what a character was trying to say or make another character do (F(3,231) = 17.97 and 19.41, Ψ = 1.54 and 1.17, p = .002 and <.001). On Form B, adults were better than adolescents at recognising sincerity, simple and paradoxical sarcasm (F(3,130) = 5.33, 6.50 and 5.62, Ψ = 3.31, 2.86 and 2.79, p < .001), and making inferences in response to all (Do, Say, Think and Feel) probe types (F(3,130) = 11.62, 7.90, 4.28 and 7.48, Ψ = 2.85, 2.16, 1.66 and 2.30, p ≤ .001). On Form B, unlike Form A, no differences were observed between the different adolescent age groups.
Part 3
Overall performance for Part 3 (sarcasm and lies) is depicted in Table 5 while performance on the four different probe types (collapsed across subtests) is depicted in Table 6. Forms A and B were statistically equivalent for total scores, as were scores across the two exchange types (lies and sarcasm) and four response probe types (Do, Say, Think and Feel). Analysis of overall scores for Forms A and B confirmed that performance on Part 3 also improved with age. Adults performed better than adolescents overall on both Forms A and B (see Table 7); however, comparisons of the adolescent age groups revealed no differences in performance on either Form A or B.
Part 3: Social Inference (Enriched): Means and Standard Deviations by Age for each Probe for Forms A and B, CI = 95% Confidence Intervals; t = Independent Sample t-statistic, *p < .01

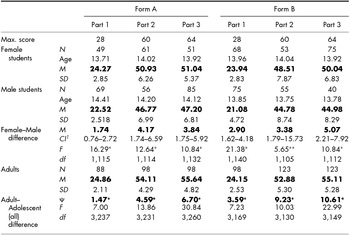
Means and Standard Deviations for Adolescents by Gender, F = ANCOVA F Statistic, Ψ = Contrast Estimate (Helmert), CI = 95% confidence intervals; df = degrees of freedom, *p < .01; **p = .019

1Mean differences and CIs are estimated based on raw scores. F values are estimated on covariate adjusted means.
Performance According to Gender
The overall performance of girls and boys for Parts 1, 2 and 3 of TASIT (Forms A and B) are depicted in Table 7. Once again, only those who spoke English exclusively, or in combination with another language, at home, were included. For comparison, the adult normative data are replicated in the bottom rows.
The effects of gender on each Part of TASIT were examined entering age as a covariate to control for varying ages of students tested on each Part. Gender effects emerged on all total scores, such that, after controlling for age, adolescent girls performed significantly better than adolescent boys on both forms of Part 1, Part 2 and Part 3.
Familiarity with English
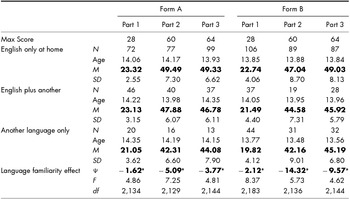
In Table 8, scores are presented for Forms A and B of TASIT, according to familiarity with English: English-only speakers (n = 342, age: M = 13.94, SD = .744), speakers of English and another language at home (n = 121; age: M = 14.09, SD = .764) and those who speak another language at home exclusively (n = 97; age: M = 13.87, SD = .731). Comparisons between students based upon usage of English were conducted using age as a covariate to control for the varying ages in each group. These analyses revealed that scores decreased linearly as English usage decreased on all three parts of Forms A and B.
Overall Performance on Parts 1, 2 and 3 of TASIT (Forms A and B) Broken Down into Groups Based on Familiarity with English. Ψ = Contrast Estimate (Linear), df = Degrees of Freedom, *p < .01

Discussion
The Awareness of Social Inference Test (TASIT) is an established test of social cognition with a number of advantages over other existing tools. It uses naturalistic audiovisual scenes with professional actors engaged in everyday conversations, thus providing dynamic social cues, including facial and vocal expressions and gesture. TASIT uses these stimuli to probe core aspects of social cognition, including emotion perception and theory of mind judgements, ranging from simple mental judgements (such as beliefs and feelings) to more complex mental judgements (such as what one speaker intends towards another). It also examines understanding of irony and deception.
This study aimed to develop normative data for the use of The Awareness of Social Inference Test (TASIT) with adolescents, and to examine its construct validity as a measure of social cognition in this age range. The performance of 464 students who spoke English at school and at home, aged between 13 and 15, was used to create norms, while comparison with a further 97 students (aged 13–15) who had limited use of English at home enabled us to examine the effects of English familiarity. These adolescent norms extend those published in TASIT's manual (McDonald et al., Reference McDonald, Flanagan and Rollins2011) and provide an opportunity to look at adolescent performance on all parts of TASIT.
The first thing of note is that although these adolescents were 15 or younger, they were able to interpret TASIT scenes relatively accurately. On average they achieved a score of 22–23 (Form B and A, respectively) out of the maximum of 28 on Part 1. This was only 1.61 (Form A) and 1.71 (Form B) points less than their adult counterparts, a difference of around 6% of total scores. On Part 2 they were also relatively accurate, achieving 49/60 for Form A and 47/60 for Form B. Relative to Part 1, these scores were somewhat lower than that produced by adults, i.e., a difference of 5.17 (Form A) and 6.27 (Form B) points, equal to a drop of roughly 9–10%. Performance levels were similarly good for Part 3, i.e., an overall score of 49/64 (Form A) and 48/64 (Form B), which represented a drop of around 7 points relative to adults for both forms, or approximately 11%. TASIT was defined as a criterion-referenced test, such that those with a normal range of social skills are expected to perform highly. The relatively good performances by young adolescents on all three parts of TASIT are consistent with this expectation, and suggest that it is a suitable measure for this age range. Furthermore, Form A and B scores were generally equivalent, except for some minor differences, and produced similar patterns to those seen in the adult normative study (McDonald et al., Reference McDonald, Flanagan, Rollins and Kinch2003). Specifically on Part 1, the two forms were equivalent and the same emotion categories were easier on A than B and vice versa in both adolescents and adults. On Part 2, adults produced comparable total scores on both forms whereas adolescents scored higher overall on Form A than B, although the magnitude of the difference (2.3/60) was trivial. At a subtest level, the adolescents had higher scores on the simple sarcasm items on Form A relative to Form B, whereas for adults the paradoxical sarcasm of Form A was easier. In Part 3 also, both adolescents and adults produced statistically equivalent scores for Forms A and B. Where the adolescents produced comparable scores for both lies and sarcasm across the two forms, in adults, sarcasm was slightly easier on Form A and lies on Form B.
The pattern of performance on TASIT in adolescence also attests to its construct validity. The finding that Part 1 was performed so well by the adolescents suggests that emotion perception ability, as measured by TASIT, is relatively well developed by early adolescence. This is consistent with other research showing that accuracy in judging emotions in photographs of faces develops incrementally through childhood (Rosenberg-Kima & Sadeh, Reference Rosenberg-Kima and Sadeh2010), reaching adult levels by 13–14 (Kolb et al., Reference Kolb, Wilson and Taylor1992), although this is not a universal finding, with other research indicating continuing improvement in emotion perception into the early 20s (Williams et al., Reference Williams, Mathersul, Palmer, Gur, Gur and Gordon2009). Certainly, the results from this study suggest that, when realistic, multi-modal audiovisual emotions are used as stimuli, there was a great deal of overlap in emotion perception abilities within our group over the ages of 13–15, such that no incremental pattern was seen and such that performance neared (but did not quite reach) adult competencies.
Our results demonstrated that the adolescents were also relatively accurate when assessing social interactions that conveyed indirect meanings, such as sarcasm and lies (Parts 2 and 3), although, once again, not as accurate as adults and seemingly not as accurate as when simply judging emotions. Given the rather complex questions asked of each scene in Parts 2 and 3, it is reasonable to question the role of developing language and cognitive abilities in producing these slightly deflated scores. Language ability has a moderate to large effect on theory of mind tasks in younger children (under the age of 7 years) (Milligan, Astington, & Dack, Reference Milligan, Astington and Dack2007) and development in executive function has also been speculated to contribute to increasing competence on mentalising tasks (Blakemore, Reference Blakemore2008). However, language, along with working memory and processing speed, appears to be less of a contributor by the time children are 12–15 years old (Vetter, Leipold, Kliegel, Phillips, & Altgassen, Reference Vetter, Leipold, Kliegel, Phillips and Altgassen2013). The alternative possibility is that, consistent with our hypotheses, TASIT performance on Parts 2 and 3 reflected improving competence in theory of mind judgements with age and, relatedly, improving ability to understand non-literal meanings in conversation. Certainly, there is evidence for growing sophistication of mentalising ability through early childhood (Wimmer & Perner, Reference Wimmer and Perner1983) and into adolescence (Choudhury, Blakemore, & Charman, Reference Choudhury, Blakemore and Charman2006; Keulers, Evers, Stiers, & Jolles, Reference Keulers, Evers, Stiers and Jolles2010). This is paralleled by the increasing competence in this age range for understanding non-literal meanings. Children from 6 to 9 years of age begin to grasp sarcasm and irony (Dews et al., Reference Dews, Winner, Kaplan, Rosenblatt, Hunt, Lim and Smarsh1996) and also deception (Demorest, Meyer, Phelps, Gardner, & Winner, Reference Demorest, Meyer, Phelps, Gardner and Winner1984). There is evidence that this capacity continues to be refined into adulthood (Demorest et al., Reference Demorest, Meyer, Phelps, Gardner and Winner1984), although studies vary with respect to when full competence is reached and whether different kinds of mental judgements (e.g., sarcasm versus deception) develop before others. As evidence of the construct validity of TASIT for adolescents, we found an incremental pattern on Part 2 (Form A) such that older adolescents (14- and 15-year-olds) out-performed the 13-year-olds when understanding paradoxical sarcasm. They were also better than their younger counterparts at recognising intention (the ‘do’ and ‘say’ questions tapping second-order theory of mind judgements), which is consistent with our prior work demonstrating a strong relation between second-order theory of mind and understanding sarcasm (McDonald & Flanagan, Reference McDonald and Flanagan2004). This pattern was not, however, observed in the simple sarcasm scenes of Part 2, or in sarcastic subsets of Form B or Part 3 (both forms). In each of these cases there was overlap between the different age groups, such that no differential performance according to age was observed, except for the superior performance of the adults in every case.
To some extent, the overlap in scores between adolescents aged 13–15 on the majority of subtests of TASIT is not surprising. While prior research leads us to anticipate a developmental trajectory in social cognition abilities during adolescence, it is also the case that there are enormous individual differences in the rate and timing of maturity physically, emotionally and cognitively during this time. Some 15-year-olds may not have yet achieved the same level of maturity in skills and abilities, including social cognition, as that seen in precocious 13-year-olds. A similar lack of age effects on social cognition measures for older adolescents has also been reported (Taylor, Barker, Heavey, & McHale, Reference Taylor, Barker, Heavey and McHale2013). Some inkling of these individual differences is seen in the variability of the adolescent scores relative to those of the adults. Indeed, across all parts of TASIT and alternate forms, the estimated SD of each adolescent age group was larger than that of the adults by 27–100%. Such variance, combined with the fact that we grouped adolescents loosely according to age in years (rounded) rather than months, will diminish the likelihood of seeing systematic differences according to age groups separated by a single year. Overall, the finding that the adolescents did perform significantly less well than the adults attests to the construct validity of TASIT as an instrument sensitive to developing levels of competence in social cognition. In view of the significant overlap of scores in the 13- to 15-year-old age group, combined with the inherent variability of maturation during this period of development, TASIT normative scores for adolescents may be most useful as aggregated scores rather than broken down into years.
The uniform reliance on audiovisual scenes in TASIT stimuli provides a unique opportunity to consider the developmental trajectory of different facets of social cognition side by side. Studies into the developmental trajectory for both emotion perception and for social cognition vary as to whether they suggest one kind of ability matures before the other. Part of the problem with such research is that there are few, if any, comparable measures of emotion perception and ToM. Most studies examining these two constructs, either individually or combined, use disparate means such as written text, cartoons and static photographs (Demorest et al., Reference Demorest, Meyer, Phelps, Gardner and Winner1984; Dews et al., Reference Dews, Winner, Kaplan, Rosenblatt, Hunt, Lim and Smarsh1996; Keulers et al., Reference Keulers, Evers, Stiers and Jolles2010; Kolb et al., Reference Kolb, Wilson and Taylor1992; Vetter et al., Reference Vetter, Leipold, Kliegel, Phillips and Altgassen2013; Williams et al., Reference Williams, Mathersul, Palmer, Gur, Gur and Gordon2009). In contrast, TASIT's use of similar audiovisual scenes to assess both emotion perception and ToM affords an opportunity to observe how these different abilities mature in adolescence relative to adults. Examination of mean differences between adults and adolescents for Part 1 versus Parts 2 and 3 suggests that adolescents aged 13–15 are closer to having mastered simple emotion perception than they are at understanding complex theory of mind and speaker intentions.
As further evidence of its construct validity, we found that girls, regardless of age, outperformed boys on all parts of TASIT. The advantage afforded by being female was consistent and clear, and far outweighed the ambiguous improvements with chronological age. This further attests to the construct validity of the test and is consistent with prior research demonstrating a female advantage in children, adolescents and adults (Baron-Cohen et al., Reference Baron-Cohen, Jolliffe, Mortimore and Robertson1997; Bosacki, Reference Bosacki2000; Hughes & Dunn, Reference Hughes and Dunn1998; Lee et al., Reference Lee, Krabbendam, White, Meeter, Banaschewski, Barker and Shergill2013; McClure, Reference McClure2000). It does suggest that gender-based norms are important to consider with TASIT and other measures of social cognition.
Finally, because TASIT is heavily reliant upon good English comprehension, it was important to examine the effects of familiarity with English. As is apparent in Table 8, there was a significant decrement in performance on TASIT as English familiarity decreased. For those who spoke English exclusively at home, the difference between the performance of adolescents and adults was only 1–2 points on Part 1 and 4–6 points on Parts 2 and 3. In contrast, for those adolescents who were much less familiar with English, speaking another language at home exclusively, decrements from the adult scores were much larger, i.e., 4 points on Part 1 and 10–12 points on Parts 2 and 3. This means that the adolescents with least familiarity with English trailed behind their native English-speaking peers by 6–13% across the various subtests. The performance of these adolescents suggests they were still able to perform the tasks well above chance levels and their scores provide some tangible information regarding the effects of lack of English familiarity.
In conclusion, this study provides a comprehensive normative data set for adolescent performance on TASIT. By sampling a large group of students aged 13–15 it was revealed that TASIT can be suitable for use with adolescents and produces scores that were predictable and that were only 6–11% lower than adult normative data. TASIT yielded patterns of performance in terms of age and gender that attest to its construct validity as a measure of social cognition in adolescence. Given the inherent variability of adolescent development, few differences were found in the scores of adolescents of 13, 14 and 15, and it is recommended that aggregate scores for this age group are more useful for normative comparisons. On the other hand, gender differences were strongly apparent and, consequently, gender-based normative comparisons are recommended. Table 8 provides such aggregated, gender-based norms. The students who contributed to these normative data were almost exclusively from single-sex schools, so there is the possibility that these gender-based disparities might be somewhat different when girls and boys are schooled together. Future research needs to address this question. It is also important to note that that there are facets of social cognition that are not assessed by TASIT. Moral reasoning and empathy, for example, are facets of social cognition that undergo critical development in adolescence and can be disrupted in acquired brain injury (Beauchamp, Dooley, & Anderson, Reference Anderson, Beauchamp, Yeates, Crossley, Hearps and Catroppa2013). Given the wide variety of clinical conditions that can interrupt normal social cognitive development, and the importance of such skills for the development of social competence, it is important that we have valid assessment tools for adolescents. While TASIT does not assess all aspects of social cognition, it has proven validity in numerous adult clinical conditions and also in adolescents with TBI (McDonald et al., Reference McDonald, English, Randall, Longman, Togher and Tate2013). In the context of the normative data from this study, TASIT may provide a useful adjunct assessment of social cognition in adolescence.
Appendix A: Example script
(Husband and wife couple, Ruth and Gary, are in a room, Gary is reading a book. Ruth places a washing basket full of clothes on the table beside him, which she starts folding.)