1. Introduction
In nature, social insects and animals such as ants, bees, and birds are fascinating creatures that exhibit a sort of swarm intelligence through their behavior as a group. Inspired by these creatures, swarm robotics aims to coordinate a large number of robots. In contrast to multirobot systems, swarm robotics systems are characterized by local sensing and communication capabilities and decentralized control [Reference Khaldi and Cherif1]. The desired properties of a swarm robotics system are robustness, scalability, and flexibility. Robustness is the ability to accomplish the task at hand despite the malfunction of some robots, scalability is coping with a large swarm size without affecting performance, and flexibility is the capacity to adapt the swarm behavior to the nature of the task [Reference Şahin, Şahin and Spears2–Reference Schranz, Umlauft, Sende and Elmenreich5].
One of the most promising applications of swarm robotics is environmental monitoring. This application requires the discovery and evaluation of wildfires as soon as possible. We formulate this problem in the context of collective decision-making, where the swarm of robots must agree about the features present in the environment (e.g., wildfire, water, vegetation). Collective decision-making has been studied extensively within the swarm robotics community [Reference Reina, Valentini, Fernández-Oto, Dorigo and Trianni6–Reference Lee, Lawry and Winfield9]. This interest comes from the necessity of achieving agreement between the swarm members to accomplish tasks beyond the capability of one member of the swarm. One robot, through its sensing capabilities, can locally estimate the environment. However, features generally are spread over a large area. Therefore, it is clear that having a swarm of robots exploring the environment together is more beneficial.
Collective decision-making is of paramount importance for a swarm of robots [Reference Nedjah and Junior10, Reference Hamann11]. In particular, consensus achievement wherein the swarm objective is to make a common choice among several options. Valentini et al. [Reference Valentini, Ferrante and Dorigo7] divided consensus achievement problems into discrete and continuous. In the former, the number of options is finite (e.g., site selection). In the latter, the number of options is infinite (e.g., flocking directions). The authors introduced the best-of-n problem as an abstraction of the structure and logic of discrete consensus achievement problems where n represents the number of options. In their proposed taxonomy, the best-of-n problem is categorized according to the option’s quality and cost. In this work, we investigate the collective perception problem in which the option qualities are asymmetric and the option costs are symmetric.
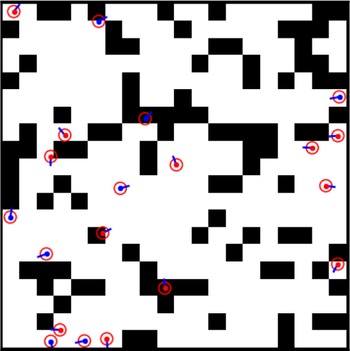
In the collective perception problem (see Fig. 1), a robot swarm task is to identify the prevalent feature among different features available in the environment. An abstraction of this scenario is described by Valentini et al. [Reference Valentini, Ferrante, Hamann and Dorigo12], an arena that contains two colors representing the features present in the environment. The objective of the swarm is to identify the best option (i.e., The color with the highest fill ratio in the arena). This scenario has served as a benchmark for different approaches where the performance is mainly assessed by a tradeoff between speed and accuracy to reach a consensus on the best option.
Overview of the arena with a swarm of 20 simulated e-puck robots.

Several challenges characterize the collective perception problem, despite the prominent findings. Self-organization using positive feedback is one ingredient [Reference Valentini, Ferrante, Hamann and Dorigo12–Reference Camazine, Deneubourg, Franks, Sneyd, Theraula and Bonabeau14]. Positive feedback is the process of influencing others’ opinions about the best option when we are confident about our own opinion. However, this can lead to the spread of a wrong opinion, and the challenge is to prevent its propagation. Another challenge is spatial correlations between observations, as shown by Bartashevich et al. [Reference Bartashevich and Mostaghim15], that the difficulty of the collective perception problem is not related mainly to the difference in the fill ratio between the colors but also to the distribution of the colors in the arena. The more spatial concentration of the features, the more time it takes for the swarm to achieve consensus about the best option.
Most of the literature on collective perception by a swarm of robots focused on selecting the best option/color in the environment rather than estimating its ratio. So far, the only work that tackled it as a discrete collective estimation problem is the work of Shan et al. [Reference Shan and Mostaghim16] using Bayesian multihypothesis testing, wherein the robots try to find the range of the fill ratio corresponding to the correct fill ratio of the features in the environment. However, their method requires a larger bandwidth since each robot communicates multiple hypotheses about the fill ratio to its neighbors [Reference Shan, Mostaghim, Dorigo, Hamann, López-Ibáñez, García-Nieto, Engelbrecht, Pinciroli, Strobel and Camacho-Villalón17].
To tackle these limitations, we propose maximum likelihood estimate sharing (MLES) as a novel decentralized and distributed method to resolve the collective estimation problem by estimating the option’s quality using the maximum likelihood estimation technique (MLE) and introducing a self-organized mechanism for modulating positive feedback. Its minimal memory, computational, and communication bandwidth requirements make it suitable for minimalist robot swarms. Furthermore, we evaluate our method and compare its performance with the existing methods in the literature. It demonstrates outperforming performance in terms of tradeoff speed-vs-accuracy and better sustainability to noise.
This paper is organized as follows. Section 2 gives a brief overview of the related works on collective perception in swarm robotics. Section 3 describes our proposed method and its mathematical ground. In Section 4, we present the results of our experiments. Section 5 discusses our findings and the limitations of different methods. Finally, Section 6 summarizes our work and gives some future directions.
2. Related works
In this section, we review the existing approaches in the literature related to the collective perception problem by categorizing them according to their theoretical foundation into three categories: Voting models, Bayesian statistics, and evidence theory.
2.1. Voting models
The first applied strategies to the collective perception problem are the direct modulation of majority-based decisions (DMMD), the direct modulation of voter-based decisions (DMVD), and the direct comparison (DC) [Reference Valentini, Ferrante, Hamann and Dorigo12, Reference Valentini, Brambilla, Hamann and Dorigo18]. These strategies are applied whenever the robot meets its neighbors and tries to reconsider its opinion. Both DMMD and DMVD are self-organized approaches because they modulate positive feedback according to the estimated quality. In the DMMD strategy, the robot chooses the majority opinion, whereas, in the DMVD strategy, it chooses a random neighbor’s opinion. In the DC strategy, the robot compares its opinion with a random neighbor. If the opinion of its neighbor is better, it switches its opinion to this latter. Experiments showed that self-organization in DMMD and DMVD, through positive feedback modulation, is beneficial for the swarm as it helps the swarm members reach a consensus quickly.
Shan et al. [Reference Shan, Heck and Mostaghim19] investigated two ranked voting systems, the single transferable vote (STV) and The Borda count (BC). In STV, the options are ranked according to the robot’s preference. The option with the least number of votes is discarded iteratively until a single option holds the majority. In BC, options are ranked according to the robot’s preference. The least preferred option gets fewer points than the most preferred option. Experiments showed that BC gives the best performance compared to STV and DC strategies.
2.2. Bayesian statistics
Motivated by the success of decentralized Bayesian information fusion in many fields, Ebert et al. [Reference Ebert, Gauci, Mallmann-Trenn and Nagpal13] proposed a Bayesian algorithm for decision-making. In this framework, they modeled the fill ratio as a Beta distribution. Then, each robot works as a Bayesian estimator. While it is moving, it updates its posterior with both the newly collected observations and the transmitted observations of its neighbors. Once the posterior’s cumulative distribution of a robot passes the credible threshold for an opinion, it becomes committed to this opinion. Then, it uses positive feedback to push undecided robots to make a decision.
Shan et al. [Reference Shan and Mostaghim16] proposed a distributed Bayesian belief sharing (DBBS) method. This method is based on hypothesis testing to estimate the fill ratio of two features. In this method, possible percentages of the fill ratio were mapped into hypotheses. Then, the robots start updating their belief about each hypothesis using both the newly collected observations from the environment and the shared beliefs of their neighbors. Although the DBBS method outperforms the DMVD and DC methods, it has a communication overhead compared to them. Furthermore, it depends on two tuned parameters, a decay coefficient to decay the old received beliefs and a rate parameter to control positive feedback.
2.3. Evidence theory
Bartashevich et al. [Reference Bartashevich and Mostaghim15] studied the problem of spatial correlations in collective perception using evidence theory, which is known to be effective in situations with uncertainty and conflict. Such a situation is typical in the problem of collective perception. In this study, the authors focused on information pooling and explored eight fusion operators for combining evidence from other robots. Their results showed that the proportional conflict redistribution rule gives the best performance and lets the swarm reach a consensus with certainty in the presence of up to five options.
3. Methodology
In this section, We will describe the problem setup and our proposed strategy, MLES, to estimate the fill ratio of the environment.
3.1. Experimental setup
We follow the same setup of Valentini et al. [Reference Valentini, Brambilla, Hamann and Dorigo18] to define the collective perception scenario. This setup is intended to be a general setup that addresses a class of problem scenarios in collective decision-making where the quality of features/options is asymmetric (black or white), and the cost of evaluating features/options is symmetric (i.e., The time required for a robot to perceive the color of the arena surface is the same for both black and white). As a result, we gain in strategy generality because the designed strategy for this setup applies to different problem scenarios of the same class. We have a square arena of size 2 × 2 meters bounded by four walls. The floor is composed of tiles of different colors, and each tile is 0.1 × 0.1 meters wide. Thus, we get 400 tiles forming the arena. These tiles are randomly scattered to abstract the presence of different features in the environment (see Fig. 1). The swarm of robots exploring the arena consists of 20 e-puck robots [Reference Mondada, Bonani, Raemy, Pugh, Cianci, Klaptocz, Magnenat, Zufferey, Floreano and Martinoli20]. An e-puck robot has a maximum velocity of 16 cm/s and has a ground sensor to detect the color of the ground beneath its body and a range and bearing IR communication module to communicate with neighbors, which is set to 50 cm. Here we assume a peer-to-peer communication paradigm where messages are broadcasted to the neighboring robots. Moreover, the robots are anonymous. This scenario is more challenging since it differs from ref. [Reference Bartashevich and Mostaghim15], which relies on bidirectional communication to perform opinion pooling to achieve consensus. To perform our experiments, we use the Python simulation environment in ref. [Reference Shan and Mostaghim16].
3.2. Motion control
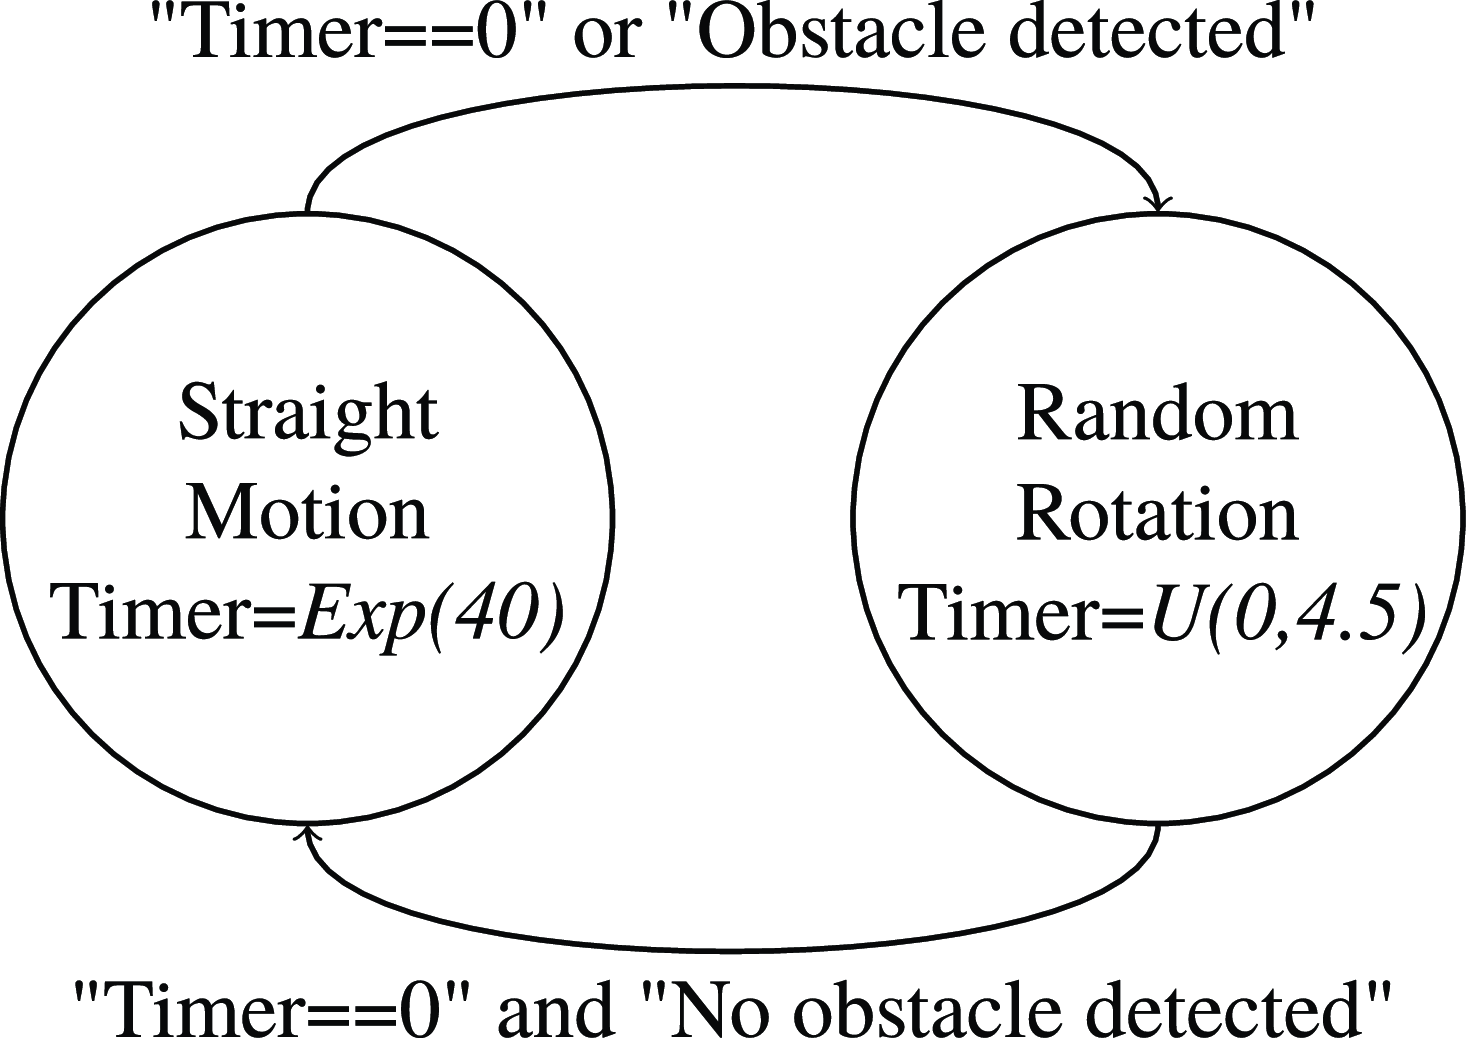
Each robot in the arena performs a random walk according to the probabilistic finite state machine shown in Fig. 2. A robot performs either a straight motion or a random rotation on the spot. The straight motion duration is sampled from an exponential distribution with a mean of 40 s
 $ \text{Exp}(40)$
. The random rotation consists of turning randomly on the spot for a duration that is sampled from a uniform distribution between 0 and 4.5 s
 $\it{U}(0, 4.5)$
. Robots use their proximity sensors to detect obstacles and find an opposite direction that is free of obstacles in order to avoid collisions with other robots and the arena’s walls.
Motion control: probabilistic finite state machine (PFSM) controlling each robot motion.

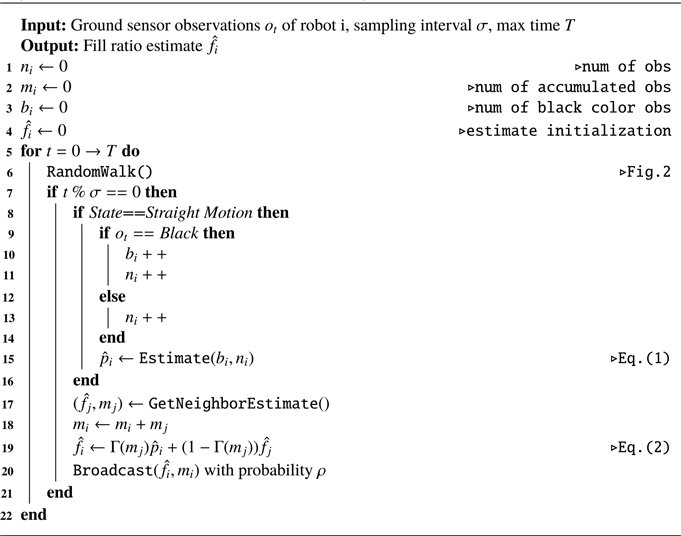
Maximum likelihood estimate sharing (MLES)

3.3. Algorithm description
Each robot
 $i$
in the swarm is controlled by Algorithm 1. In the beginning, the robots are positioned randomly in the arena, which they explore by performing a random walk (line 6) (Section 3.2). While moving, they observe the ground underneath and collect samples within a defined sampling interval
 $\sigma$
(line 7). The sampling is performed while the robot is in the straight motion state because when a robot is in the random rotation state, it collects correlated samples of the same tile. During straight motion, the robot locally estimates the proportion of black samples (line 15) (Section 3.3.1). At each control loop, it collects the collective estimate
 $\hat{f}_j$
and the number of collected samples
 $m_j$
of a random neighbor
 $j$
. Then, it aggregates its estimate
 $\hat{p}_i$
with this latter to form an updated collective estimate of the arena (line 19) (Section 3.3.2). Finally, it broadcasts this estimate to its neighboring robots (line 20).
In summary, our algorithm for the collective perception problem is composed of two components: an individual estimate wherein each robot makes its own estimate of the environment and a collective estimate wherein the individual estimates are aggregated through local communication between each robot and its neighbors.
3.3.1. Individual estimate
Each robot collects an observation at each time step which might be a black or white tile. We model this kind of binary outcome with a Bernoulli distribution, where
 $X$
denotes a binary random variable representing each observation. The Bernoulli distribution is a parameterized distribution with one parameter
 $p$
that represents, in our case, the probability of
 $X=1$
(black color observation).
 \begin{equation*}X \sim \text{Bernoulli}(p)\end{equation*}
Under the assumption that the samples (i.e., ground sensor observations) are independent and identically distributed (iid), we estimate the parameter
 $p$
of our distribution using the MLE as follows:
 \begin{equation*} \hat {p} = \mathop{\text{arg max}}\limits_p{ L(p) } \end{equation*}
Then, we substitute the probability mass function (pmf) of the Bernoulli distribution and derive the logarithm of the likelihood function
 $LL$
 \begin{equation*}L(p)=\prod _{i=1}^n{p^{X_t}(1-p)^{1-X_t}}\end{equation*}
 \begin{equation*}LL(p)=\sum _{i=1}^n{{X_t}\log {p}+(1-X_t)\log {(1-p)}}\end{equation*}
By differentiating the log-likelihood function with respect to
 $p$
and setting the derivative equal to 0, we obtain
 \begin{equation} \hat{p}=\frac{\sum _{t=0}^nX_t}{n} \end{equation}
We conclude that the individual estimate represents the number of black color observations (
 $X_t=1$
) over the total number of observations.
3.3.2. Collective estimate
Each robot
 $i$
in the swarm benefits from the surrounding robots as it collects their estimates to form a collective estimate
 $\hat{f_i}$
of the arena fill ratio. The collective estimate
 $\hat{f}_i$
is the aggregation of two pieces of information: the robot’s individual estimate
 $\hat{p}_i$
and a random neighbor’s shared estimate
 $\hat{f}_j$
, where
 $j \in \mathcal{N}_i$
, and
 $\mathcal{N}_i$
is the set of neighboring robots within its communication range. At each control loop, it is updated iteratively using the weighted sum of the individual estimate and the shared estimate as follows:
 \begin{equation} \hat{f}_i = \Gamma (m_j) \hat{p}_i + (1-\Gamma (m_j))\hat{f}_j \end{equation}
Where
 $\Gamma$
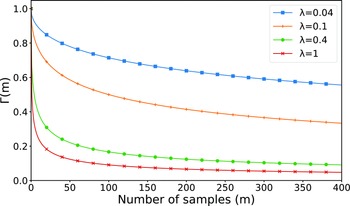
represents a weighting function that abstracts the robot’s amount of confidence to either estimate. In a nutshell, the collective estimate encompasses information accumulated from the neighboring robots and by the robot itself. The weighting function acts as a decay function that gives more weight to the robot’s individual estimate and less weight to the neighbors’ estimate in the beginning. Then, as the robots collect more samples and each robot’s individual estimate is passed to the other robots over time, more weight is given to the shared estimate. In such a way, we guarantee accuracy at the beginning of the decision-making process. After that, we gain speed by promoting the influence of the shared information from neighbors.
In contrast to ref. [Reference Shan and Mostaghim16], the weighting mechanism employed in our method affects the robot’s individual and shared estimates in a complementary way. As more weight is given to one quantity, less weight is given to the other one. Furthermore, the decay coefficients are applied as static values, whereas here, we apply a dynamic decay function to the individual estimate
 $ \hat{p}_i$
, which is formulated as follows:
 \begin{equation*}\Gamma (m_j)=\frac {1}{1+\lambda \sqrt {m_j}}\end{equation*}
Where
 $m_j$
is the number of samples accumulated by a neighbor j and
 $\lambda$
is a decay parameter that controls the decay rate. Its value is between 0 and 1 (see Fig. 3). This function gives less weight to a neighbor’s estimate when this latter is computed using few samples and more weight as this estimate is computed using more samples. As a result, the estimate is more impacted using confident neighbors’ estimates and less impacted using less confident ones.
Plot of the decay function
 $\Gamma (m)$
for various values of its parameter
 $\lambda$
.

In accordance with the literature [Reference Valentini, Brambilla, Hamann and Dorigo18], the decay function modulates positive feedback by amplifying the disseminated estimate of confident robots and inhibiting that of less confident ones in a way that is proportional to the confidence in the shared estimate. Using this self-organized mechanism, MLES can sustain noisy information and promote the dissemination of the best estimates.
3.4. Communication bandwidth
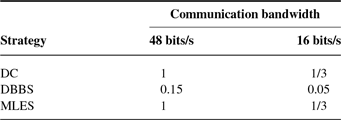
It has been shown in ref. [Reference Shan, Mostaghim, Dorigo, Hamann, López-Ibáñez, García-Nieto, Engelbrecht, Pinciroli, Strobel and Camacho-Villalón17] that the communication bandwidth affects the performance of different collective decision-making algorithms. Thus, we set the same communication bandwidth for all considered algorithms: DC, DBBS, and MLES, by following the same assumptions on the format of the exchanged messages between robots. Using c++ data types, a short int is 16 bits in size and a float is 48 bits in size. In the DC strategy, each robot communicates a message of size 48 bits, that contains its decision index (short int) and the estimated quality (float). MLES has the same message size of 48 bits, which contains the neighbor’s number of accumulated observations (short int) and the estimated fill ratio (float). In DBBS, the robots communicate a message of size 320 bits, which represents the number of the fill ratio hypotheses (
 $H\times$
float), where
 $H=10$
. To set the same communication bandwidth for all algorithms as in ref. [Reference Shan, Mostaghim, Dorigo, Hamann, López-Ibáñez, García-Nieto, Engelbrecht, Pinciroli, Strobel and Camacho-Villalón17], a probability of broadcasting
 $\rho$
is employed. Since DC and MLES have the same message size, this probability is applied only to the DBBS algorithm with a value of
 $\rho = 0.15$
. This makes all algorithms work with the same communication bandwidth of 48 bits/s.
3.5. Performance metrics
For the purpose of assessing the performance of our method and the considered decision-making methods for comparison, we use three performance metrics used by ref. [Reference Shan and Mostaghim16] to measure the speed, accuracy, and failure rate. These metrics are more informative compared to the exit probability and the consensus time metrics used in refs. [Reference Valentini, Brambilla, Hamann and Dorigo18, Reference Strobel, Ferrer and Dorigo21].
Mean consensus time: gives the speed of the decision-making strategy, which is computed as the number of time steps until all the swarm members reach the same opinion. The mean value is obtained by averaging over the number of trials n.
Mean absolute error: measures the accuracy of the decision-making strategy, which is computed as the difference between the swarm estimated decision and the correct decision. This is also averaged over the number of trials.
 \begin{equation*}\text{MAE} =\frac {\sum _{i=0}^n \lvert \hat {d}_i-d_i \rvert }{n}\end{equation*}
Failure rate: represents the proportion of trials where the swarm members fail to achieve consensus within the time limit of 1200 s.
Since we aim to estimate the fill ratio rather than selecting the best feature in the environment, the fill ratio range
 $[0,1]$
is sliced into 10 bins of 0.1 intervals each. If the robot estimate
 $\hat{f}$
is within the interval
 $[f-0.05, f+0.05]$
where
 $f$
is the true fill ratio of the environment, we consider the robot estimate as correct. We follow the same experimental setting as in ref. [Reference Shan and Mostaghim16] by testing five possible configurations of the fill ratio of the arena
 $f=\lbrace{0.05, 0.15, 0.25, 0.35, 0.45\rbrace }$
. A trial is considered successful if all the estimates of the swarm are correct. In our experiments, we perform 50 trials for each environmental configuration. This results in 250 trials which are then averaged for each parameter setting. As stated in the literature [Reference Valentini, Ferrante, Hamann and Dorigo12, Reference Ebert, Gauci, Mallmann-Trenn and Nagpal13, Reference Bartashevich and Mostaghim15, Reference Shan and Mostaghim16], there is a tradeoff between the speed and accuracy of the decision-making algorithm for each parameter setting. Therefore, the performance assessment of such algorithms involves analyzing this tradeoff at different values that the algorithm’s configuration parameters may take. Our algorithm is not an exception where various values of the decay parameter
 $\lambda$
give different tradeoffs. In this paper, we analyze this tradeoff in comparison with the investigated methods in the literature. We analyze the tradeoffs between speed and accuracy as a multiobjective optimization problem. Each algorithm seeks to reach consensus with the minimum mean consensus time and mean absolute error. We perform a parameter sweep over possible parameter values for DC, DBBS, and MLES using the same sampling interval of 1 s. According to each algorithm’s configuration parameters, we assess the following parameter settings:
DC:
 $\tau =\{0.00, 0.01, 0.02, 0.03, 0.04, 0.05, 0.06, 0.07, 0.08\}$
DBBS:
 $\lambda =\{0.5, 0.6, 0.7, 0.8, 0.9\}, \mu =\{0.0, 0.2, 0.4, 0.6, 0.8, 1.0\}$
MLES:
 $\lambda =\{0.02, 0.04, 0.06, 0.08, 0.1, 0.2, 0.3, 0.4, 0.5, 0.6\}$
4. Results
4.1. The effect of feature distribution
4.1.1. Random pattern
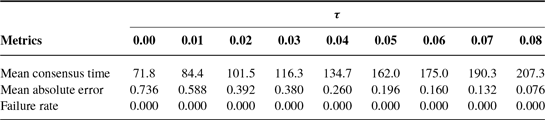
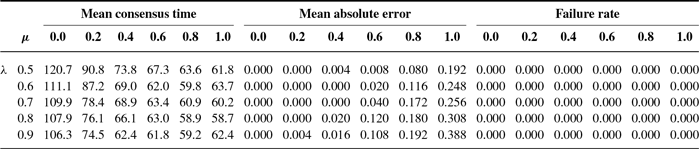
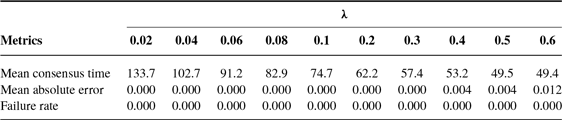
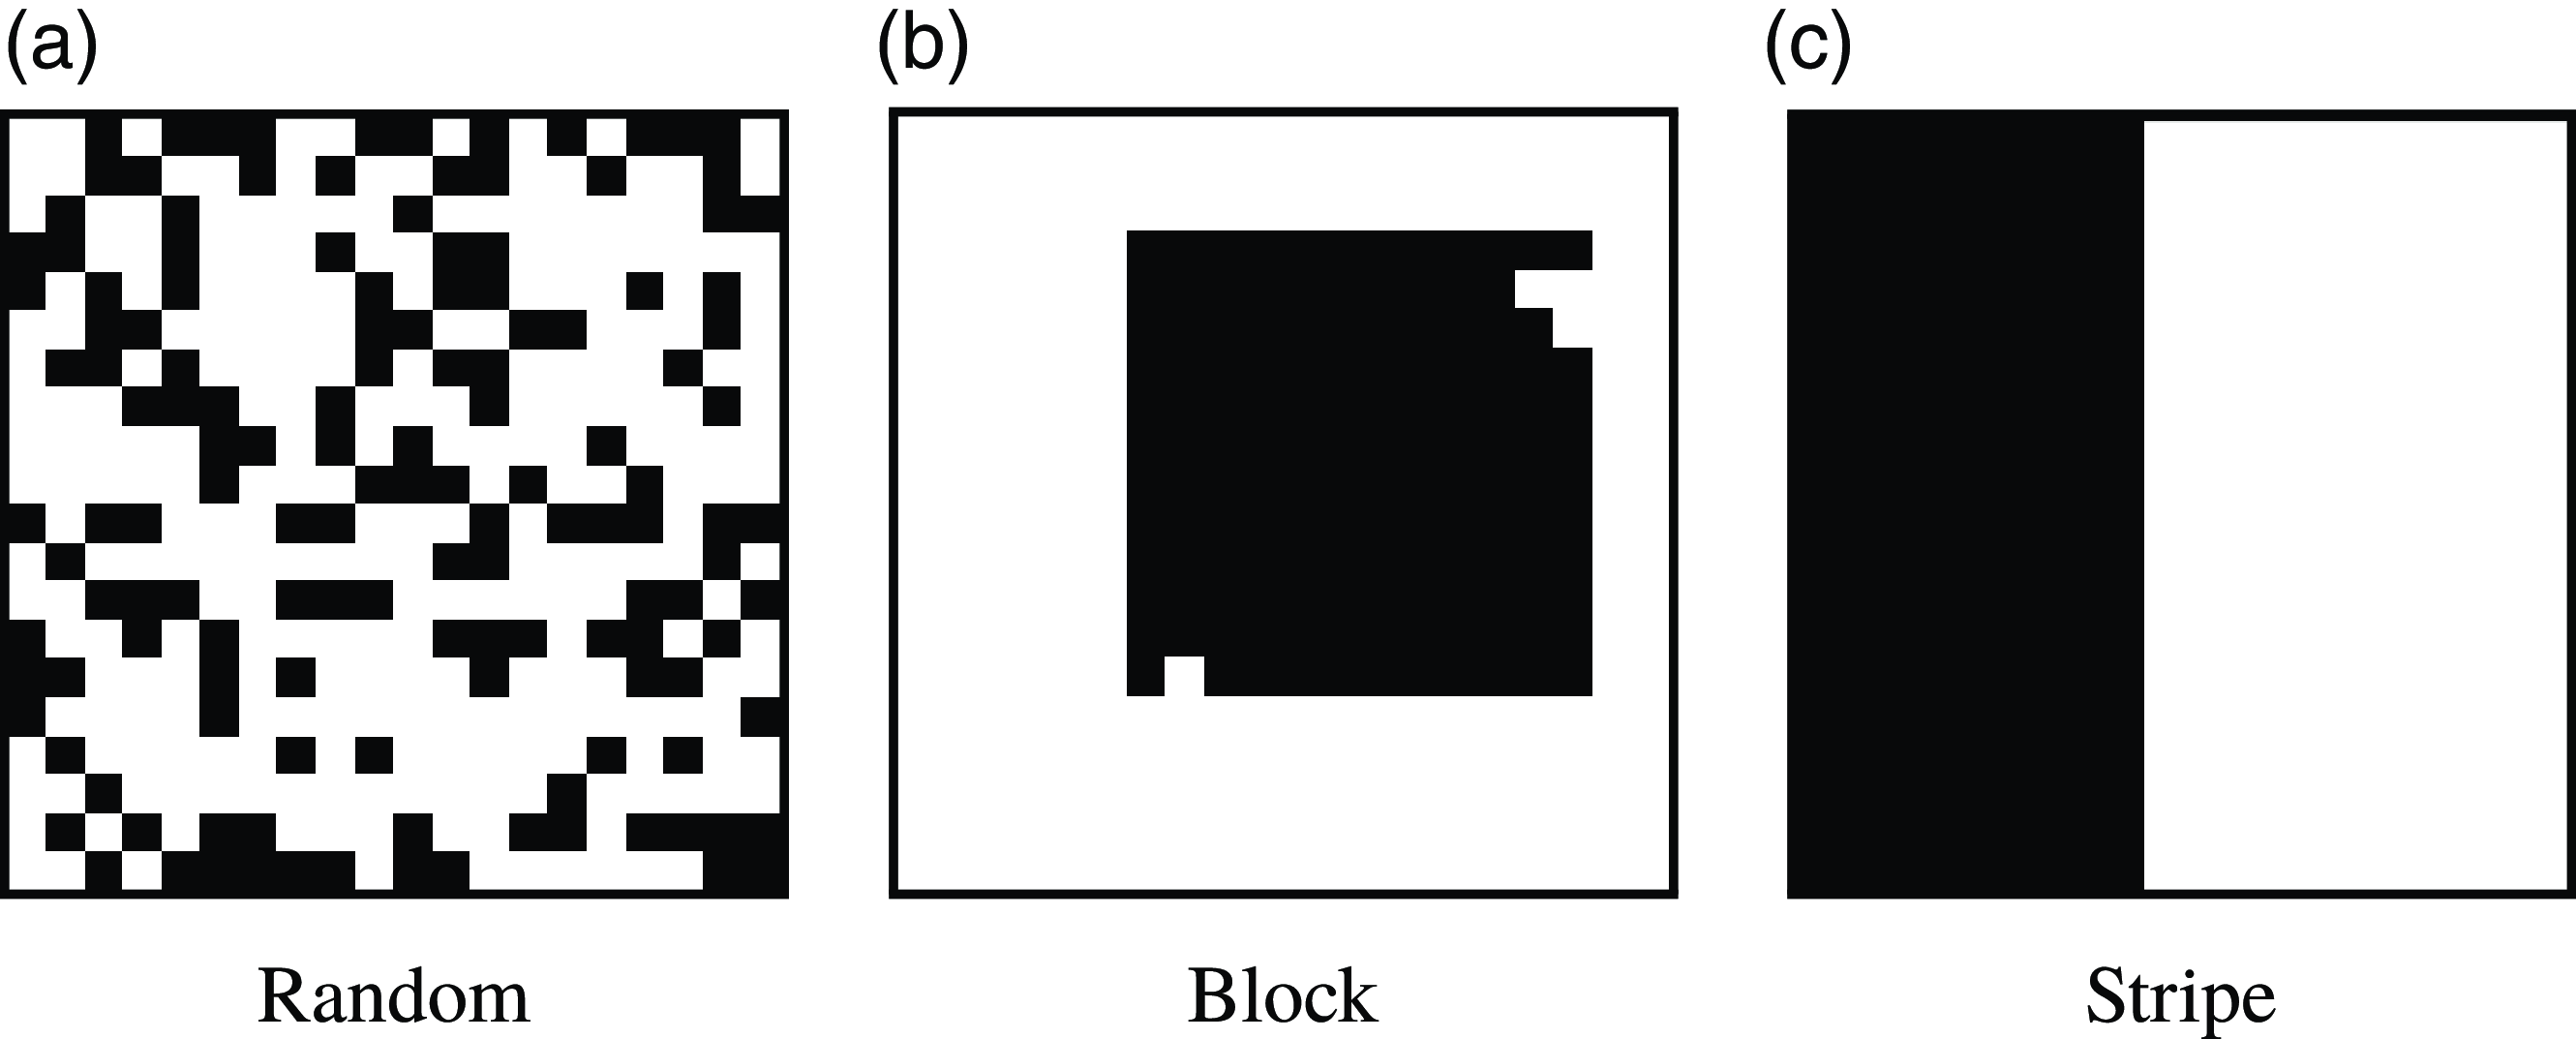
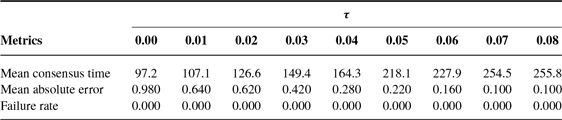
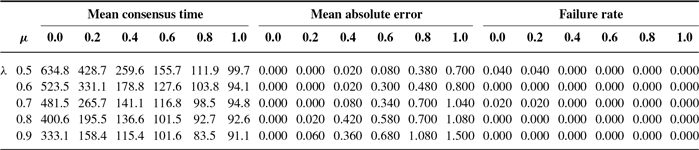
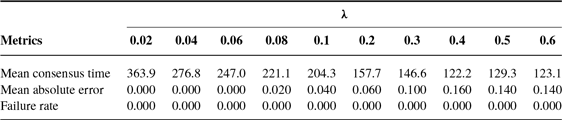
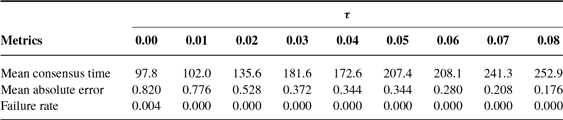
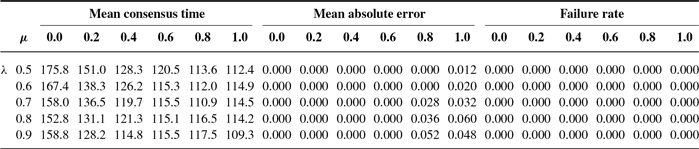
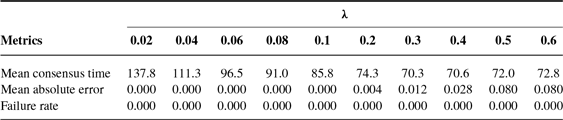
In this setup, the arena tiles are randomly assigned a black or white color with values 1 and 0, respectively. An illustration is shown in Fig. 4a. All strategies DC, DBBS, and MLES exhibit different speed-vs-accuracy tradeoffs at various settings of their configuration parameters, as shown in Tables I–III, respectively. For the MLES strategy, as we increase
 $\lambda$
, we gain in consensus speed, but we lose in accuracy with an error of 0.012 for
 $\lambda =0.6$
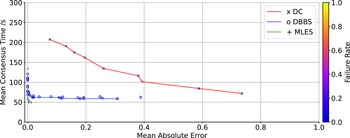
. By comparing MLES performance with DBBS and DC strategies, we can see in Fig. 5 that all decision-making strategies also display various tradeoffs between speed and accuracy at different parameter settings and give no failures across all their parameter settings. Additionally, Pareto frontiers show clearly that MLES (green line) outperforms DC (red line) and DBBS (blue line) in terms of decision accuracy and speed across all its parameter settings. It reaches consensus with zero error in the shortest time of 57 s compared to DBBS, which takes 69 s. On the other hand, DC was not able to reach a consensus without errors over the range of its parameter settings, and its lowest mean error is 0.076. Even though it reached a low consensus time of (71 s), but at the cost of a high mean error of 0.736.
Performance of DC at various
 $\tau$
settings in a random environment.

Performance of DBBS at various
 $\mu$
and
 $\lambda$
settings in a random environment.

Performance of MLES at various
 $\lambda$
settings in a random environment.

Illustration of various patterns representing the distribution of features in the environment.

Comparison between DC, DBBS, and MLES in a random environment using three metrics: mean consensus time, mean absolute error, and failure rate (markers color); Pareto frontiers: DC (red line), DBBS (blue line), MLES (green line).

4.1.2. Block pattern
It was shown in refs. [Reference Bartashevich and Mostaghim15, Reference Ebert, Gauci and Nagpal22] that the distribution of the features in the environment significantly impacts the performance of the collective perception algorithms. If the feature is scattered homogeneously (i.e., randomly distributed) in the environment, the robot, while moving randomly and collecting samples, on average, gets a good estimate of the feature. This is not the case when the features are concentrated in the environment. The concentration of the features in the environment increases the probability of robots not observing one feature over a long period of time because the feature is concentrated somewhere in the arena. As a result, we witness an increase in the variance between the robots’ estimates which makes coming to a consensus more difficult.
Performance of DC at various
 $\tau$
settings in a block environment.

Performance of DBBS at various
 $\mu$
and
 $\lambda$
settings in a block environment.

Comparison between DC, DBBS, and MLES in a block environment using three metrics: mean consensus time, mean absolute error, and failure rate (markers color); Pareto frontiers: DC (red line), DBBS (blue line), MLES (green line).

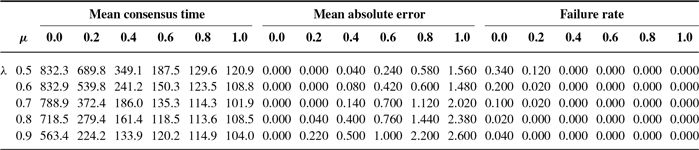
In this environmental setup, the features are not distributed evenly in the arena but instead concentrated, forming a cluster, as illustrated in Fig. 4b. From Fig. 6, we can see that a decrease in performance is exhibited by all strategies, which is displayed by an increase in the mean consensus time and the mean absolute error. This confirms that decision-making algorithms struggle in environments with spatially concentrated features. Here also, MLES reaches the minimum mean consensus time of 247 s without errors (see Table VI), followed by DBBS with a mean consensus time of 331 s (see Table V), whereas, DC is still not capable of achieving consensus without errors (see Table IV). In terms of failure rate, both MLES and DC show no failures across all parameter settings. In contrast, DBBS begins to display failures specifically for a low setting of its parameters
 $\lambda$
and
 $\mu$
.
Performance of MLES at various
 $\lambda$
settings in a block environment.

Performance of DC at various
 $\tau$
settings in a striped environment.

4.1.3. Stripe pattern
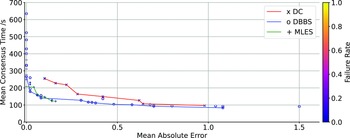
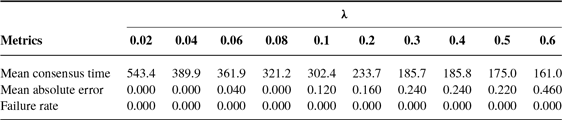
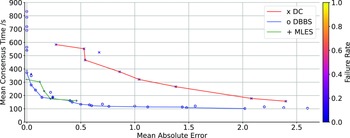
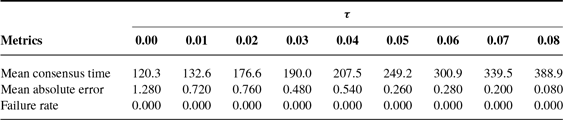
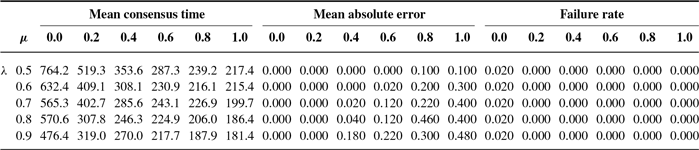
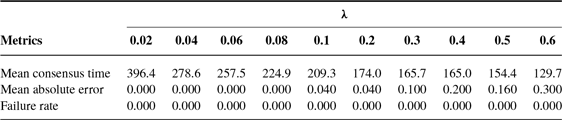
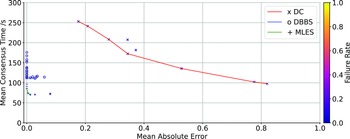
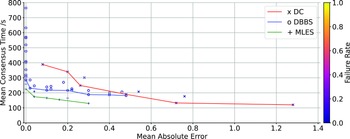
In this pattern, the features are also concentrated, forming a cluster positioned on one side of the arena (see Fig. 4c). It is considered the most challenging pattern in the literature [Reference Bartashevich, Mostaghim, Oliveira, Novais and Reis23]. As shown in Fig. 7, DBBS and DC are unable to come to a consensus without errors and failures across all their parameter settings. In contrast, MLES is capable of reaching consensus with zero error and without failures at a low parameter setting,
 $\lambda =0.04$
, in 389 s (see Table IX). DBBS exhibits a high failure rate of 0.34 at low parameter settings and a high mean error of 2.6 at high parameter settings (see Table VIII). The DC strategy’s performance is also affected significantly with a failure rate of 0.12 and a high mean error of 2.4 (see Table VII), but conversely to DBBS in terms of parameter settings. These results demonstrate the viability of MLES in such a difficult environment.
Performance of DBBS at various
 $\mu$
and
 $\lambda$
settings in a striped environment.

Performance of MLES at various
 $\lambda$
settings in a striped environment.

Comparison between DC, DBBS, and MLES in a striped environment using three metrics: mean consensus time, mean absolute error, and failure rate (markers color); pareto frontiers: DC(red line), DBBS(blue line), MLES(green line).

4.2. The effect of communication bandwidth
An algorithm that requires a low communication bandwidth is desirable in collective decision-making. To assess the viability of different collective decision-making algorithms in such a configuration, we set the probability of broadcasting messages according to the corresponding size of information shared with neighbors (Section 3.4). Table X summarizes the probability setting for different algorithms.
Broadcast probability for DC, DBBS, and MLES at various communication bandwidths.

At lower communication bandwidth of 16 bits/s, we can see from Fig. 8 (random environment) and Fig. 9 (block environment) that there is a decrease in the performance of all strategies, which is illustrated by an increase in the mean consensus time across all their parameter settings. In both environments, random and block, the MLES strategy is less affected by the communication bandwidth decrease compared to DBBS, and the performance margin between them becomes larger at this bandwidth. On the other hand, the DC strategy shows a moderate drop in performance, but it is still not capable of achieving consensus without errors (see Tables XI and XIV). In the random environment, MLES reaches the minimum consensus time of 85 s (see Table XIII), followed by DBBS with 112 s (see Table XII), which represents a margin of 27 s. In the block environment, MLES takes less time (224 s) to achieve consensus with zero error (see Table XVI), whereas DBBS takes 287 s and begins to suffer from failures at low parameter settings with a failure rate of 0.02 (see Table XV).
Performance of DC at various
 $\tau$
settings in a random environment with a communication bandwidth of 16 bits/s.

Performance of DBBS at various
 $\mu$
and
 $\lambda$
settings in a random environment with a communication bandwidth of 16 bits/s.

Performance of MLES at various
 $\lambda$
settings in a random environment with a communication bandwidth of 16 bits/s.

Performance of DC at various
 $\tau$
settings in a block environment with a communication bandwidth of 16 bits/s.

Performance of DBBS at various
 $\mu$
and
 $\lambda$
settings in a block environment with a communication bandwidth of 16 bits/s.

Performance of MLES at various
 $\lambda$
settings in a block environment with a communication bandwidth of 16 bits/s.

Comparison between DC, DBBS, and MLES in a random environment with a communication bandwidth of 16 bits/s using three metrics: mean consensus time, mean absolute error, and failure rate (markers color); Pareto frontiers: DC (red line), DBBS (blue line), MLES (green line).

Comparison between DC, DBBS, and MLES in a block environment with a communication bandwidth of 16 bits/s using three metrics: mean consensus time, mean absolute error, and failure rate (markers color); Pareto frontiers: DC (red line), DBBS (blue line), MLES (green line).

4.3. The effect of noisy sensors
When analyzing the performance of robotic systems, it is essential to consider the presence of noise, which can affect the performance of deployed algorithms. In this section, we investigate how the MLES method is affected by corrupted ground sensor readings. Towards this end, we introduce a Gaussian noise to the ground sensor readings as follows:
 \begin{equation*}O'(t)=O(t) + \eta (t)\end{equation*}
where
 $O'(t)$
is the noisy observation,
 $O(t)$
is the true observation, and
 $\eta (t)$
is a Gaussian noise with zero mean and a standard deviation
 $\sigma$
. Since the robot’s ground sensor is a binary sensor that outputs a binary value of 0 or 1, we set a threshold of 0.5 for the noisy observation
 $O'(t)$
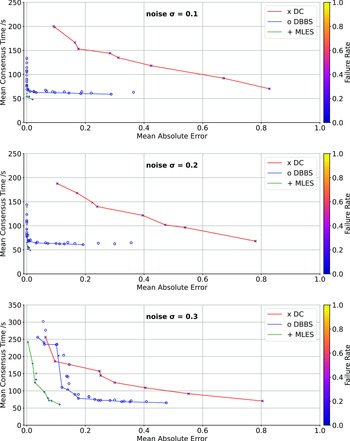
to get a binary output. In our experiments, we explore different noise levels with
 $\sigma =\{0.1, 0.2, 0.3\}$
(see Fig. 10).
The effect of noisy sensors on DC, DBBS, and MLES in a random environment with a communication bandwidth of 48 bits/s using three metrics: mean consensus time, mean absolute error, and failure rate (markers color); Pareto frontiers: DC (red line), DBBS (blue line), MLES (green line).

Using a low noise level of
 $\sigma =0.1$
, we can see that the performance of all strategies is almost unaffected by the introduced noise level, and the obtained results are nearly identical to those without noise.
Using a moderate noise level of
 $\sigma =0.2$
, we can see that the performance of all strategies is slightly affected by this amount of noise, where both MLES and DBBS mean consensus time increases by almost 8 s while still maintaining zero error. On the other hand, the DC strategy is unaffected.
Using a high noise level of
 $\sigma =0.3$
, we notice a significant drop in the performance of all strategies in terms of means consensus time, mean absolute error, and failure rate. However, MLES is the least affected by this drop compared to other strategies. This is illustrated by MLES Pareto frontier, which is well beyond the Pareto frontiers of DC and DBBS. Even though all strategies are unable to achieve consensus with zero error, MLES is mostly capable of achieving consensus at a low parameter setting of
 $\lambda$
in 242 s with the lowest mean error of
 $0.004$
. DBBS is the most affected by this high noise level which is illustrated by a significant shift of its Pareto frontier and an increase in the failures over its low parameter settings.
Overall, obtained results indicate that MLES is more noise-resistant than DC and DBBS, which supports the ability of our self-organized mechanism to better withstand noise.
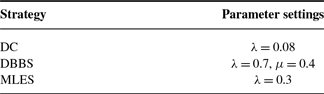
Parameter settings that provide the best speed-vs-accuracy tradeoff for DC, DBBS, and MLES strategies in a random environment.

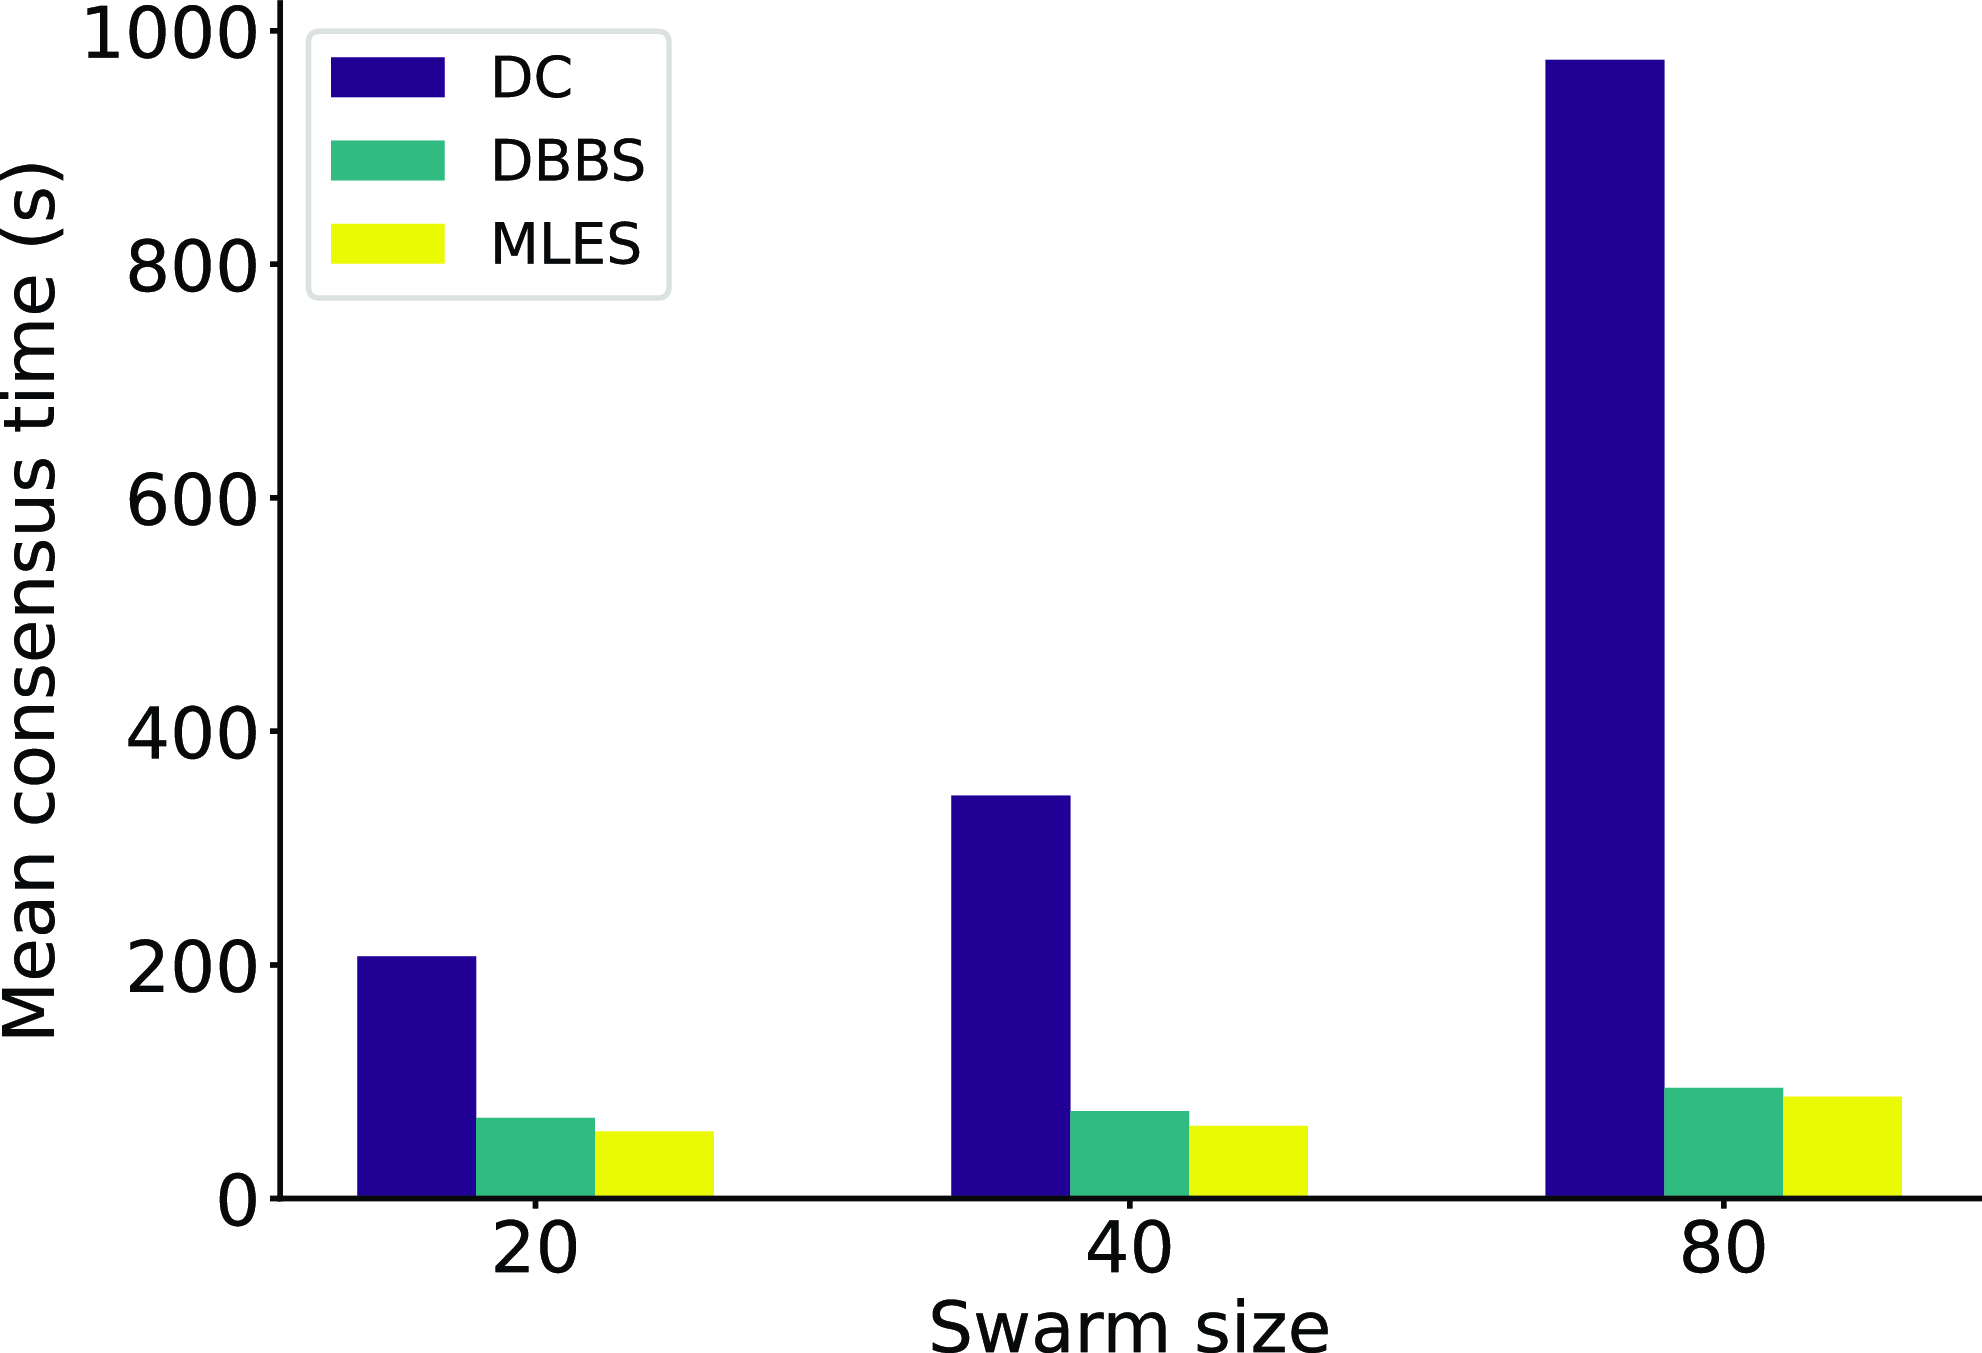
Effect of the swarm size on the mean consensus time.

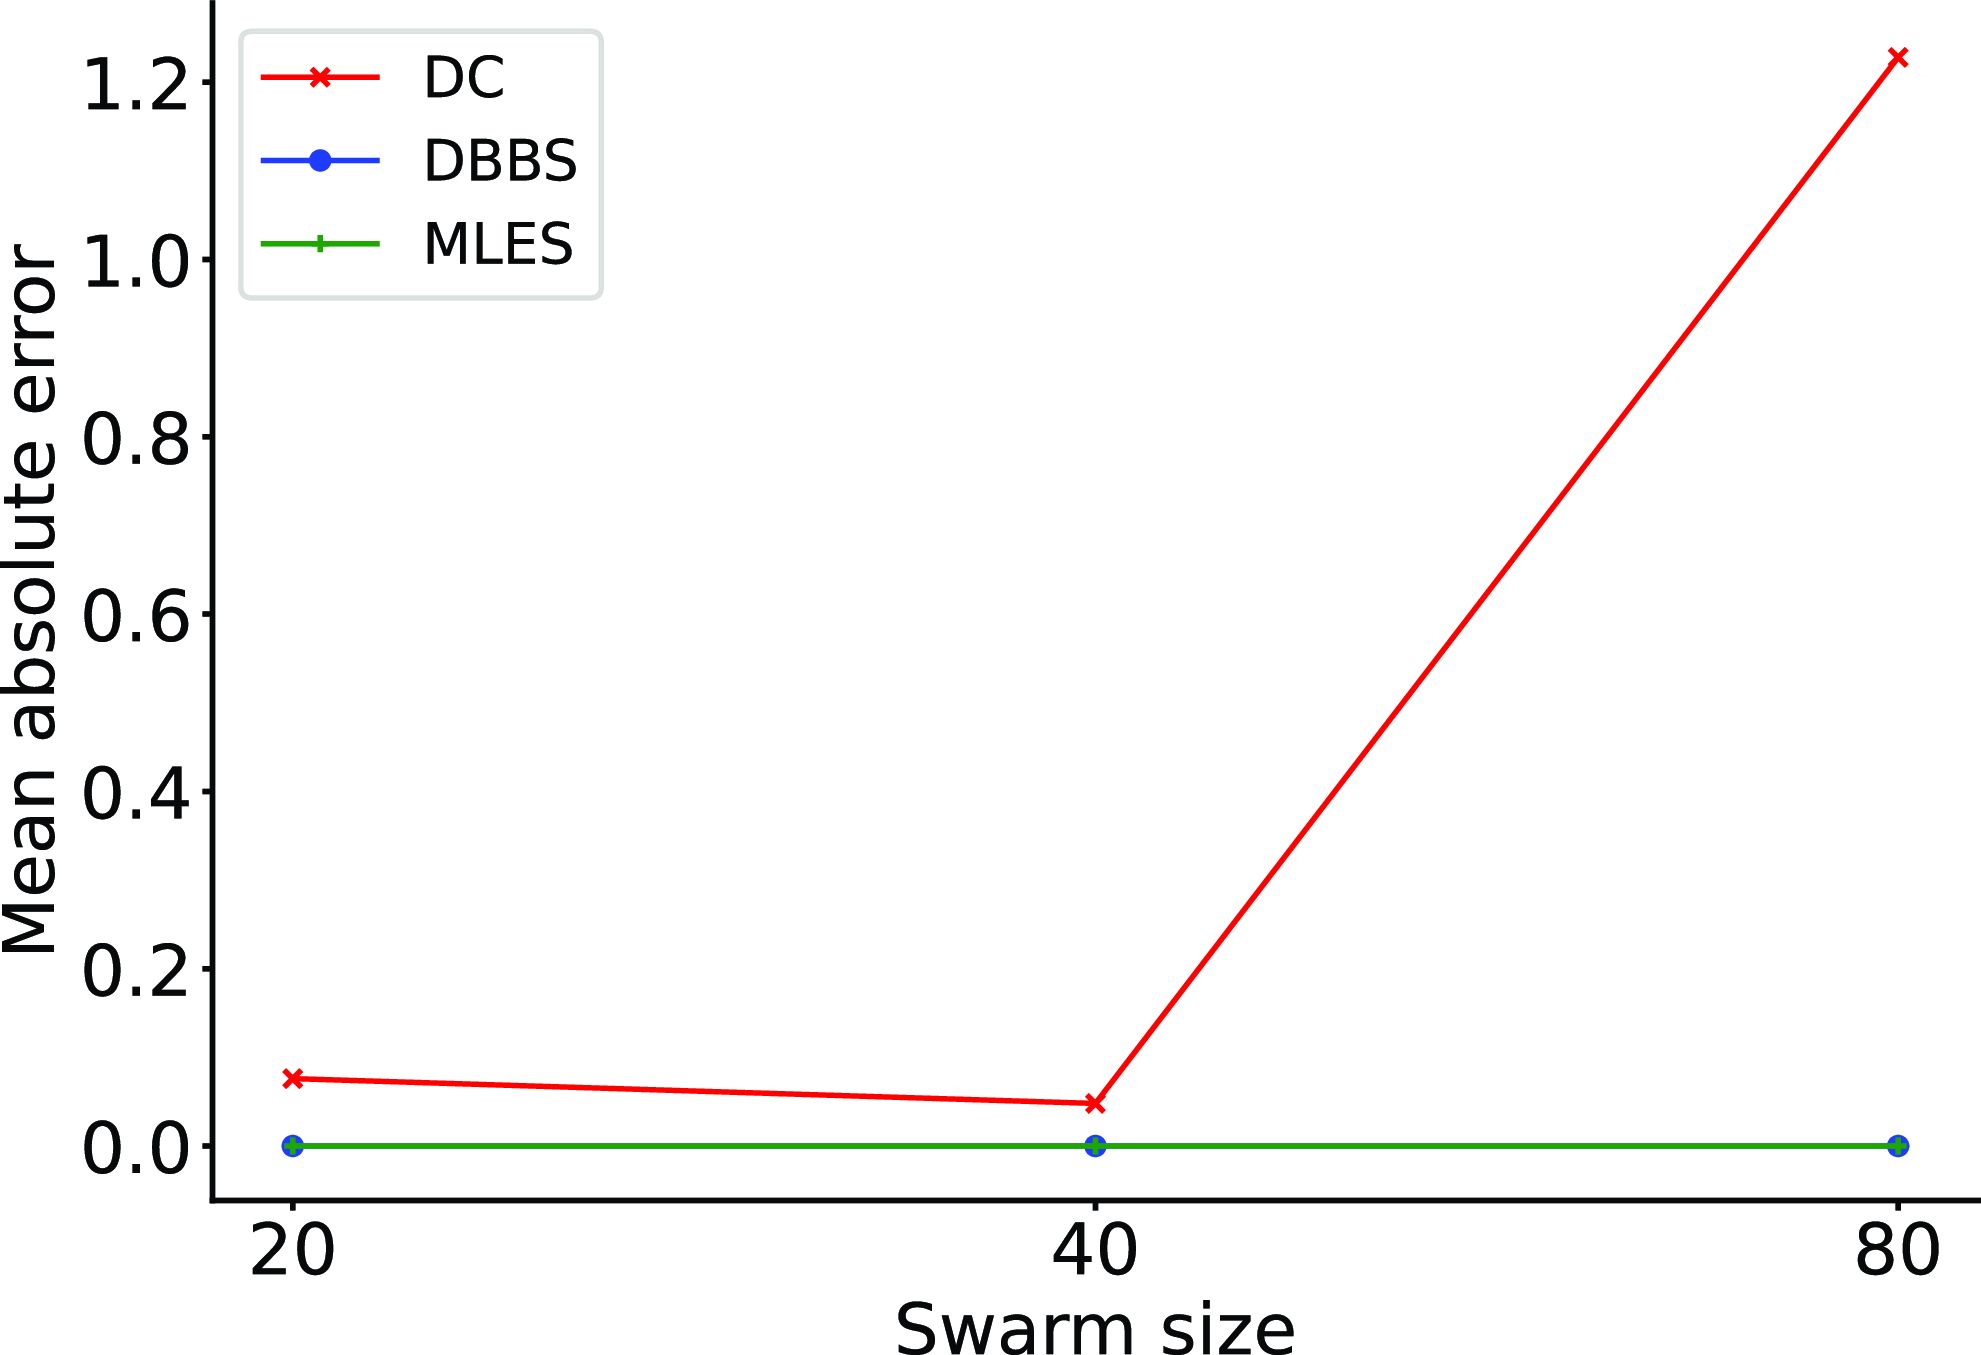
Effect of the swarm size on the mean absolute error.

4.4. The effect of swarm size
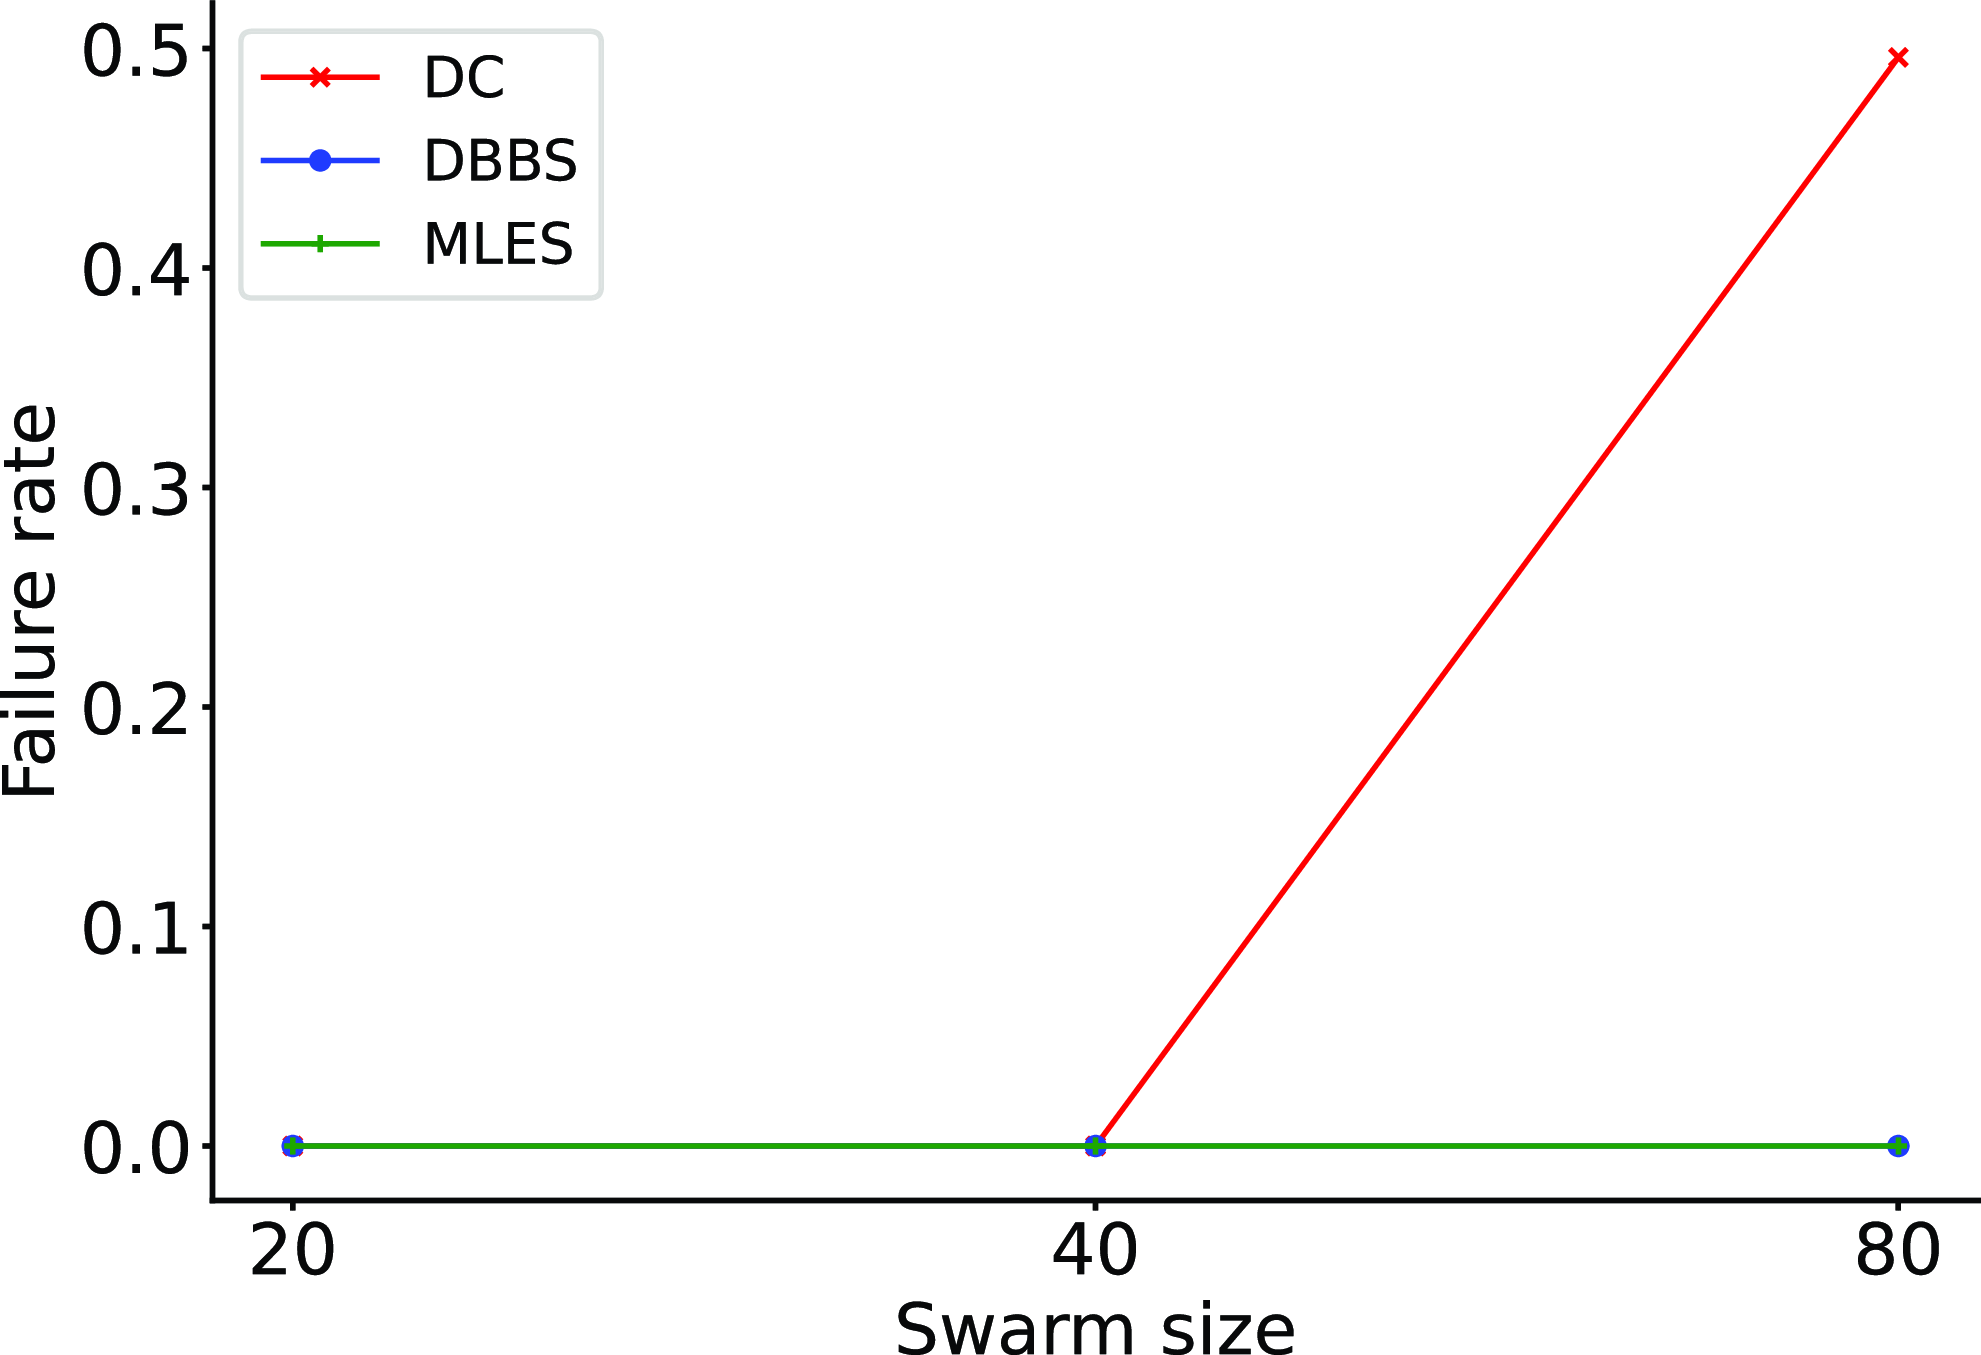
To evaluate the impact of the swarm size on the performance of different algorithms, we perform experiments with various swarm sizes 20, 40, and 80 in an environment with a random pattern using 48 bits/s communication bandwidth. For a fair assessment of the swarm size effect on each algorithm, we chose the parameter settings shown in Table XVII that produce the best results on Pareto frontiers for each algorithm. This choice is based on the results obtained in the random environment (see Section 4.1.1), which is used to investigate the effect of swarm size. Intuitively, we would expect that the larger the swarm size is, the faster the consensus is achieved. However, we notice an increase in consensus time as the swarm size increases (see Fig. 11). Exploring all possible parameter settings further revealed that a larger swarm size reaches consensus faster but at higher parameter settings in MLES and DBBS, this suggests that the considered algorithms require parameter tuning for different swarm sizes. Moreover, Fig. 12 shows that DBBS and MLES are not affected by the swarm size, where the mean absolute error is maintained at zero for various swarm sizes. In contrast, the DC strategy shows a high mean error of 1.228 as we increase the swarm size to 80. The failure rate (see Fig. 13) is maintained at zero for different swarm sizes using DBBS and MLES but increases dramatically to 0.496 using the DC strategy as the swarm size increases to 80. These results confirm the scalability of DBBS and MLES compared to the DC strategy and demonstrate the robustness of self-organized approaches.
Effect of the swarm size on the failure rate.

5. Discussion
As demonstrated in our results, MLES outperforms all considered strategies in terms of speed and accuracy for the discrete collective estimation problem. By comparing the Pareto frontiers of all considered strategies, MLES achieves the shortest consensus time without errors in various environments. Besides, although reducing the communication bandwidth increases the consensus time and error of all considered strategies, MLES withstands this reduction and maintains its superior performance over DC and DBBS. This robustness is due to our strategy’s positive feedback modulation mechanism, which shares its motivation with self-organized approaches like DBBS, but with a better mechanism that modulates positive feedback dynamically using a confidence function that reflects the robot’s confidence in its fill ratio estimate.
A desirable property that we seek from a collective decision-making algorithm is accuracy. Such an algorithm should guarantee to reach a consensus on the correct option. This property is not guaranteed by the DC strategy, which is incapable of achieving consensus without errors across all its parameter settings, and also DBBS, which is not accurate in the stripe environment. On the other hand, MLES is accurate since it guarantees consensus without errors and failures at low parameter settings. Even though this setting results in longer consensus time, it prevents the robots from making premature decisions which may result in reaching a consensus on the wrong option. This tradeoff is controlled using the parameter
 $\lambda$
whereby a low parameter setting makes the robot less affected by the disseminated information, which favors accuracy. In contrast a high parameter setting makes the robot more affected by the disseminated information, which favors speed.
In terms of communication bandwidth requirements, MLES requires less communication bandwidth compared to DBBS which is more demanding as this need depends on the number of hypotheses about the fill ratio. Furthermore, if more precision about the fill ratio estimate is required, more hypotheses need to be transmitted which will limit the viability of DBBS. In contrast, MLES and DC would be unaffected by this requirement. This demonstrates the viability of MLES in low communication bandwidths without losing too much in speed and accuracy in different environments.
In robotic systems, noise is an inevitable factor that can significantly impact the performance and reliability of the system. As robots operate in the real world, they are exposed to a wide range of environmental and operational factors that can introduce noise into the system. Therefore, it is essential to develop collective decision-making algorithms that can sustain noise to ensure the reliable and effective operation of robotic systems. The ability of these algorithms to sustain noise is critical to ensuring that the group can make accurate and effective decisions even in the presence of unpredictable or noisy data. MLES owes its robustness to noisy observations in comparison to DC and DBBS to its self-organized mechanism for modulating positive feedback by giving more weight to information from confident neighbors. In this way, MLES can reduce the impact of noise in the estimation process.
In comparison with opinion pooling-based methods [Reference Lee, Lawry and Winfield9] for collective decision-making, which relies on bidirectional communication, here we consider a more challenging communication paradigm that relies on peer-to-peer communication where messages are broadcasted to neighbors. Additionally, these methods are computationally more complex than MLES. Thus, our method requires a simpler infrastructure in terms of communication and computation compared to opinion-pooling-based methods.
The performance of all considered algorithms in this study is sensitive to the choice of their parameter settings. Selecting the best parameter setting for different environmental setups and swarm sizes is not straightforward. Unfortunately, this is the case for all the considered algorithms in this study. In a real-world problem, at best, we have the size of the swarm, but we have no idea about the distribution of features in the environment. Although a low parameter setting of
 $\lambda$
in MLES can guarantee accuracy in various environments but to the detriment of speed. We think that this limitation should be addressed to make a collective decision-making strategy adaptive to any environmental setup.
MLES strategy is limited to estimating the ratio of only two features present in the environment. A multifeature environment presents additional complexity to the swarm robots in their collective estimation process because it adds more conflicting and noisy information that is exchanged among them. This limitation has not yet been addressed as a collective estimation problem, but it was addressed from the perspective of the best-of-n problem (i.e., collectively deciding on the dominant feature in the environment) by Ebert et al. [Reference Ebert, Gauci and Nagpal22]. However, their method required a dynamic task allocation mechanism to help robots switch between features they are estimating.
6. Conclusion and Future Works
In this work, we tackled the problem of collective perception in swarm robotics to estimate the ratio of the present features in the environment rather than reaching a consensus on the prevalent one. This problem is treated as a discrete collective estimation scenario in the presence of two features using a swarm of anonymous robots with local communication and sensing capabilities. We proposed the MLES method, a solution that incorporates a self-organized mechanism that modulates positive feedback in order to disseminate the best estimate among the swarm. Then, we compared our approach with the existing methods in the literature in different environmental setups where our method outperformed them in terms of accuracy and speed using the same peer-to-peer communication paradigm and bandwidth by improving the efficiency of the decision-making process by almost 20% in comparison to DBBS. We also assessed its performance at lower communication bandwidth, where it also showed superior performance while requiring six times less communication bandwidth than DBBS. Moreover, results showed that MLES is more noise-resistant than DC and DBBS, indicating that our self-organized mechanism can withstand noise better. Furthermore, the scalability of the considered strategies is evaluated using different swarm sizes where MLES and DBBS strategies proved their scalability and robustness as self-organized approaches.
Experimentations with a real E-pucks robotics platform will be conducted in future works to show how well the proposed approach will perform in real-world scenarios. Additionally, we consider exploring the performance of our method in more complex environments such as dynamic environments. Also, we intend to investigate controlling the motion of the robots rather than relying on a random walk, which is less efficient and produces correlated observations.
Author contributions
Ahmed Abdelli developed the theoretical formalism and performed the simulation experiments. Ali Yachir, Abdenour Amamra, and Belkacem Khaldi contributed to the final version of the manuscript.
Financial support
This research received no specific grant from any funding agency, commercial, or not-for-profit sectors.
Conflicts of interest
The authors declare no conflicts of interest exist.
Ethical approval
Not applicable.