Nomenclature
-
 $b$
-
contact length between the shaft and hole, mm
-
${c_e}$
-
restitution coefficient
-
${C_F}$
-
fit accuracy cost
-
${C_S}$
-
shaft accuracy cost
-
${C_H}$
-
hole accuracy cost
-
${C_{OS}}$
-
process capability coefficient of the shaft
-
${C_{OH}}$
-
process capability coefficient of the hole
-
$d$
-
nominal diameter of the shaft, mm
-
$D$
-
nominal diameter of the hole, mm
-
$e_3^k$
-
axis of the bushing
-
$e_3^l$
-
axis of the shaft pin
-
${E_k}$
-
Young’s modulus, Mpa
-
$f$
-
tangential friction force, N
-
$F$
-
normal contact force, N
-
$F(t)$
-
normal load between the motion joints, N
-
$F_i^{n - 1}$
-
normal load of joint i in the (n−1)th cycle, N
-
$h$
-
joint wear depth, mm
-
$\Delta h$
-
joint wear depth within one retraction cycle, mm
-
$\Delta h_i^n$
-
wear depth of joint i generated in the nth cycle, mm
-
${h_i},{h_j}$
-
material parameters, mm2/N
-
$H$
-
material’s Brinell Hardness, N/mm2
-
$i(D)$
-
ISO standard tolerance factor for the nominal diameter D
-
${I_F}$
-
indicator function
-
$Jc$
-
clearance between the shaft and hole, mm
-
$K$
-
wear coefficient
-
${K_{st}}$
-
contact stiffness coefficient of impact body, N/mm3/2
-
$L$
-
actuator stroke, mm
-
${L_s}$
-
relative sliding distance of the motion joints, mm
-
$n$
-
retraction cycles
-
$N$
-
number of Monte Carlo simulations
-
${P_f}$
-
failure probability
-
${\hat P_f}^n$
-
estimated value of failure probability at n cycles
-
${P_{re}}$
-
specified reliability threshold
-
${P_r}$
-
kinematic accuracy reliability
-
${\hat P_r}^n$
-
estimated value of reliability at n cycles
-
$r$
-
radius of the shaft or hole, mm
-
${r_c}$
-
cost sensitivity to the tolerance exponent
-
${R_i},{R_j}$
-
equivalent spherical radii for the impact between two bodies, mm
-
${t_r}$
-
retraction or extension time, s
-
${T_S}$
-
dimensional tolerance interval of the shaft
-
${T_H}$
-
dimensional tolerance interval of the hole
-
${{\boldsymbol{v}}_\tau }$
-
relative tangential velocity, mm/s
-
${v_r}$
-
transition velocity, mm/s
-
$V$
-
wear volume, mm3
-
${{\boldsymbol{x}}_k}$
-
the kth sample value of the random input variables X , mm
-
${\boldsymbol{X}}$
-
random input variables that do not change over time
-
$y_i^0$
-
initial clearance of joint i, mm
-
$y_i^n$
-
wear clearance of joint i at n cycles, mm
-
$y_k^n$
-
the kth sample value of the random input variables Y at n cycles, mm
-
${\boldsymbol{Y}}(t)$
-
random input variables that change over time
-
$Z$
-
functional function


Greek symbol
-
$\Delta $
-
locking position offset, mm
-
${\Delta _X}$
-
locking position offset in the X direction, mm
-
${\Delta _Z}$
-
locking position offset in the Z direction, mm
-
${\Delta ^*}$
-
maximum allowable offset, mm
-
$\delta $
-
local relative penetration, mm
-
$\dot \delta $
-
indentation velocity, mm/s
-
${\dot \delta ^{( - )}}$
-
initial indentation velocity, mm/s
-
${\delta _{r\_f}}$
-
radial penetration depth of the contact front surface, mm
-
${\delta _{r\_b}}$
-
radial penetration depth of the contact back surface, mm
-
${\theta _1}$
-
rotation angle of the suspension rocker arm, deg
-
${\theta _2}$
-
rotation angle of the main strut, deg
-
${\lambda _S}$
-
geometric tolerance coefficient of the shaft
-
${\lambda _H}$
-
geometric tolerance coefficient of the hole
-
${\mu _f}$
-
dynamic friction coefficient
-
${\mu _k}$
-
Poisson’s ratio
-
${\mu _x}$
-
mean of the random variable x
-
${\mu _y}$
-
mean of the random variable y
-
${\sigma _x}$
-
standard deviation of the random variable x
-
${\sigma _y}$
-
standard deviation of the random variable y
-
$\omega (t)$
-
relative angular velocity of the motion joints, rad/s


1.0 Introduction
As a critical component in aircraft operations during takeoff and landing procedures, the motion reliability of the landing gear retraction mechanism holds direct implications for flight safety. Due to the complex configuration and numerous joints of the landing gear retraction mechanism, the motion trajectory of the mechanism inevitably incurs static errors owing to the coupling effect of node position deviation and initial joint clearance [Reference Zhan, Zhang, Zhang and Chen1–Reference Zhang and Du3]. Furthermore, the onset of frictional wear effects prompts the dynamic evolution of clearances at multiple joints throughout retraction cycles, thereby engendering dynamic deviations in the mechanism’s motion trajectory [Reference Liu, Tan and Zhao4, Reference Alves, Fieux, Machado, Keogh and Cavalca5]. This phenomenon exacerbates the degradation of kinematic accuracy, significantly compromising the mechanism’s kinematic accuracy reliability and potentially causing landing accidents. Therefore, it is imperative to comprehensively consider static and dynamic influencing factors and conduct kinematic accuracy reliability analysis and optimisation design for the retraction mechanism to mitigate the decline in kinematic accuracy and prolong the mechanism’s lifecycle.
In recent years, numerous scholars have conducted a series of studies addressing the issues of wear prediction and motion error analysis in the mechanism with clearance [Reference Yu, Zhao, Guo, Chen and Hong6, Reference Wang, Zhou and Liu7]. Flores et al. [Reference Flores8–Reference Flores, Koshy, Lankarani, Ambrósio and Claro10] proposed a general method for dynamic modeling of multibody systems and quantification of wear in revolute clearance joints. Their study delved into the wear effects and overall dynamic behaviour of mechanisms, such as the four-bar mechanism and the crank slider mechanism. Subsequently, Flores and his research group [Reference Tian, Flores and Lankarani11–Reference Flores, Ambrósio and Lankarani13] delved into the advancements in kinematics, dynamics and contact-impact mechanics of multibody mechanical systems with clearance joints. Rodrigues et al. [Reference Rodrigues da Silva, Marques, Tavares da Silva and Flores14, Reference Rodrigues da Silva, Marques, Tavares da Silva and Flores15] focused on the dynamic modeling of multibody systems, offering an in-depth comparison of various contact force models and spherical joint models. Li et al. [Reference Li, Wang, Gantes and Tan16] introduced a wear modeling and evaluation method for planar mechanical systems with clearance, studying the effects of clearance size, quantity, position and driving conditions on the dynamic characteristics of the crank slider mechanism. Jiang et al. [Reference Jiang, Lin, Liu, Xiao and Zhang17] proposed an efficient dynamic optimisation modeling method for a planar complex multi-link mechanism with multiple clearance joints based on genetic algorithms, effectively improving the dynamic accuracy and reliability of the mechanism with clearance. Jin et al. [Reference Jin, Wang, Liang, Wei, Chang and Zhou18] conducted an investigation into the dynamic response characteristics of the multi-link complex mechanism with lubricated clearance joints, highlighting that the increase in clearance quantity exacerbates instability and identifying interactions between different clearance joints. Yin et al. [Reference Yin, Xu, Nie, Wei and Wang19] developed a multi-body dynamics model for landing gear retraction considering clearance and axial deviation, analysing the effects of various clearances and axial deviations on retraction dynamic behaviours. Additionally, several researchers have conducted experimental studies on the dynamic characteristics of mechanisms with clearance, primarily focusing on crank rocker and crank slider mechanisms with clearance [Reference Khemili and Romdhane20–Reference Erkaya23].
The above-mentioned studies primarily focused on evaluating wear effects and analysing dynamic characteristics in the simple mechanism with clearance. However, for multi-link complex mechanisms with significant nonlinearity, the dynamic analysis data that can fully consider the dynamic evolution process of wear clearance in every joint is limited [Reference Jia, Chen, Zhang and Ning24, Reference GAO and CHEN25]. This research aims to bridge this gap by comprehensively considering the temporal variation of clearances induced by wear and changes in the mechanism’s dynamic properties, including joint load and rotational velocity. Through the utilisation of multi-body dynamics simulation techniques and the wear prediction model, this research aims to uncover the variation patterns of kinematic accuracy and joint wear depth in the complex multi-link mechanism under the influence of deviation and clearance. To validate the accuracy of the simulation model, this research involved the design and fabrication of a test prototype of the retraction mechanism with clearance. Based on mechanism kinematic accuracy tests under various operating conditions, the failure boundary for kinematic accuracy characteristics (i.e. the locking position offset) is determined, which provides a practical foundation for the optimisation design and fault diagnosis of the mechanism.
In addressing the reliability analysis and optimisation of mechanisms with clearance, Chen et al. [Reference Chen and Gao26, Reference Chen and Gao27] investigated a complex planar multi-link mechanism, analysing the dynamic response and dynamic accuracy reliability of the slider under various driving speeds, clearance values and friction coefficients. Li et al. [Reference Li, Chen and Kang28] developed a performance margin-based reliability analysis method considering performance degradation and multi-source uncertainties for an aircraft locking mechanism. This method offers guidance for the design and manufacturing process of aircraft locking mechanisms. Wang et al. [Reference Wang, Geng, Wang, Wang, Chen and Fan29] proposed a method combining interval process and first-passage theories to analyse time-dependent reliability considering uncertainties in dimensions and joint clearances. Gao et al. [Reference Gao, Zhang and Li30] presented a general method for reliability sensitivity analysis and optimisation design of planar double-clearance crank-slider mechanisms. This method significantly reduces impact forces at clearance joints while ensuring slider motion reliability. Sun et al. [Reference Sun, Shi and Zhang31] introduced a kinematic analysis method and a multi-objective robust optimisation approach for analysing and optimising constrained mechanical systems with joint clearances and random parameters. Chen et al. [Reference Chen, Lu, Ling and Feng32] established the time-dependent reliability analysis model of landing gear structure, considering only one pin shaft wear at the rotating hinge, and evaluated the failure probability. Chang et al. [Reference Chang, Zhou, Liu, Zhang and Yue33] developed a co-simulation model for the reliability sensitivity analysis of the aircraft door lock mechanism with clearance, identifying critical locations affecting the functional reliability. Wang et al. [Reference Wang, Zeng and Guo34] identified the wear at the top hinge of an airborne retraction mechanism as a critical failure and proposed a time-dependent reliability-based design optimisation method considering both kinematic reliability and structural reliability as constraints.
Current research on the reliability of complex multi-body systems with multiple clearances often overlooks the coupling effect of clearance and wear, as well as the temporal evolution process of mechanism performance parameters. This research simultaneously takes into account both static and dynamic factors affecting the kinematic accuracy of complex mechanisms: uncertain node position deviations, uncertain joint clearances, and time-dependent cumulative wear of all joints. Based on the multibody dynamics model that has been validated through experiments, a time-dependent reliability analysis and optimisation model for the complex retraction mechanism is established. Under the given requirement for kinematic accuracy reliability, this research aims to achieve optimal clearance fitting precision and minimise the degradation of kinematic accuracy over time.
The organisation of this paper is as follows: In Section 2.0, a dynamic simulation model of the retraction mechanism is established, taking into account node position deviation, joint clearance and wear factor. Parameter impact analysis is conducted on both kinematic accuracy and joint wear depth. In Section 3.0, retraction tests are designed and conducted under multiple operating conditions to validate the accuracy of the simulation model. The effects of selected parameters on kinematic accuracy are examined through main effect and interaction analyses. Section 4.0 integrates the joint wear prediction model to establish a time-dependent reliability model for the kinematic accuracy of the retraction mechanism. This model predicts the trend of mechanism reliability with respect to the number of retraction cycles. Sensitivity analysis of influencing parameters is conducted to determine design variables. With the lowest accuracy cost as the optimisation objective, reliability optimisation of the retraction mechanism is pursued. Section 5.0 concludes the work.
2.0 Dynamic analysis of retraction mechanism
The main strut pivot-unfixed type landing gear retraction mechanism is a typical multi-link complex mechanism with clearance. This mechanism has numerous joints, and the motion trajectory of the transmission rod system is inevitably affected by joint clearance and node position deviation. This causes the locking ring on the main strut to deviate from the predetermined locking position, rendering the retraction mechanism unable to lock. Additionally, as the number of retraction cycles increases, various joints will experience varying degrees of wear, resulting in an increase in joint clearance and a decrease in kinematic accuracy. Therefore, focusing on the landing gear retraction mechanism, a dynamic model considering wear clearance and node position deviation is established to analyse their influence on kinematic accuracy and joint wear depth.
2.1 Functional principle analysis of retraction mechanism
The retraction mechanism studied in this paper, as shown in Fig. 1(a), mainly consists of the retraction actuator, upper lock, suspension rocker arm, folding lock rod, resistance support rod and main strut. Its main feature is that the rotation axis of the main strut is not fixed, meaning that this axis rotates around the rotation axis between the rocker arm and the support during the retraction process.
Landing gear retraction mechanism. (a) The extended state. (b) The retracted state.

The retraction process of the landing gear is as follows: under hydraulic pressure, the piston rod of the retraction actuator retracts, driving the folding lock rod to fold up, thereby unlocking the folding strut lock. Then, the retraction actuator continues to drive the transmission rod system composed of the resistance strut, main strut, folding lock rod and suspension rocker arm to move upward along the predetermined trajectory. As the mechanism is about to lock, the kinetic energy of the main strut at the end of the retraction stroke is transmitted to the locking hook of the upper lock through the locking ring, which pushes the locking hook to rotate clockwise. When the locking ring reaches the predetermined locking position, the locking hook rotates 40°, and the mechanism is locked, as shown in Fig. 1(b).
Long-term wear and structural deformation lead to increased clearances in joints and deviations in mounting node positions, affecting the locking ring position in the retracted state of the retraction mechanism. If the locking ring has a negative offset in the Z direction
 ${\Delta _Z}$
or a positive offset in the X direction
 ${\Delta _X}$
relative to the predetermined locking position, it will reduce the lifting height of the front end of the locking hook, preventing the locking hook from rotating into place and causing a failure in the kinematic accuracy of the mechanism. When the mechanism is in a locked state, the contact surface normal line between the locking ring and the locking hook (lifting direction of the locking hook) forms an approximate 12.7° angle with the Z-axis, and the locking ring axis line aligns similarly with the X-axis. The X-directional locking position offset
 ${\Delta _X}$
has a minor effect on the locking hook lifting height, while the Z-direction offset
 ${\Delta _Z}$
has a more pronounced effect. Since the locking hook lifting height directly affects its rotation angle, it can be inferred that the influence of the X-directional locking position offset
 ${\Delta _X}$
on the rotation angle of the locking hook is less than that of the Z-directional locking position offset
 ${\Delta _Z}$
.
2.2 Dynamic simulation modeling of retraction mechanism
2.2.1 Virtual prototype model
The three-dimensional dynamic simulation model of the retraction mechanism is developed using Virtual. Lab Motion (LMS) software, considering joint clearance and node position deviation. The main parameters are outlined in Table 1.
Main parameters of the landing gear retraction mechanism

The process of establishing the virtual prototype model of the retraction mechanism is as follows: Firstly, while ensuring the consistency of the mechanism’s inertial mass, simplification is applied to its various components. To facilitate subsequent experiments, the main strut is simplified to a triangular framework containing a locking ring, as shown in Fig. 2. Then, the motion constraints between the components of the mechanism are clarified, with the addition of motion joints and position drivers, as depicted in Fig. 3.
Retraction mechanism simulation model.

Constraints among retraction mechanism components.

2.2.2 Joint clearance model
(1) Revolute joint model with clearance
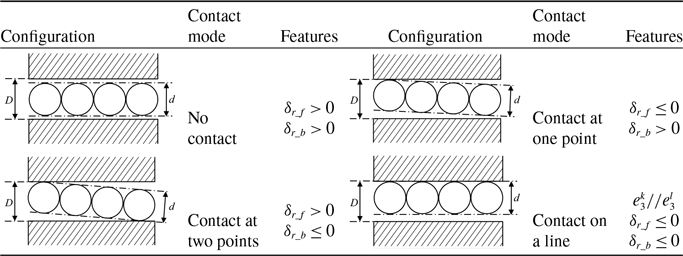
The motion joints within the retraction mechanism are mostly revolute joints composed of a shaft pin and a bushing. Therefore, multiple ball-plane contact models are employed to simulate the hole-shaft clearance. As illustrated in the contact diagram in Table 2, the planes represent the hole wall structure with a diameter of D, while the multiple balls represent the shaft structure with a diameter of d, and the clearance is denoted as
 $Jc = D - d$
.
Contact modes of revolute joint

In this paper, the revolute joint model only considers the radial clearance. The description and features of the four contact modes [Reference Yan, Xiang and Zhang35] are shown in Table 2. In the table,
 ${\delta _{r\_f}}$
represents the radial penetration depth of the contact front surface,
 ${\delta _{r\_b}}$
denotes the radial penetration depth of the contact back surface, vector
 $e_3^k$
is defined along the axis of the bushing, and vector
 $e_3^l$
indicates the axis of the shaft pin.
The sign of the penetration depth can reveal the change of the contact state [Reference Flores and Ambrósio36], and contact can be detected as
 \begin{align}{\delta _r}\left( {q,t} \right) \cdot {\delta _r}\left( {q,t + \Delta t} \right) \le 0\end{align}
where
 $q$
is the generalised coordinates.
When Equation (1) is satisfied, the initiation of contact occurs at
 $t + \Delta t$
. Once contact between the joint members is detected, the contact mode can be ascertained based on the features listed in Table 2.
(2) Normal contact force model
The popular Lankarani-Nikravesh continuous contact force model (L-N model) [Reference Lankarani and Nikravesh37] is employed to calculate the contact force of the contact unit. The model takes into account the effects of material properties, geometry, elastic deformation, and impact velocity on the collision characteristics. Additionally, it offers a more precise account of energy dissipation and transfer throughout the collision process, thereby offering a closer approximation to the actual contact collision situation. The expression for the normal contact force F is given by
 \begin{align}F = {K_{st}}{\delta ^{3/2}}\left[ {1 + \frac{{3(1 - c_e^2)\dot \delta }}{{4{{\dot \delta }^{( - )}}}}} \right]\end{align}
where
 $\delta $
is the local relative penetration,
 ${c_e}$
is the restitution coefficient,
 $\dot {\delta} $
stands for the indentation velocity,
 ${\dot \delta ^{( - )}}$
is the initial indentation velocity.
 ${K_{st}}$
is the contact stiffness coefficient of the impact body, expressed as follows
 \begin{align}{K_{st}} = \frac{4}{{3\pi ({h_i} + {h_j})}}{\left[ {\frac{{{R_i}{R_j}}}{{{R_i} + {R_j}}}} \right]^{1/2}}\end{align}
in which,
 ${R_i}$
and
 ${R_j}$
represent the equivalent spherical radii for the impact between two bodies. The material parameters
 ${h_i}$
and
 ${h_j}$
can be expressed as
 \begin{align}{h_k} = \frac{{1 - \mu _k^2}}{{\pi {E_k}}}(k = i,j)\end{align}
Variables
 ${\mu _k}$
and
 ${E_k}$
are, respectively, the Poisson’s ratio and the Young’s modulus associated with each sphere.
(3) Tangential friction model
The friction force is typically modeled using the classical Coulomb friction model, which relates the friction force to the normal contact force through the coefficient of friction. The tangential friction force
 $f$
is given by
 \begin{align}f = - {\mu _f}F\frac{{{v_\tau }}}{{\left| {{v_\tau }} \right|}}\end{align}
where
 ${\mu _f}$
is the dynamic friction coefficient and
 ${v_\tau }$
is the relative tangential velocity.
Due to the discontinuity of the Coulomb friction model, it fails to handle cases where the tangential velocity is zero during the contact collision process, leading to low stability in simulation calculations. To address this, many improved Coulomb friction models [Reference Threlfall38–Reference Bhalerao and Kurien Issac41] have been proposed. In this paper, the Rooney-Deravi friction model [Reference Rooney and Deravi39] is adopted to simulate the tangential friction, with the expression provided below
 \begin{align}f = - {\mu _f}F\frac{{{v_\tau }}}{{\left| {{v_\tau }} \right|}}\tanh \left( {\frac{{5{v_\tau }}}{{2{v_r}}}} \right)\end{align}
where
 ${v_r}$
represents a transition velocity that is independent of both friction force and tangential velocity.
The contact force model is illustrated in Fig. 4.
Friction model.

2.2.3 Node position deviation model
A massless dummy object is added to the supports of the suspension rocker arm and resistance support rod, with translational joints introduced between the support and the dummy object in both horizontal and vertical directions, actuated by position drivers to simulate node position deviation, as depicted in Fig. 5.
Node position deviation simulation diagram.

From the functional analysis of the retraction mechanism, it is evident that there are a total of seven joint clearances (Jc1∼Jc7) and four node position deviations (Adx1, Adz1, Adx2, Adz2) affecting the locking position, as illustrated in Fig. 2. These joint clearances and node position deviations are parameterised for further analysis.
This study uses the locking position deviation
 $\Delta $
, which represents the relative distance between the locking ring and the predetermined locking position when the retraction mechanism is retracted, as an indicator of kinematic accuracy. Therefore, sensor axis systems are established on both the locking ring and the locking hook, allowing the dynamic changes in distance between them to be monitored in real-time using motion sensors in the software. Furthermore, motion sensors can track the rotation angles and normal loads of seven joints during the retraction process.
2.3 Effect analysis on kinematic accuracy
Based on the simulation model established in Section 2.2, the locking positions of the retraction mechanism are simulated under different joint clearances (Jc1∼Jc7) and node position deviations (Adx1, Adz1, Adx2, Adz2). The analysis aims to assess their impact on kinematic accuracy and identify key factors influencing mechanism locking. Additionally, employing the Archard adhesive wear model, the wear amount of the seven joints during a single retraction cycle is calculated under various operating conditions.
2.3.1 Effects of node position deviation on kinematic accuracy
The variation of locking position offset with node position deviation within the range of −4 to 4 mm is illustrated in Fig. 6 and Fig. 7 while keeping other influencing parameters of the retraction mechanism constant. It’s noteworthy that the locking position offset in the Y direction is negligible and thus not presented.
Variation of locking position offset in X direction with node position deviation.

Variation of locking position offset in Z direction with node position deviation.

The following conclusions can be drawn: node position deviation significantly affects the locking position offset in the Z direction but has minimal impact on the locking position offset in the X direction. Specifically, when each node position deviation is 1.6 mm, the X-directional positive locking position offset is less than 0.63 mm, and the absolute value of the Z-directional locking position offset is less than 3.2 mm.
Aiming to mitigate the locking position offset, which is vital for the security of the retraction mechanism, the assembly accuracy of Adx1, Adx2 and Adz2 should be handled with the utmost care during the assembly of the landing gear system. During the maintenance phase, it is crucial to closely monitor the node position deviation of these places to prevent the mechanism locking failure caused by the excessive deformation of the fuselage structure.
2.3.2 Effects of joint clearance on kinematic accuracy
(1) Effect analysis of single joint clearance
The variation of locking position offset with joint clearance within the range of 0.01 to 3 mm is illustrated in Figs 8 and 9, while keeping other influencing parameters of the retraction mechanism constant. The locking position offset in the Y direction does not exceed 0.01 mm and therefore is not displayed.
Variation of locking position offset in X direction with joint clearance.

Variation of locking position offset in Z direction with joint clearance.

The following conclusions can be drawn: the impact of joint clearances on the locking position offset in the X direction is less significant than their impact on the locking position offset in the Z direction. Among the joint clearances, Jc3 has the most significant influence on the locking position offset, causing a positive locking position offset of 0.41 mm in the X direction and a negative locking position offset of 2.62 mm in the Z direction when its value is set to 1.6 mm. Joint clearances Jc1, Jc2 and Jc7 also have a notable impact on the locking position offset in the Z direction, causing a negative locking position offset of over 2.25 mm when their value is set to 1.6 mm. However, the influence of joint clearances Jc4, Jc5 and Jc6 on the locking position offset is relatively minor.
(2) Coupled effect analysis of joint clearance
In practical scenarios, joint clearances at various locations are subjected to varying degrees of wear, which may involve error compensation or accumulation. Hence, it is essential to conduct a coupled effect analysis of joint clearances based on the simulation model. Following engineering expertise, two joint clearances are selected from the seven positions, each set at a value of 1.60 mm, while the remaining joint clearances are set to 0.01 mm, resulting in a total of 21 conditions. The notation ‘1&2’ denotes the joint clearances Jc1 and Jc2 acting simultaneously. The locking position offsets obtained from simulations under coupled clearance conditions are illustrated in Figs 10 and 11. The locking position offset in the Y direction, not exceeding 0.05 mm, is omitted from the presentation.
Locking position offset in X direction under coupled clearance conditions.

Locking position offset in Z direction under coupled clearance conditions.

The following conclusions can be drawn: when the joint clearance Jc3 acts in conjunction with Jc1, Jc2 and Jc7, the positive X-directional locking position offsets are 0.096 mm, 0.106 mm and 0.273 mm, respectively, all less than when Jc3 acts alone. Joint clearances Jc1, Jc2 and Jc7 contribute to reducing the positive X-directional locking position offset. When joint clearances Jc1, Jc2, Jc3 and Jc7 are coupled pairwise, error accumulation occurs, resulting in negative Z-directional locking position offsets exceeding 3.6 mm, greater than when acting individually. When joint clearances Jc4, Jc5 and Jc6 are coupled, the negative Z-directional locking position offsets are all less than 1.6 mm.
In the range of 0 to 3 mm, the values of two joint clearances are sequentially altered, and the total locking position offset is simulated, as depicted in Fig. 12. The total locking position offset under each condition exhibits a linearly increasing relationship with the joint clearance size. The total locking position offset is particularly pronounced when joint clearances Jc1, Jc2, Jc3 and Jc7 are coupled pairwise, with the ‘3&7’ condition being especially prominent. In order to guarantee the locking safety of the retraction mechanism, the fit accuracy of joints 1, 2, 3 and 7 should be focused on in the landing gear design stage. During the maintenance process, it is essential to give priority to inspecting the clearance growth at these joints and to replace the bearings and bushings promptly based on the inspection results.
Total locking position offset under coupled clearance conditions.

2.4 Effect analysis on joint wear depth
2.4.1 Calculation of joint wear depth
In the prediction process of wear in components such as cams, revolute joints and gears, the Archard model is widely utilised [Reference Alakhramsing, de Rooij, van Drogen and Schipper42–Reference Wang, Zhou, Lei and Liu45]. This model offers the ability to predict wear rates based on factors such as relative motion, load and material hardness, making it highly versatile across various materials and operating conditions. Hence, the Archard wear model is employed to calculate the wear volume of the seven revolute joints, expressed as
 \begin{align}V = KF(t){L_s}/H\end{align}
here, V represents the wear volume,
 ${L_s}$
denotes the relative sliding distance of the motion joints, K is the wear coefficient,
 $F(t)$
represents the normal load between the motion joints, and H indicates the material’s Brinell hardness.
Assuming uniform wear in the motion joints, the wear volume is given by:
 \begin{align}V = \left[ {\pi {{\left( {r + h} \right)}^2} - \pi {r^2}} \right]b \approx 2\pi rhb\end{align}
where r denotes the radius of the shaft or hole, b represents the contact length between the shaft and hole, and h denotes the radius change of the shaft or hole (i.e. the joint wear depth).
The relative sliding distance of the motion joints per unit time is calculated as
 \begin{align}{L_s} = r\omega (t)dt\end{align}
here,
 $\omega (t)$
represents the relative angular velocity of the motion joints during the retraction or extension process, measured in rad/s.
By combining Equations (7) to (9), the joint wear depth can be obtained as
 \begin{align}h = \frac{{KF(t)}}{{2\pi bH}}\omega (t)dt\end{align}
Thus, the joint wear depth within one retraction cycle is determined as
 \begin{align}\Delta h = 2\int_0^{{t_r}} {\frac{{KF(t)}}{{2\pi bH}}\omega (t)dt} = \int_0^{{t_r}} {\frac{{KF(t)}}{{\pi bH}}\omega (t)dt} \end{align}
in which,
 ${t_r}$
represents the time taken by the mechanism for retraction or extension, measured in seconds.
Based on the dynamic model established in Section 2.2, the normal loads and relative angular velocities of those joints in the retraction mechanism are obtained, as shown in Figs 13 and 14.
Schematic of normal load for each joint.

Schematic of relative angular velocity for each joint.

According to Equation (11), the joint wear depth during one retraction cycle is calculated, as shown in Fig. 15. It can be observed that joints 1, 2, 6 and 7 exhibit relatively significant wear depths.
Schematic of joint wear depth.

2.4.2 Effects of node position deviation on joint wear depth
The node position deviation of the retraction mechanism affects the motion and loading of the joints, thereby influencing the wear depth. Therefore, analysing the variation of wear depth in each joint during one retraction cycle with respect to the node position deviation is essential, as depicted in Fig. 16.
Variation of wear depth in joints 1 to 7 with node position deviation.

The following conclusions can be drawn: joint 7 exhibits consistently greater wear depth compared to other joints, with the highest sensitivity to node position deviation Adx2, followed by Adz1. Joint 6 demonstrates higher sensitivity to node position deviations Adx1 and Adx2. With an increase in node position deviation Adx2, the wear depth of joints 1, 2 and 7 gradually increases, while that of joint 6 decreases gradually.
2.4.3 Effects of joint clearance on joint wear depth
Joint clearances have a significant impact on the load-bearing characteristics and joint wear of the mechanism. Therefore, analysing the variation of joint wear depth with joint clearance during one retraction cycle is crucial, as illustrated in Fig. 17.
Variation of wear depth in joints 1 to 7 with joint clearance.

Assembly schematic diagram of test prototype. (a) Test bench (b) Test prototype assembly.

The following conclusions can be drawn: joint 7 exhibits consistently greater wear depth compared to other joints, with the highest sensitivity to joint clearance Jc7 and the second-highest sensitivity to Jc3. Joint 6 demonstrates the highest sensitivity to Jc7, followed by Jc3 and Jc1. With an increase in Jc7, joint 6 exhibits a gradual increase in wear depth, while joint 7 shows a fluctuating decrease. As for Jc3, joints 1, 2, 6 and 7 experience a gradual decrease in wear depth, while joints 3, 4 and 5 show minimal variation.
Furthermore, compared to the initial state, the variation amplitude of wear depth in each joint during one retraction cycle under the influence of node position deviation and joint clearance is small. Thus, the order of wear rates among the joints remains constant, with joints 1, 2, 6 and 7 still accumulating wear at a relatively faster pace. Over time, the continuous accumulation of wear will gradually diminish the load-bearing capacity of the components. To prevent component failure due to wear, special attention must be given to the wear condition of joints 1, 2, 6 and 7, and regular maintenance and inspections should be carried out.
3.0 Kinematic accuracy test of retraction mechanism
The simulation analysis results are based on the simplified dynamic model. To validate its accuracy and assess the actual impact of influencing factors on the mechanism’s kinematic accuracy, a series of landing gear retraction mechanism tests are designed and conducted under various operating conditions. During the experiments, observations are made to determine if there are instances where the landing gear fails to lock successfully due to multiple structural clearances.
3.1 Test equipment
The physical test prototype is processed and assembled to the test bench, as shown in Fig. 18. To replicate the actual connection conditions of the landing gear during operation, adjustable fixtures have been utilised to secure the suspension rocker arm, resistance strut, retraction actuator and upper lock at their respective designated positions on the test bench.
The test equipment is mainly composed of the retraction control system, hydraulic station, retraction mechanism prototype, sensors and data acquisition equipment, as illustrated in Fig. 19. The retraction control system controls the start-up of the hydraulic station and the movement of the electromagnetic directional valve. The hydraulic station provides pressure for the retraction actuator and the unlocked actuator to drive the normal movement of the retraction mechanism. The motion state of the retraction mechanism is monitored in real time by the displacement and angle sensors installed on the mechanism, and the test data is transmitted to the dynamic signal testing system. The test objectives are to ascertain the stroke of the actuator, the rotation angle of the suspension rocker arm, and the rotation angle of the main strut. The sensor configuration is illustrated in Fig. 20.
Test equipment.

Sensor configuration. (a) Displacement sensor mounted on the actuator. (b) Angle sensor mounted on the suspension rocker arm. (c) Angle sensor mounted on the main strut.

3.2 Test schemes
3.2.1 Test for initial condition and node position deviation
In the initial condition, the variation curves of the rotation angle
 ${\theta _1}$
of the suspension rocker arm and the rotation angle
 ${\theta _2}$
of the main strut with respect to the actuator stroke L are depicted in Fig. 21. When the retraction mechanism has vertical and horizontal node position deviations, the rotation angles of the suspension rocker arm and the main strut with respect to the actuator stroke vary as depicted in Fig. 22. It can be observed that there is a good agreement between the experimental and simulated motion curves. The mean relative error for the rotation angles of the suspension rocker arm and the main strut is less than 10%.
Motion curves under the initial condition.

Motion curves under node position deviation.

3.2.2 Test for joint clearance
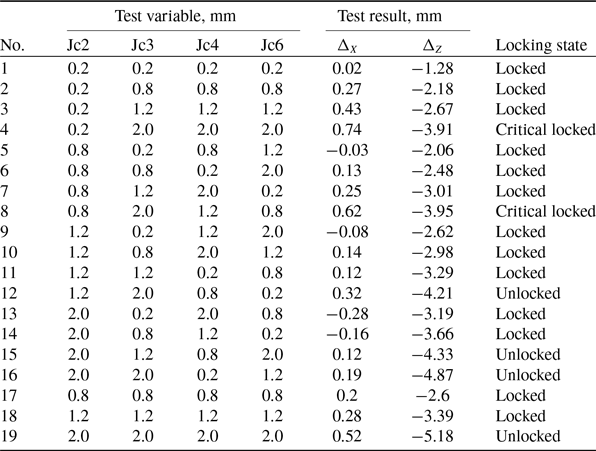
Based on the dynamic simulation analysis results, joint clearances Jc2, Jc3, Jc4 and Jc6 on the retraction mechanism are selected as test variables. Different-diameter shafts are used to simulate joint clearances, with each joint clearance being tested at four levels: 0.2, 0.8, 1.2 and 2.0 mm, respectively. The diameters of the holes at joints J2 and J3 are set to 50 mm, with shaft sizes of 49.8, 49.2, 48.8 and 48.0 mm. The diameters of the holes at joints Jc4 and Jc6 are set to 25 mm, with shaft sizes of 24.8, 24.2, 23.8 and 23.0 mm, respectively.
To streamline testing procedures and minimise time investment, an orthogonal test design method is employed, supplemented with three additional sets of typical test conditions. According to the test design table for the retraction mechanism shown in Table 3, periodic cyclic tests are conducted under each set of conditions, and the average locking position offset is measured.
Test design table and test results

During the testing process, abnormal locking is observed in six test conditions, as depicted in Fig. 23. Under the remaining conditions, the retraction mechanism’s locking proceeded normally, as shown in Fig. 24. In two of these test conditions, the mechanism reaches a critical locking state with measured Z-directional locking position offsets of −3.91 mm and −3.95 mm. In the other four test conditions, the locking ring is distant from the designated locking position, resulting in unsuccessful locking. The measured Z-directional locking position offsets in these cases are −4.21 mm, −4.33 mm, −4.87 mm and −5.18 mm, respectively.
Abnormal locking.

Normal locking.

In the aforementioned tests, the X-directional locking position offsets are all no higher than 0.74 mm, causing minimal impact on the abnormal locking of the mechanism, and hence, they are not considered significant. Therefore, it can be concluded that the negative Z-directional offset is the primary cause of the failure in the mechanism’s kinematic accuracy, with a lower limit of −3.9 mm for the Z-directional locking position offset.
As shown in Fig. 25, the locking position offsets obtained from tests and simulations exhibit consistent trends across different conditions, with relatively close numerical agreement. The average relative error of Z-directional locking position offset is 2.22%, while that of X-directional locking position offset is 11.7%. This suggests a reasonable degree of accuracy in the simulation model.
Comparison chart of locking position offset. (a) Projection in X direction. (b) Projection in Z direction.

3.3 Analysis of test results
To differentiate the primary and secondary effects of influencing factors in the tests and assess the specific levels of these factors, an effect analysis of the joint clearance test results is conducted, combined with some simulation data.
The main effects plot of the clearance parameters, as shown in Fig. 26, leads to the following conclusions: the influence of joint clearance on the X-directional locking position offset is less pronounced compared to its effect on the Z-directional locking position offset. Joint clearances Jc2 and Jc3 exhibit significant impacts on both X- and Z-directional locking position offsets, with Jc3 having the most substantial effect, causing positive X-directional offset and negative Z-directional offset.
Main effects plot of clearance parameters.

The interaction effects of the clearance parameters are depicted in Figs 27 and 28, leading to the following conclusions: when the values of Jc2 and Jc3 are identical, the negative X-directional offset caused by Jc2 partially counteracts the positive X-directional offset caused by Jc3, resulting in a smaller positive X-directional locking position offset. Increasing the clearance at either Jc2 or Jc3 results in a notable increase in the negative Z-directional locking position offset when both clearances act together. However, the variations in Jc4 and Jc6 have minimal impact on the Z-directional locking position offset when interacting with Jc2 or Jc3.
Interaction plot of clearance parameters on X-directional offset.

Interaction plot of clearance parameters on Z-directional offset.

These findings align with the variation pattern of mechanism kinematic accuracy obtained from simulation analysis.
4.0 Time-dependent reliability analysis and optimisation of retraction mechanism
Based on the experimentally validated complex dynamic model of the landing gear retraction mechanism, considering uncertainty factors such as node position deviation and joint clearance, a time-dependent reliability assessment of the mechanism’s kinematic accuracy is conducted. To reduce manufacturing costs and extend the service life of the mechanism, a reliability-based design optimisation model for the retraction mechanism is developed. This model aims to optimise manufacturing costs and joint accuracy allocation, achieving the most favorable balance between the two factors.
4.1 Reliability modeling of retraction mechanism
Based on the functional principle analysis of the mechanism, the main failure mode of the landing gear retraction mechanism is identified as kinematic accuracy failure. When the mechanism reaches the upper limit position, if the Z-directional locking position offset
 ${\Delta _Z}$
is less than the maximum allowable offset
 ${\Delta ^*}$
, the mechanism can successfully lock, thereby meeting the specified kinematic accuracy standard. The corresponding limit state function is represented as
 \begin{align}Z = g(X,Y(t)) = {\Delta ^*} - {\Delta _Z}(X,Y(t))\end{align}
here,
 $X = [{x_1},{x_2},{x_3},{x_4}]$
,
 $Y(t) = [{y_1}(t),{y_2}(t), \cdots, {y_7}(t)]$
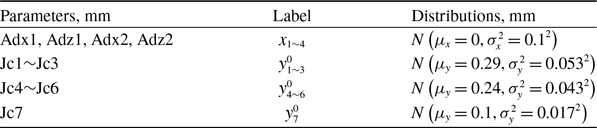
represent the random input variables affecting the kinematic accuracy of the retraction mechanism. The distribution information of these variables in their initial state is provided in Table 4.
The distribution of random variables

As the number of retraction cycles n increases, the wear accumulates on joints 1∼7, leading to a gradual increase in joint clearances. Considering the uncertainty in the initial clearances, the joint wear clearance can be expressed as follows
 \begin{align}y_i^n = y_i^{n - 1} + \Delta h_i^n = y_i^{n - 1} + \int_0^{{t_r}} {\frac{{KF_i^{n - 1}(t)}}{{\pi {b_i}H}}{\omega _i}(t)dt}, i = 1\sim7\end{align}
where,
 $y_i^n$
denotes the wear clearance of joint i at n cycles,
 $y_i^0$
is the initial clearance of joint i.
 $\Delta h_i^n$
represents the wear depth of joint i generated in the nth cycle, and
 $F_i^{n - 1}(t)$
is the normal load of joint i in the (n−1)th cycle.
The kinematic accuracy reliability of the retraction mechanism can be expressed as
 \begin{align}{P_r} = 1 - {P_f} = 1 - P(g(X,Y(t)) \le 0)\end{align}
Using the Monte Carlo method, the kinematic accuracy reliability of the retraction mechanism at n cycles can be approximated as
 \begin{align}{\hat P_r}^n = 1 - \hat P_f^n = 1 - \frac{1}{N}\sum\limits_{k = 1}^N {{I_F}({x_k},y_k^n)} \end{align}
here,
 ${x_k},y_k^n$
represents the kth sample value of the random input variables in the nth cycle.
 ${I_F}({x_k},y_k^n)$
is the indicator function, which equals 1 if the condition
 $g({x_k},y_k^n) \le 0$
is true and 0 otherwise.
The specific reliability modeling process is shown in Fig. 29.
Flowchart for the reliability modeling process.

4.2 Reliability assessment of retraction mechanism
To enhance the efficiency of reliability analysis, an approximate model of the limit state function of the landing gear retraction mechanism is constructed based on the surrogate model [Reference Zhang, Song, Bai and Li46–Reference Yu, Zhao, Yan, Wang, Yang and Hong48]. This study employs the artificial neural network (ANN) approach, which is renowned for its high accuracy and nonlinear mapping capability [Reference Dai, Zhao, Wang and Cao49, Reference Fei, Li, Liu, Lu, An, Han and Zhao50], to conduct the reliability evaluation.
4.2.1 Neural network model training
Five hundred sets of input data conforming to the distribution of node position deviations and joint clearances are randomly generated. These inputs are processed through the dynamic simulation model to compute corresponding output data, including the Z-directional locking position offset and the wear depths of the seven joints. In order to improve the training performance of the neural network, a BP neural network is constructed by using normalised sample data. The network adopts a three-layer structure, with the hidden layer employing the tangent sigmoid (tansig) function as the transfer function and the output layer using the pure linear (purelin) function. To prevent overfitting, the sample data fed into the network is divided into three sets: 80% for the training dataset and 10% each for the validation and test datasets. The Levenberg-Marquardt training algorithm is applied, with a maximum of 1,000 training epochs, a learning rate of 0.001, and a target minimum error threshold of 1×10⁻⁶. Training is automatically halted when the model’s training error falls below this threshold.
The training performance of the neural network’s output parameters, which include the Z-directional locking position offset and the wear depths of joints 2, 6 and 7, is illustrated in Fig. 30. Notably, the neural network model achieves a regression coefficient as high as 0.99042 and a maximum mean square error of 9.7×10⁻⁴. Moreover, the Z-directional locking position offset error histogram, shown in Fig. 31, demonstrates that the majority of errors fall within a narrow range, indicating a high level of accuracy.
Comparison between actual and predicted values.

Error histogram.

The trained neural network effectively captures the complex relationship between node position deviations, joint clearances, and the retraction mechanism’s performance. Therefore, the completion of neural network training is considered successful.
4.2.2 Kinematic accuracy reliability assessment
Based on the random variable distributions shown in Table 4, a large number of sample points are generated using the Monte Carlo method. These samples are then input into the trained neural network model to obtain the corresponding locking position offsets and joint wear depths. By substituting these output parameters into Equation (15), the variation curve of the kinematic accuracy reliability
 ${\hat P_r}$
against the number of retraction cycles n is obtained, as shown in Fig. 32. For retraction cycles ranging from 0 to 6400, the kinematic accuracy reliability of the mechanism remains above 0.999. However, as the number of retraction cycles exceeds 10,000, the reliability of the mechanism sharply declines due to the cumulative effects of joint clearances. At 11,000 retraction cycles, the kinematic accuracy reliability of the mechanism drops to 0.795.
Time-dependent reliability of retraction mechanism kinematic accuracy.

4.3 Reliability-based design optimisation of retraction mechanism
To address the issue of low kinematic accuracy reliability in the retraction mechanism, it is necessary to conduct reliability-based design optimisation to improve reliability and extend service life. Taking manufacturing cost as the optimisation objective and the kinematic the retraction mechanism is established to formulate the tolerance allocation scheme for each joint.
4.3.1 Sensitivity analysis of reliability
Given the numerous joint clearances in the retraction mechanism, conducting sensitivity analysis on kinematic accuracy reliability for each joint clearance is necessary to enhance optimisation design efficiency. This analysis helps in selecting appropriate joint clearance parameters as design variables.
Reliability sensitivity is defined as the partial derivative of the failure probability
 ${P_f}$
with respect to the j-th distribution parameter
 $\theta _{{x_i}}^{(j)}$
of the random variable
 ${x_i}$
[Reference Feng, Zhenzhou, Lijie and Shufang51], which can be obtained as follows
 \begin{align}\frac{{\partial {P_f}}}{{\partial \theta _{{x_i}}^{(j)}}} = \int_F {\frac{{\partial {f_X}(x)}}{{\partial \theta _{{x_i}}^{(j)}}}dx} = E\left[ {\frac{{{I_F}(x)}}{{{f_X}(x)}}\frac{{\partial {f_X}(x)}}{{\partial \theta _{{x_i}}^{(j)}}}} \right]\end{align}
where
 ${f_X}(x)$
represents joint probability density function,
 $F$
is the failure domain,
 $E[\! \cdot \!]$
denotes the expectation value of operator.
Using the Monte Carlo method, the estimated value of reliability sensitivity is given by
 \begin{align}\frac{{\partial {{\hat P}_f}}}{{\partial \theta _{{x_i}}^{(j)}}} = \frac{1}{N}\sum\limits_{k = 1}^N {\left[ {\frac{{{I_F}({x_k})}}{{{f_X}({x_k})}}\frac{{\partial {f_X}({x_k})}}{{\partial \theta _{{x_i}}^{(j)}}}} \right]} \end{align}
When input variables are independent and normally distributed, the reliability sensitivity estimates are
 \begin{align}\frac{{\partial {{\hat P}_f}}}{{\partial {\mu _{{x_i}}}}} = \frac{1}{N}\sum\limits_{k = 1}^N {\left[ {{I_F}({x_k}) \cdot \frac{{{x_{ki}} - {\mu _{{x_i}}}}}{{\sigma _{{x_i}}^2}}} \right]}\end{align}
 \begin{align}\frac{{\partial {{\hat P}_f}}}{{\partial {\sigma _{{x_i}}}}} = \frac{1}{N}\sum\limits_{k = 1}^N {\left\{ {{I_F}({x_k}) \cdot \frac{1}{{{\sigma _{{x_i}}}}}\left[ {{{\left( {\frac{{{x_{ki}} - {\mu _{{x_i}}}}}{{{\sigma _{{x_i}}}}}} \right)}^2} - 1} \right]} \right\}} \\[3pt]\nonumber\end{align}
Failure probability at 11,000 cycles variation with mean of clearance.

By sequentially changing the mean and standard deviation of each initial joint clearance, the failure probability of the mechanism is calculated at 11,000 retraction cycles. This procedure is illustrated in Figs 33 and 34. The conclusion drawn is that the mechanism’s failure probability gradually increases as the mean of the initial joint clearances increases, with Jc7 having the greatest impact on failure probability. The failure probability curves with respect to the mean and standard deviation of joint clearances Jc1, Jc2, Jc3 and Jc7 are concave curves. As the mean and standard deviation of the clearances increase, the rate of increase in the mechanism’s failure probability accelerates. The failure probability changes relatively smoothly with variations in the mean and standard deviation of Jc4, Jc5 and Jc6. The mean value of initial joint clearances has a greater influence on failure probability than the standard deviation.
Failure probability at 11,000 cycles variation with standard deviation of clearance.

When the mean and standard deviation of each initial joint clearance remain consistent, the reliability sensitivity of the clearance parameters during retraction cycles is calculated, as shown in Figs 35 and 36. The conclusion can be drawn that with an increase in the number of retraction cycles, the reliability sensitivity of each clearance mean gradually increases, with the sensitivity of Jc1, Jc2, Jc3 and Jc7 relatively higher. The reliability sensitivity range of each clearance standard deviation is relatively small. When the number of retraction cycles is less than 6200, the reliability sensitivity of both the mean and standard deviation of clearances is less than 0.01.
Reliability sensitivity of clearance mean during retraction cycles.

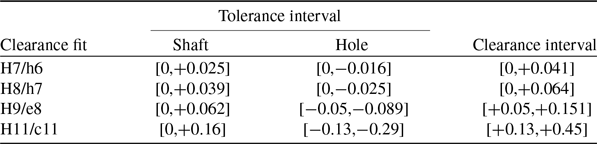
Dimensional tolerances for holes and shafts, mm

Reliability sensitivity of clearance standard deviation during retraction cycles.

According to the above analysis results, it is evident that when accounting for the dynamic evolution of wear clearances in each joint, the clearances Jc1, Jc2, Jc3 and Jc7 exert a significant influence on the kinematic accuracy failure probability of the retraction mechanism. This observation corroborates the conclusion reached in section 2.3.2, which emphasises the necessity to focus on the fit accuracy of joints 1, 2, 3 and 7 in the design phase. Ensuring the meticulous design and maintenance of these critical joints can substantially mitigate the risk of operational failures due to wear clearances, thereby enhancing the overall reliability of the mechanism.
4.3.2 Reliability optimisation model
(1) Design variables
Sensitivity analysis of joint clearances affecting the mechanism’s kinematic accuracy reliability identifies Jc1, Jc2, Jc3 and Jc7 as significant factors. Random variables
 $y_{1\sim3,7}^0$
are selected as controllable design parameters.
According to the international standard ISO 286 [52, 53], preferred clearance fits for the hole-basis fit system include H7/h6, H8/h7, H9/e8, H11/c11, etc. The corresponding dimensional tolerances for holes and shafts with a nominal size of 50mm are presented in Table 5. The mean
 ${\mu _y}$
of the initial joint clearances
 $y_{1\sim3,7}^0$
can be determined according to the ‘3σ’ principle, with values of 0.0205, 0.0320, 0.1005 and 0.2900 mm. Similarly, the standard deviation
 ${\sigma _y}$
can be selected as 0.0068, 0.0107, 0.0168 and 0.0533 mm.
(2) Objective function
The objective function aims to minimise the accuracy cost [Reference Sfantsikopoulos, Diplaris and Papazoglou54] of the hole-shaft fit at various joints in the retraction mechanism, as represented by
 \begin{align}\min {C_F} = {C_S} + {C_H} = \frac{{{C_{OS}} \cdot i{{(D)}^{{r_c} + 1}}}}{{{{({T_S} + {\lambda _S}{T_S})}^{{r_c}}}}} + \frac{{{C_{OH}} \cdot i{{(D)}^{{r_c} + 1}}}}{{{{({T_H} + {\lambda _H}{T_H})}^{{r_c}}}}}\end{align}
where,
 ${C_F}$
is the fit accuracy cost,
 ${C_S}$
is the shaft accuracy cost,
 ${C_H}$
is the hole accuracy cost.
 $i(D)$
is the ISO standard tolerance factor for the nominal diameter D,
 ${r_c}$
is a cost sensitivity to the tolerance exponent.
 ${C_{OS}}$
and
 ${C_{OH}}$
are process capability coefficients depending on the machining setup.
 ${T_S}$
and
 ${T_H}$
are dimensional tolerance intervals of the shaft and hole, respectively.
 ${\lambda _S}$
and
 ${\lambda _H}$
are geometric tolerance coefficients of the shaft and hole, respectively.
(3) Constraint conditions
The kinematic accuracy reliability of the retraction mechanism is set as the constraint, ensuring that the reliability still meets the requirement at the expected number of retraction cycles (n=11,000), represented as:
 \begin{align}{P_r}^n = 1 - P(g(X,Y(t)) \le 0) \geqslant {P_{re}}\end{align}
where
 ${P_{re}}$
is the specified kinematic accuracy reliability threshold, set to 0.99.
(4) Optimisation results
Using the test design method, the joint clearance design scheme is determined based on the reliability-based optimisation model of the retraction mechanism. The kinematic accuracy reliability at 11,000 cycles and the accuracy cost of the retraction mechanism are computed. Four optimisation schemes satisfying reliability constraints are obtained as shown in Table 6. Among them, the accuracy cost of scheme 1 and scheme 2 is lower, while the kinematic accuracy reliability of scheme 1 is slightly higher than that of scheme 2. Therefore, scheme 1 is chosen as the best optimisation scheme, achieving the best balance between cost-effectiveness and reliability. The time-dependent reliability curves after optimisation are shown in Fig. 37.
Optimisation schemes

Time-dependent reliability curves after optimisation.

5.0 Conclusion
The study addresses the issue of inadequate kinematic accuracy in multi-link complex mechanisms caused by multiple joint clearances and wear factors. Focusing on a certain landing gear retraction mechanism, the research involves analysing the effects on kinematic accuracy, conducting retraction tests and studying the dynamic changes in mechanism reliability, followed by reliability optimisation. The main conclusions are as follows:
-
(1) A time-dependent reliability analysis method considering cumulative wear for multi-link complex mechanisms is established, integrating multi-body dynamics simulation technology and test data analysis methods. This method enabled the determination of the variation curve of kinematic accuracy reliability with retraction cycles, providing a robust framework for predicting the lifespan and performance degradation of complex motion mechanisms.
-
(2) The dynamic model of the landing gear retraction mechanism and wear model are used for simulation analysis to study the influence of node position deviations and joint clearances on the kinematic accuracy of the mechanism and the wear depth of each joint. By identifying the key influencing factors, the corresponding detection and maintenance suggestions are put forward to ensure the safe locking of the retraction mechanism.
-
(3) With the retraction mechanism’s joint clearances taken into consideration, the failure boundary for the locking position offset is determined through the retraction mechanism kinematic accuracy tests, which aids in the fault diagnosis and maintenance management of the aircraft lock mechanism. Effect analysis is employed to ascertain the variation pattern of the locking position offset with clearances, consistent with simulation analysis conclusions, thereby validating the accuracy of the simulation model.
-
(4) Considering the uncertainty of node position deviation and initial joint clearance, a time-dependent reliability optimisation model for the retraction mechanism incorporating wear evolution is established. The joint dimensional tolerance allocation scheme with the lowest accuracy cost is obtained while meeting the reliability requirement for the retraction mechanism.
-
(5) Facing the actual engineering requirements, future research should focus on the generating mechanism of failure modes such as motion stagnation, insufficient kinematic accuracy, and component fatigue of complex mechanisms while considering the gradual damage factors such as wear and corrosion. Then the multi-objective reliability design optimisation of complex mechanisms should be carried out to balance the requirements for the total weight and the fit accuracy cost, ultimately leading to a comprehensive enhancement in the mechanism performance.
Competing interests
The authors declare that they have no known competing financial interests or personal relationships that could have appeared to influence the work reported in this paper.
Acknowledgments
This study was supported by the National Natural Science Foundation of China (52172368, 52275114, 52302453), the Natural Science Foundation of Jiangsu Province (BK20220135), the Research Fund of State Key Laboratory of Mechanics and Control for Aerospace Structures (Nanjing University of Aeronautics and astronautics) (MCAS-I-0224G03), the Prospective Layout Research Special Fund of Nanjing University of Aeronautics and Astronautics (1001-ILB23008).