Implications
Adaptation of sows to dietary fibre components is important for in vitro fermentation studies when assessing fermentation capacity of fibrous feed components. The currently recommended 2 weeks of adaptation seem too short to allow sows to fully adapt and reach a stable situation. This implies that many studies in literature may not estimate the feeding value of a diet correctly. Our study showed no constant values for fermentation kinetics within 19 days after a diet change. For the in vivo situation it means that the time an animal receives a specific ingredient also determines the feeding value.
Introduction
Dietary fibre consists mostly of non-starch polysaccharides (NSP) and plays an important role in the nutrition of pigs. Especially for breeding sows or fattening pigs housed under organic farming conditions, a significant proportion of the diet consists of fermentable fibrous ingredients. The increased dietary fibre inclusion (e.g. in the form of grass silage) stipulated for these classes of animals is intended to improve animal health and welfare. Ingestion of additional fermentable substrates can reduce health problems like enteric diseases including diarrhoea, and can reduce stereotypic behaviour (Williams et al., Reference Williams, Verstegen and Tamminga2001; De Leeuw et al., Reference De Leeuw, Bolhuis, Bosch and Gerrits2008). Fermentable substrates can be fermented by microbes residing along the entire gastrointestinal (GI) tract, although the majority of the fermentation especially of slowly fermentable fibre occurs in the large intestine of pigs (Bach Knudsen et al., Reference Bach Knudsen, Hedeman and Lærke2012). Inclusion of fibre sources in diets of pigs can result in a reduced digestibility of other nutrients, due to shorter digesta transit time. Furthermore, diets high in fibre generally contain a low content of digestible nutrients and of digestible energy. This may potentially reduce animal performance and as such profitability (Chabeauti et al., Reference Chabeauti, Noblet and Carré1991; Owusu-Asidu et al., Reference Owusu-Asiedu, Patience, Laarveld, van Kessel, Simmins and Zijlstra2006; Bindelle et al., Reference Bindelle, Leterme and Buldgen2008). The extent of fermentation in the large intestine depends on the amount and type of substrate present in the diet as well as on the adaptation of the large-intestinal microbiota in terms of composition and activity (Williams et al., Reference Williams, Verstegen and Tamminga2001; Bach Knudsen et al., Reference Bach Knudsen, Hedeman and Lærke2012).
A well-established method to estimate fermentability of different fermentable substrate sources is the in vitro gas production technique. In this method faeces from donor animals are used as source of microbiota-inoculum to incubate the substrate to be tested. During incubation of the substrate, the cumulative gas production is measured over time and fermentation end-products are quantified at the termination of the incubation. The results of such in vitro studies can be used to rank substrates and provide insight into their fermentability, that is kinetics of microbial degradation and products formed (Williams et al., Reference Williams, Bosch, Boer, Verstegen and Tamminga2005). In this type of in vitro fermentation studies, faecal donor animals are fed a well-defined diet in order to obtain a standardised microbial community. For many in vitro fermentation studies involving pigs, a dietary adaptation time of 7 to 14 days is routinely used when a new diet is implemented (Bauer et al., Reference Bauer, Williams, Bosch, Voigt, Mosenthin and Verstegen2004; Anguita et al., Reference Anguita, Canibe, Pérez and Jensen2006; Bindelle et al., Reference Bindelle, Buldgen, Delacolette, Wavreille, Agneessens, Destain and Leterme2009; Martín-Peláez et al., Reference Martín-Paláez, Manzanilla, Anguita, Fondevila, Martín, Mateu and Martín-Orúe2009). Interestingly, there is a general lack of information on the time required for the large intestinal microbiota to adapt to the diet fed to the pigs for these in vitro fermentation studies. Varel et al. (Reference Varel, Robinson and Jung1987) showed an increase of Bacteroides succinogenes and Ruminococcus flavefaciens content in chyme when 8-month-old barrows of unknown BW were changed from a control diet (3.3% cellulose) to a diet containing 40% alfalfa meal (14.0% cellulose). Faecal cellulolytic bacteria numbers and cellulase activity were relatively stable for the control animals compared to the animals fed a high fibre containing diet which showed major fluctuations over the 86-day study. No asymptotic plateau was reached in terms of faecal bacteria numbers or cellulase activity after 86 days. It should be noted that the latter study was conducted with growing barrows and data could have been affected by potential changes in microbiota composition due to physiological, metabolic and anatomical changes.
The present study aimed to investigate the adaptation of faecal microbes in sows over a 19-days period in relation to a dietary change from a high to a low fibre diet (HL-treatment) and from a low to a high fibre diet (LH-treatment). Faecal microbiota composition was assessed using the Pig Intestinal Tract Chip (PITChip; Pérez Gutiérrez, Reference Pérez Gutiérrez2010; Haenen et al. Reference Haenen, Zhang, da Silva, Bosch, van der Meer, van Arkel, van den Borne, Perez Gutierrez, Smidt, Kemp, Muller and Hooiveld2013), and activity was evaluated using in vitro gas production kinetics and fermentation end-product profiles.
Material and methods
Animals, housing and feed
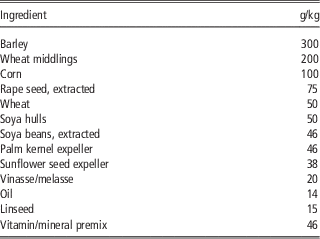
Eighteen adult multiparous, non-pregnant sows (mean BW±standard error: 252±25.3 kg) of a commercial crossbreed (Camborough: (Landrace×Large White)×Duroc) were used. Sows were housed individually in single pens of 3×4 m with 50% of the floor area as solid concrete and 50% as slatted floor. Bedding material was not provided. Before allocation of the experimental diet to the sows, each animal had received 3 kg of a compound feed (Table 1) at maintenance level (calculated as 1% of live weight, Centraal Veevoederbureau (CVB), 2010) for at least 3 weeks. Three weeks before the actual study took place (adaptation period), sows were randomly assigned to one of two dietary treatments: a diet high (H-) or low (L-) in fibre. The diet low in fibre (L) consisted of the standard compound feed (Table 1), which was designed to meet the maintenance energy requirements of non-pregnant sows. The diet high in fibre (H) consisted of a daily amount of the standard compound feed to meet 70% of the energy maintenance requirement of non-pregnant sows (calculated as 0.7% of BW; CVB, 2010) supplemented with 3 kg of fresh grass silage (estimated 60% NSP/DM; Sappok et al., Reference Sappok, Pellikaan, Verstegen, Bosch, Sundrum and Hendriks2013b). The daily feed/silage provided a contrast in the fibre intake by sows with the reduction in the amount of compound feed offered implemented to ensure a high intake of grass silage.
Ingredient composition of compound feedFootnote 1

1 Provided per kg diet: Ca, 9.8 g; Na, 2.0 g; P, 6.7 g; lysine, 7.3 g; methionine, 2.3 g; CuSO4.5H2O, 21 mg; vitamin A (E672), 12060 IE; vitamin D3 (E671), 2010 IE; vitamin E (E307), 60 IE; 3-phytase (E1600), 503 FTU.
The compound feed was fed in two equal portions at 0800 and 1600 h throughout the adaptation period and the study, whereas the grass silage was provided in 1 kg-portions at 0800, 1200 and 1600 h. All sows had free access to drinking water and were fed their respective diet for 3 weeks. At the start of the main period of the study (day 1), the animals previously fed the high-fibre diet were changed to the low-fibre diet (HL-treatment, n=9) and the sows fed the low-fibre diet were changed to the high-fibre diet (LH-treatment, n=9). Sows were weighed twice, 3 days before the main period started and on the last day of the experiment. Feed samples (compound feed and silage) were collected at the same day as faecal sampling, pooled at the end of the experiment and used for chemical analyses. Handling of the animals was approved by the Institutional Animal Care and Use Committee of Wageningen University and was in accordance with the Dutch Law on the use of experimental animals, with amendments made to this law in accordance with Council Directive 86/609/EEC (http://wetten.overheid.nl/BWBR0003081/).
Faecal collection and inocula preparation
At the start of the main experimental period (day 1), the nine sows within each dietary treatment were randomly assigned to three subgroups of three animals. Within a subgroup, faeces of individual animals were pooled and mixed so that three inocula per diet treatment were obtained at each sampling day. Faeces (100 to 200 g per animal) were manually collected directly from the rectum of each sow at seven time points, that is day 1, 4, 7, 10, 13, 16 and 19 after the diet change. The faecal samples were immediately stored in plastic containers pre-flushed with CO2, placed on crushed ice, transported to the laboratory within 1 h after collection and prepared for incubation. Collection of faecal samples and the inoculum preparation was performed at the same time in the same order on each sampling day to reduce variation in fermentation activity due to sampling. In the laboratory, individual faecal samples from individual sows were homogenized, and fresh faeces (± 6.5 g) of each of the three sows in a subgroup were pooled into one sample. To each pooled sample, 180 ml of a 0.9% NaCl solution was added, and the mixture was homogenized with a blender for 1 min after which the mixture was filtered through a nylon cloth (pore size 40 µm, permeability 30%; PA 40/30; Nybolt, Zürich, Switzerland). One ml of filtrate was collected for the profiling of microbial composition and immediately frozen at −80°C. The filtrate was added to a bicarbonate-phosphate buffered solution as described by Williams et al. (Reference Williams, Bosch, Boer, Verstegen and Tamminga2005) in the ratio 1 : 16.8 on a weight/volume basis. The preparation of each inoculum was carried out under a constant flow of CO2 to ensure that anaerobic conditions were maintained.
Substrates
The three substrates used for incubation were chosen based on their difference in fermentation characteristics (own observations in our laboratory): oligofructose (highly fermentable), soya pectin (highly fermentable) and cellulose (slowly fermentable). Oligofructose (Orafti® P95) was obtained from Orafti (Tienen, Belgium), soya pectin (Soyafibre-S-DA 100) from Fuji Oil Company Ltd. (Ibaraki, Japan) and cellulose (Vitacel® powdered cellulose for food, LC 200) from J. Rettenmeier and Soehne GmbH+Co (Rosenberg, Germany). All substrates were air-dried and in powder form.
Incubation
During each of the seven fermentation runs (day 1, 4, 7, 10, 13, 16 and 19), three replicate batch fermentations were incubated simultaneously per inoculum–substrate combination. Per run and inoculum, one blank bottle without substrate was included to monitor background fermentation. Substrates (±0.5 g DM) were accurately weighed into 300 ml fermentation bottles (Schott, Mainz, Germany) previously filled with CO2. Subsequently, 89 ml of buffered inoculum solution was dispensed into each bottle, which was then placed in a shaking water (40 r.p.m.) bath at 39°C. Bottles were attached to an ‘automated gas production system’ and cumulative gas production was measured by summing the vented gas volumes of consecutive valve openings as described by Cone et al. (Reference Cone, van Gelder, Visscher and Oudshoorn1996). After 72 h incubation was terminated, the pH of the fermentation fluid was recorded (Hanna Instruments pH meter; Woonsocket, RI, USA) and fermentation fluid was collected for analyses of short-chain fatty acids (SCFA) and for ammonia (NH3). Samples were stored at −20°C.
Chemical analyses
Feed samples and substrates were analysed for dry matter (DM; ISO 6496, 1999), ash (ISO 5984, 2002) and crude protein (CP; ISO 5983, 2005). Feed samples were also analysed for crude fat (CFAT; ISO 6492, 1999) and for NDF, ADF and ADL contents according to the methods described by Goering and Van Soest (Reference Goering and van Soest1972). The filtrates from diluted pooled faecal samples were analysed for DM and pH. SCFA were measured using a gas chromatograph and NH3 was analysed colorimetrically as described by Bosch et al. (Reference Bosch, Pellikaan, Rutten, van der Poel, Verstegen and Hendriks2008).
Microbial composition profiling
The analysis of faecal microbiota was carried out using a phylogenetic microarray comprehensively targeting pig GI tract microbiota, the so-called Pig Intestinal Tract Chip (PITChip), developed by Pérez Gutiérrez (Reference Pérez Gutiérrez2010) and successfully applied by Haenen et al. (Reference Haenen, Zhang, da Silva, Bosch, van der Meer, van Arkel, van den Borne, Perez Gutierrez, Smidt, Kemp, Muller and Hooiveld2013). The updated version of the PITChip (V2.0) used in this study contained over 3300 oligonucleotides targeting 782 bacterial phylotypes reported to occur in the porcine gastrointestinal tract.
DNA extraction from filtered faecal pool samples mixed with 0.9% NaCl solution was performed according to the repeated bead beating (RBB) procedure described by Yu and Morrison (Reference Yu and Morrison2004) with minor modifications reported by Salonen et al. (Reference Salonen, Nikkilä, Jalanka-Tuovinen, Immonen, Rajilić-Stojanović, Kekkonen, Palva and de Vos2010). The DNA was isolated by sequential precipitations and finally purified using the QIAamp DNA Stool Mini Kit columns (Qiagen, Hilden, Germany) according to the manufacturer’s recommendations. A fluorometric Quant-iTTM PicoGreen ® reagent (Molecular Probes, Eugene, OR, USA) was used to measure the DNA content. Additionally, Nanodrop sprectrophotometer (NanoDrop® Technologies, Wilmington, DE, USA) and 0.8% agarose gels were used for the quantification and qualification of the DNA extracts.
Hybridization and analysis of the generated data was performed using procedures as described by Rajilić-Stojanović et al. (2007 and Reference Rajilić-Stojanović, Heilig, Molenaar, Kajander, Surakka, Smidt and de Vos2009) and modified by Pérez Gutiérrez (Reference Pérez Gutiérrez2010) for the PITChip. Two primers (T7prom-Bact-27-for and Uni-1492-rev) were used for amplification of bacterial 16S rRNA gene fragments from 10 ng of DNA extracted from the pooled faecal saline solutions that were used as inoculates. PCR products were purified using the NucleoSpin Extract II Kit (Macherey-Nagel, Düren, Germany) and DNA concentration was measured spectro-photometrically (ND-1000, NanoDrop® Technologies). In vitro transcription of the for 16S rRNA coding genes (the template DNA) carrying the T7-promoter was performed with the Riboprobe System (Promega, La Jolla, CA, USA). After 2 h incubation at room temperature, the template DNA was digested with the Qiagen RNAse-free DNAse kit (Qiagen) and RNA was purified with the RNeasy Mini-Elute Kit, (Qiagen). The RNA concentration was quantified spectro-photometrically. The in vitro transcribed RNA was coupled with CyDye using post-labelling reactive dye (Amersham Biosciences, Little Chalfont, UK) dissolved in DMSO for fluorescent labelling. The labelling reactions were incubated during 90 min in the dark at room temperature. The reaction was stopped by addition of hydroxyl-amine and incubation in the dark for 15 min. After termination of the reaction, RNAse-free water was added and the labelled RNA quantified. Custom microarrays of the 8×15 K format were synthesized by Agilent Technologies (Palo Alto, CA, USA). Hybridization of the arrays and labelled samples was performed at 62.5°C for 16 h in a rotation oven (Agilent), after which slides were washed in several steps. Data extraction from scan images was done with the help of the Agilent Feature Extraction software, version 9.1 (http://www.agilent.com).
Calculations and statistical analyses
Total gas production was calculated as the amount of gas produced per gram organic matter (OM) of substrate initially incubated (termed OMCV=organic matter corrected volume; in ml/g OM) after fitting a monophasic model (Groot et al., Reference Groot, Cone, Williams, Debersaques and Lantinga1996):
 $${\rm OMCV}={\equals}(A/(1{\plus}(C/t)^{B} ))$$
where OMCV is the total gas produced (ml/g OM), A is the asymptotic gas production (ml/g OM), B is a constant determining the sharpness of the switching characteristic of the curve, C is the time at which half of the asymptotic gas production is reached (h) and t represents the time (h). The maximum rate of gas production (R
max in ml/h) and the time (h) at which it occurred (
 $$T_{{R_{{\max }} }} $$
) were calculated from the following equations (Bauer et al., Reference Bauer, Williams, Voigt, Mosenthin and Verstegen2001):
 $$\eqalignno{ R_{{max}}={\equals}(A{\times}(C^{B} ){\times}B{\times}({T_{{R_{max}}}}^{{({\minus}B{\minus}1)}}))/(1{\plus}(C^{B} )\cr\quad\qquad{\times}({T_{{R_{max}}}}^{{({\minus}B)}} ))^{2} \cr & T_{{R_{max}}}={\equals}C{\times}\left( {((B{\minus}1)/(B{\plus}1))^{{(1/B)}} } \right) $$
The gas production parameters (e.g. OMCV, C, R max) and end point parameters concentrations of NH3 and total SCFA (calculated as sum of acetate, propionate, butyrate, iso-butyrate, valeric acid and iso-valeric acid), and the molar proportions of the three main SCFA (acetate, propionate and butyrate) are shown as means. Means per substrate were calculated from three inocula per run, which in turn were calculated from the three simultaneously incubated bottles used per inoculum and substrate, hence, inoculum mix of three sows was regarded as the experimental unit.
The data were analysed per substrate as a repeated measurement in the MIXED procedure of SAS (Statistical Analysis Systems, version 9.2; SAS Institute, Cary, NC, USA), using the following model:
 $$Y_{{ijk}} {\equals}\mu =T_{i} {\plus}D_{j} {\plus}(T_{i} {\times}D_{j} ){\plus}{\epsilon}_{{ijk}} $$
with the main model effects ‘treatment’ (T i ) and ‘day (of fermentation run)’ (D j ), (T i ×D j ) as the interaction between ‘treatment’ (HL v. LH) and ‘day’ (day 1,4, …, 19) and ε ijkl as the error term. Inoculum was used as subject. Day of fermentation (after diet change) was treated as a repeated measurement assuming a first order autoregressive covariance structure [AR(1)] because AR(1) fitted the data best based on the Bayesian information criterion (BIC) and Akaike information criterion (AIC) values (Littell et al., Reference Littell, Henry and Ammermann1998; Tempelman, Reference Tempelman2004). In case of significant effects of T i , D j or (T i ×D j ), post hoc analyses were performed for testing differences between treatments, days and between days within treatment, respectively, using the Tukey–Kramer’s multiple comparison procedure in the LSMEANS statement in SAS.
To assess the significance of observed differences in relative abundance of individual microbial groups at the approximate genus level (90% sequence similarity threshold), two-tailed, unpaired t-tests were applied using log10-transformed (log10[x+0.01]) relative abundance based on PITChip hybridization data. Resulting P-values were corrected for multiple comparisons, using the ‘q-value’ script as implemented in the Bioconductor package for R (R Development Core Team, 2009).
Simpson’s Reciprocal Index (1/D) was used to measure the diversity of microbial profiles obtained by the PITChip analysis and was calculated with the equation 1/D=1/∑Pi2, where Pi is the proportion of each phylotype signal compared to the total of level 2 phylogenetic groups (n=35) within a sample. A higher value for the Simpson’s Reciprocal Index indicates to a higher degree of diversity.
In order to assess the amplitude of overall changes in microbial community composition between the two treatments during the experimental period, a principle response curve (PRC) analysis was carried out using relative abundance of level 2 phylogenetic groups as species data in a redundancy analysis using the CANOCO 4.5 software package (Biometris, Wageningen, the Netherlands) (Van den Brink and Ter Braak, Reference Van den Brink and ter Braak1999; Ter Braak and Šmilauer, Reference Ter Braak and Šmilauer2002). Results of day 1 for the HL-treatment were used as reference point. Treatment was introduced as an environmental variable and the sampling time points as co-variables.
Results
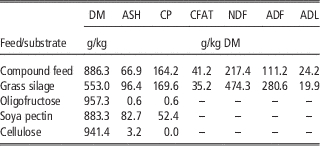
The pigs remained in good health. Sows in the HL-treatment gained 9 kg (not significant) during the trial (mean from 249 to 258 kg), and sows of the LH-treatment maintained the same weight (255 kg). The entire daily supplied compound feed was consumed by the sows in both treatments. The precise silage intake per pig was not quantified. Visual estimation showed that left overs approximately amounted to 25%. Sows switched from the low to the high fibre diet needed 3 days to fully accept the silage. The chemical analysis of compound feed, grass silage and substrates is shown in Table 2. The silage contained a similar concentration of CP per unit of DM compared with the compound feed but more than twice the amount of NDF and ADF on DM basis. The soya pectin contained 52.4 g CP/kg DM and an ash content of 82.7 g/kg DM, while both the CP and ash contents of the oligofructose and cellulose substrate were below 3.2 g/kg DM.
Proximate analyses of the compound feed and grass silage fed to sows and fermentation substrates used in the in vitro fermentation assay

CFAT=crude fat; DM, dry matter; –, not determined.
Fermentation characteristics
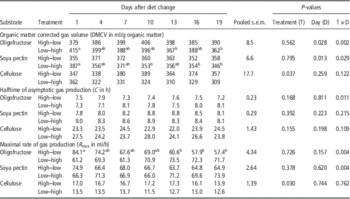
The average gas production of the blank bottles was 15.4±7 ml over the five fermentation runs. No run-effect could be observed for the blanks. Table 3 shows the mean gas production (OMCV), halftime (C) and maximal rate of gas production (R max) obtained during fermentation of the substrates oligofructose, soya pectin and cellulose. A significant treatment×day interaction (P⩽0.029) was found for OMCV for oligofructose and soya pectin. Day of fermentation run had a significant effect on oligofructose and soya pectin fermentation (P⩽0.028), with a higher OMCV for the LH-treatment on day 1 compared with days 13 and 19 for oligofructose, and with a higher OMCV on day 1 compared with days 10, 16 and 19 for soya pectin. For OMCV from cellulose, the HL-treatment yielded higher values than the LH-treatment (P=0.037 for treatment) but no increase with time. The halftime at which asymptotic gas production was reached (C) was relatively similar for the readily fermentable substrates oligofructose and soya pectin, 7.6 and 8.4 h. For cellulose it was 24.5 h. A significant treatment×day interaction (P=0.011) occurred for C during the fermentation of oligofructose. Post hoc analyses did not reveal any significant differences between days within treatments. Maximal rate of gas production was similar for the substrates oligofructose and soya pectin, about 67.9 and 68.2 ml/h. For cellulose it was 14.7 ml/h.
In vitro fermentation parameters (OMCV, C and R max) after 72 h of in vitro fermentation for three substrates fermented with faecal inoculum of sows receiving high or low fermentable diets over a 19-day period after the diet change

a,bMeans with different superscripts within row differ significantly (P<0.05); high–low, treatment where diet was changed from high to low fibre; low–high, treatment where diet was changed from low to high fibre.
A significant treatment×day interaction (P=0.004) was found for R max during fermentation of oligofructose and soya pectin. The interaction for the fermentation of oligofructose was mainly caused by a higher R max for the HL-treatment on day 1 compared with days 13, 16 and 19. Furthermore, a decrease of R max with time after diet change was noted for the HL-treatment and an increase occurred for the LH-treatment during fermentation of oligofructose and soya pectin. Treatment had an effect only on cellulose fermentation (P=0.030), with the inocula from HL-treated sows showing a faster fermentation compared with the LH-treated sows.
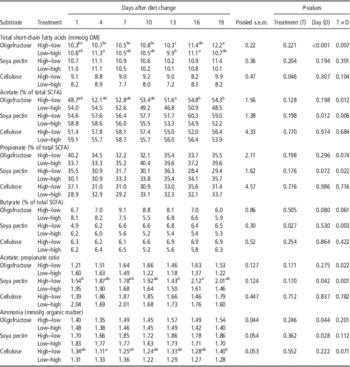
Table 4 shows the means of SCFA concentration, acetate: propionate ratio and NH3 concentration obtained during fermentation of the substrates oligofructose, soya pectin and cellulose. Fermentation of oligofructose and soya pectin yielded higher SCFA concentrations compared with cellulose, both 10.7 v. 8.5 mmol/g OM. A significant treatment×day interaction (P=0.007) was found for the concentration of SCFA for oligofructose. Day of fermentation run had a significant effect on oligofructose fermentation (P<0.001) with a higher SCFA concentration for the HL-treatment on day 19 compared with days 1 to 13. No effect of day was found for soya pectin and cellulose (P⩾0.194). There was a treatment effect for cellulose (P=0.046) with the HL-treatment yielding higher SCFA values than the LH-treatment.
Concentrations of short-chain fatty acids, the molar proportions of acetate, propionate and butyrate, the acetate: propionate ratio and ammonia concentration after 72 h of in vitro fermentation for three substrates fermented with faecal inoculum of sows receiving high or low fermentable diets over a 19-day period after a dietary change

a,bMeans with different superscripts within row differ significantly (P<0.05); high–low, treatment where diet was changed from high to low fibre; low–high, treatment where diet was changed from low to high fibre.
The acetate: propionate ratio for the HL-treatment was highest during fermentation of oligofructose and soya pectin and was less for the LH-treatment. A significant treatment×day interaction occurred for the ratio during the fermentation of oligofructose and soya pectin (P⩽0.022). Post hoc analyses did not reveal any significant differences between days within treatments for oligofructose. Day of fermentation run had a significant effect on soya pectin fermentation (P=0.042) with a higher ratio for the HL-treatment on days 16 and 19 compared with day 1 and 13. No day effect was observed for cellulose nor oligofructose (P⩾0.275).
Fermentation of soya pectin yielded the highest NH3 concentration, followed by oligofructose and cellulose (1.76, 1.46 and 1.29 mmol/g OM). No treatment×day interaction was found for NH3. A day effect was observed (P⩽0.044) during fermentation of oligofructose and soya pectin, but no effects were observed for fermentation of cellulose.
Analysis of faecal microbial composition
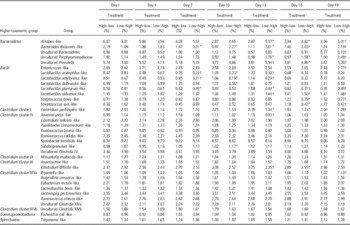
Faecal microbiota dynamics were determined in sows during the first 19 days after a change in diet from high to low fibre and from low to high fibre, respectively. Table 5 shows the development of relative abundance of genus-level phylogenetic groups of bacteria in the sow’s large intestine on different days after the diet change (day 1) as measured by two-tailed, unpaired t-tests, corrected for multiple comparisons, for both treatments.
Relative abundance (%) of genus-like phylogenetic groups of faecal microbiota (relative contribution>1%) for the two dietary treatment groups high–low (n=3) and low–high (n=3) over a 19-day period after a dietary changeFootnote 1

1 High–low, treatment where diet was changed from high to low fibre; low–high, treatment where diet was changed from low to high fibre. Threshold for q-value set at †⩽0.10 and *⩽0.05 to indicate differences in abundance between treatment groups (HL v. LH).
The largest differences in relative abundance were observed for members of the Bacteroidetes and Bacilli. On days 1 and 4, the animals in the HL-treatment had a higher abundance of members of the Bacteroidetes compared to the animals in the LH-treatment. In turn, the abundance of a number of groups belonging to the Bacilli was lower for animals in the HL-treatment. From day 7 onwards, however, the relationship between Bacteroidetes and Bacilli was reversed, and the LH-treatment showed a higher relative abundance of Bacteroidetes and a lower abundance of Bacilli compared to the HL-treatment. Significant changes could be seen on day 7, 10, 13 and 16 for several other groups in both treatments. Except for day 1, Clostridium perfringens-like species showed a lower relative abundance in the LH-treatment compared to the HL-treatment. The difference was significant on day 13 and 16. For the LH-treatment, Clostridium difficile-like species were significantly less abundant on day 13, while other groups showed non-significant differences.
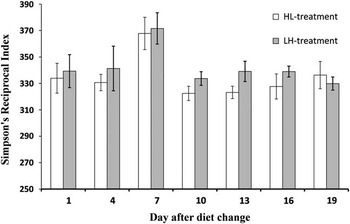
Microbial diversity as measured by the Simpson’s Reciprocal Index is shown in Figure 1. On most days after the diet change, Simpson’s Reciprocal Index (1/D) fluctuated around 329 (s.d.±5.15) for the HL-treatment and around 337 (s.d.±3.95) for the LH-treatment, except for day 7. On day 7 after diet change the reciprocal index was significantly higher (P<0.001) for both treatments and reached 368 and 372, respectively. Comparison of the data for the two treatments over time showed an on average 2.3% higher reciprocal index for the LH-treatment compared with the HL-treatment although this difference was not significant (P=0.130).
Simpson’s Reciprocal Index for both treatments at different days after a diet change. A higher index indicates a higher degree of diversity. HL, treatment where diet was changed from high to low fibre; LH, treatment where diet was changed from low to high fibre. abDays with different superscripts differed significantly from each other (P<0.001), treatments did not differ.

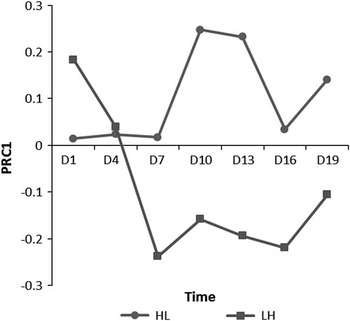
PRC analysis, which allows identification of differences in microbiota composition between treatments in time, showed that the two treatments differed more towards the end of the experiment compared to the beginning (Figure 2). However, none of the canonical axes were significant. The two treatments showed relatively equal microbiota composition on day 4 after the diet change. For the LH-treatment, the largest change in microbiota composition occurred between day 4 and 7 while for the HL-treatment, it occurred between day 7 and 10. On day 7, the composition between microbial species changed for both treatments and was reversed compared to day 1 and remained reversed the following days, confirming observations made by univariate analyses of variation in individual microbial groups as described above. The difference of microbial composition between treatments was mainly caused by a change in species of Bacteroidetes and Bacilli (data not shown) after the diet change; relative abundance of members of the Bacteroidetes was relatively high on day 1 for the HL-treatment and decreased over time, while relative abundance of Bacilli was relatively low on day 1 for the LH-treatment and increased.
Principal response curves of microbiota composition for two dietary treatments after 1, 4, 7, 10, 13, 16 and 19 days when diet was changed. HL, treatment where diet was changed from high to low fibre; LH, treatment where diet was changed from low to high fibre. Shown are the first principle response curves (PRC1) for both treatments.

Discussion
The study reported here was conducted in order to investigate the adaptation of faecal microbes in sows over a 19 days period after sows were changed from a high to a low fibre diet (HL-treatment) or from a low to a high fibre diet (LH-treatment). The high fibre diet (30% NDF) included silage as major NDF source and was expected to lead to a different microbial activity and community compared to the diet low in fibre (22% NDF) which consisted of a standard compound feed for sows.
Differences between fermentation parameters
Fermentation parameters OMCV, C, and R max, and end-product profiles (SCFA and NH3 concentrations and acetate: propionate ratio) did not differ much between treatments for the substrates oligofructose and soya pectin, but they did differ for cellulose. The faecal microbiota of the animals in both treatments had similar fermentation capacity for highly fermentable substrates but differed for slow fermentable substrate cellulose. The OMCV and C values presented here are within the range of values found in other studies (Bauer et al., Reference Bauer, Williams, Voigt, Mosenthin and Verstegen2001; Bindelle et al., Reference Bindelle, Buldgen, Michaux, Wavreille, Destain and Leterme2007; Sappok et al., Reference Sappok, Pellikaan, Verstegen, Bosch, Sundrum and Hendriks2013a and Reference Sappok, Pellikaan, Verstegen, Bosch, Sundrum and Hendriks2013b). R max values observed in the latter studies ranged from 55 to 70 ml/h for oligofructose and soya pectin, which is only slightly lower compared to the R max values obtained using the faeces from the animals on a high fibre diet in the present study (84.1 and 71.7 ml/h). For the fermentation of cellulose, the average R max values in these studies (Bauer et al., Reference Bauer, Williams, Voigt, Mosenthin and Verstegen2001; Bindelle et al., Reference Bindelle, Buldgen, Michaux, Wavreille, Destain and Leterme2007; Sappok et al., Reference Sappok, Pellikaan, Verstegen, Bosch, Sundrum and Hendriks2013a) ranged between 14 and 19 ml/h compared to an average value of 12.9 ml/h found here for the LH-treatment, but were similar to values found for the HL-treatment (16.4 ml/h). Concentrations of SCFA were relatively similar compared to previous studies (Bauer et al., Reference Bauer, Williams, Voigt, Mosenthin and Verstegen2001; Sappok et al., Reference Sappok, Pellikaan, Verstegen, Bosch, Sundrum and Hendriks2013b) for all substrates. The significant difference in gas production found across days of adaptation for oligofructose and soya pectin occurred mainly due to a decreased OMCV over time for the LH-treatment, which was also reflected in a decreased SCFA concentration for soya pectin. The concentration of acetate decreased with days for both substrates (9% for oligofructose and 19% for soya pectin, data not shown), suggesting a decrease in acetogenic bacteria, which results in less gas production. It is known that gas production depends on the composition of SCFA and acetate yields the largest amounts of gas (Beuvink and Spoelstra, Reference Beuvink and Spoelstra1992). A reason for the decrease in OMCV and the shift in SCFA metabolism could be that the microbiota in the LH-treatment was initially adapted to high concentrations of readily fermentable substrates available in the low fibre diet, which decreased after the diet change and led to a different microbiota composition producing less gas. The lower OMCV and SCFA for cellulose with the LH-treatment compared to the HL-treatment indicates that the microbiota of LH-animals are not adapted well enough to effectively ferment cellulose. This pattern was persistent throughout the 19-day period and implies that the feeding value of cellulose in the LH-animals is also less compared with the HL-treatment. In contrast to the decreased OMCV, R max measured for the LH-treatment increased for oligofructose and soya pectin (15% and 10%), while it decreased for the HL-treatment (32% for oligofructose and 13% for soya pectin). Gas production (OMCV) remained relatively stable over time for the HL-treatment compared to the LH-treatment, which indicates that adaptation of the HL-animals was not complete and occurs relatively slow. However, there is a bigger difference in R max for the HL-treatment between days 1 and 19 compared to the LH-treatment. So between OMCV and R max there are considerable differences with days after diet introduction between LH and HL-treatments. This means that after substrate supply change microbe population changes and also its activity. The change has not disappeared 19 days after the change of diet. This means that adaptation of microbial population and its activity is not complete after 19 days, so if feeding values of the fibre ingredients have been measured within 19 days fixed values cannot be used. We therefore conclude that if values are not constant in this time period the use of fixed asymptotic values as in tables may not be appropriate. In addition, if the diet continues to change the use one may need other parameters for its value.
The large difference in R max for the HL-treatment between day 1 and 19 compared to the LH-treatment indicates that adaptation of the large intestinal microbiota may not be fully complete for the LH-treatment. A longer period of adaptation would likely lead to a further increase. A low R max was found on day 19 for the HL-treatment compared to the previous days, comparable to the average R max for the LH-treatment, indicating that adaptation was not fully completed. Compared to the other substrates and treatments, the concentration of SCFA increased most during fermentation of oligofructose when animals were changed from a high to a low fibre diet. This might indicate that large intestinal microbiota from sows adapting to a lower fibre diet preferentially ferment oligofructose as apparent from SCFA production compared to microbiota from sows adapting to a high fibre diet. For SCFA concentration, a plateau was not reached for either treatment after 19 days for any substrate; values for the last 3 days changed with 7% to 15%.
The animals which were previously on a high fibre diet (HL-treatment) had an overall higher capacity to ferment cellulose compared to the LH-treatment (11% for OMCV and 22% for R max). A reason for this observation could be that microbiota from animals in the LH-treatment had an overall lower capacity to ferment cellulose or were not fully adapted yet. It is known from previous studies (Sappok et al., Reference Sappok, Pellikaan, Verstegen, Bosch, Sundrum and Hendriks2013a and Reference Sappok, Pellikaan, Verstegen, Bosch, Sundrum and Hendriks2013b) that the capacity of pigs to ferment fibre can vary between inocula up to 25% in terms of R max. Previous studies have shown that adaptation of microbiota in the large intestine to fibre can take over 86 days in terms of cellulase activity. Varel et al. (Reference Varel, Pond and Yen1984) showed that cellulase activity in faeces of gilts increases rapidly within the first 5 days after changing to a high fibre diet (35% alfalfa meal), then decreases until 37 days and subsequently increases until 86 days without reaching a plateau. Longland et al. (Reference Longland, Low, Quelch and Bray1993) fed growing pigs (25 to 45 kg) diets containing sugar beet pulp or wood-cellulose and concluded that it takes 21 to 35 days before stable values for whole tract digestibility are reached.
It can be concluded that the full fermentation capacity of microbiota from the LH-treatment was not reached yet after 19 days of feeding grass silage and more time would have been needed for microbes to reach a stable activity. This was an unexpected finding as the majority of in vitro fermentation studies allow pigs to adapt to the diets for 7 to 14 days (Bauer et al., Reference Bauer, Williams, Bosch, Voigt, Mosenthin and Verstegen2004; Anguita et al., Reference Anguita, Canibe, Pérez and Jensen2006; Awati et al., Reference Awati, Williams, Bosch, Li and Verstegen2006; Bindelle et al., Reference Bindelle, Buldgen, Delacolette, Wavreille, Agneessens, Destain and Leterme2009; Martín-Peláez et al., Reference Martín-Paláez, Manzanilla, Anguita, Fondevila, Martín, Mateu and Martín-Orúe2009). Thus, animals in the HL-treatment might have also not been fully adapted on day 1 of the actual experiment, after consuming silage for 3 weeks in the pre-experimental period. Especially for slowly fermentable substrates like cellulose, 19 days of adaptation to a high fibre diet is not sufficient to reach constant fermentation capacities. In hind side, a longer period than 19 days would have been advantageous to determine the precise period of total adaptation of pigs to diets contrasting from nearly no or few easy fermentable NSP and with a high level of NSP.
However, it has to be considered that the composition of roughages (grass silage fed to sows) underlies natural variability, due to time and location of harvest, but also due to a varying intake and dietary selection by animals. Microbiota is continuously adapting to changes in substrate supply and it could be that no steady state can be obtained when roughages are fed. Future studies should examine a more extended time period after a diet change has occurred, especially when the diet changes from low to high fibre.
Dynamics of microbiota composition after the diet switch
The largest changes in microbiota during the study period were detected for the relative abundance of members of the Bacteroidetes, which was lower for animals on a low fibre diet and relatively higher for animals on a high fibre diet (Table 5). The results for the first two fermentation runs (day 1 and 4) showed that the relative abundance of Bacteroidetes was lower for the LH-treatment, compared to HL-treatment, suggesting that silage intake directly after the diet change is still minor as compared to later in the experimental period.
On day 7, however, the relative abundance of Bacteroidetes was higher for the LH-treatment compared to the HL-treatment, suggesting that the main shift in microbial composition after a diet change including grass silage seems to occur in about 7 days (or earlier) after the diet change. This was confirmed with PRC analysis, showing that the difference in microbiota composition between treatments remained relatively constant during the later phase of the experiment (Figure 2).
Only limited information is available concerning the relationship between fibre and microbiota composition in the porcine large intestine. Thirty years ago, Varel et al. (Reference Varel, Pond, Pekas and Yen1982) reported that especially Bacteroides succinogenes and Ruminococcus flavefaciens increased when pigs were fed high fibre diets with alfalfa as a fibre source. In line with the previous finding from Varel et al. (Reference Varel, Pond, Pekas and Yen1982), Lin et al. (Reference Lin, Gong, Wang, Cui, Yu and Huang2011) showed that when fibres were fermented to SCFA in batch cultures using pig intestinal digesta, the most prominent bands after DGGE of PCR-amplified bacterial 16S rRNA gene fragments were affiliated with Bacteroidetes and Firmicutes. The observed change in microbial composition for the LH-treatment occurring between 4 and 7 days after the diet change indicates that digesta at this time starts providing noticeably slower fermentable substrates for those members of the bacterial community (likely Bacteroidetes) using this as an energy source. In turn, for animals changed to a low fibre diet (HL-treatment) digesta seems to provide less slowly fermentable and more readily fermentable substrate after 4 to 7 days after the diet change for those members of the microbial community (likely Bacilli) which can utilize more readily fermentable substrates compared to those in grass silage.
The Simpson Reciprocal Index (1/D) showed that the diet change either from low to high or from high to low fibre lead to the highest bacterial diversity on day 7 after the diet change (Figure 1). This might be related to the above-mentioned microbial switch for members of Bacteroidetes and Bacilli, which had occurred by day 7. The high index changes after a diet change indicated that there are more species at 7 days after the diet change due to the changing fibre-content of digesta, whereas at a later time the diversity seems to decrease again and the level of diversity remains stable, pointing towards establishment of a community adapted to the new digesta composition.
Regarding the PRC, the main change in microbial composition occurred at the end of the first week after the diet change and reached a plateau after 16 days. However, it cannot be confirmed yet if this microbial shift remains stable after 19 days.
In future studies, emphasis should be placed on the development of microbial species in relation to fermentation kinetics, using advanced functional microbiomics approaches such as metatranscriptomics and metaproteomics. These approaches, compared to 16S rRNA gene-targeted approaches such as DGGE- and PITChip analysis, can more directly provide information regarding the metabolic activity of intestinal microorganisms based on the identification of active pathways (Kolmeder et al., Reference Kolmeder, de Been, Nikkila, Ritamo, Matto, Valmu, Salojarvi, Palva, Salonen and de Vos2012; Zoetendal et al., Reference Zoetendal, Raes, van den Bogert, Arumugam, Booijink, Troost, Bork, Wels, de Vos and Kleerebezem2012).
Conclusions
A diet change led to significant changes in fermentation and microbial composition within 19 days for readily fermentable substrates oligofructose and soya pectin. No significant changes for cellulose indicated that for slow fermentable substrates the adaption might take longer than 19 days. The recommended 2 weeks of adaptation in already conducted studies are too short to fully adapt sows, especially for slow fermentable feeds.
Changes in gas production were higher for animals of the LH-treatment compared to the animals of the HL-treatment, indicating a faster adaptation of animals when they are changed from a low to a high fibre diet compared to when they are changed from a high to a low fibre diet for readily fermentable substrates. Overall, adaptation of the large intestinal microbiota of sows as a result of ingestion of low and high fibre diets seems to take longer than 19 days, especially for the ability to ferment slowly fermentable substrates. However, the main change in members of the Bacteroidetes and Bacilli seems to occur within the first 7 days after a diet change.
Acknowledgements
The authors kindly acknowledge the technical assistance of Mr R. Verkerk and Mr B. van den Top from the experimental facility ‘de Haar’ of Wageningen University, and the laboratory assistance of Ms S. van Laar, Ms J.-M. Muijlaert, Mr M. Breuer, Mr A. Wissink and Ms X.H. van der Schans-Lé, and Mr A. Lammers from the Adaptation Physiology Group of Wageningen University. J. Zhang and P. van der Brink are acknowledged for assistance with Principle Response Curve analyses.