

Introduction
It is generally known that there is a correlation between the size of the nuclei and of the cytoplasm in many different types of cells. An established nuclear-to-cytoplasmic ratio (NC ratio) during mitosis has been found in many cell types such as sea urchin embryos (Hertwig, Reference Hertwig1903), fission yeasts (Neumann and Nurse, Reference Neumann and Nurse2007), budding yeasts (Jorgensen et al., Reference Jorgensen, Edgington, Schneider, Rupes, Tyers and Futcher2007) and angiosperms (Jovtchev et al., Reference Jovtchev, Schubert, Meister, Barow and Schubert2006). Although a correlation between DNA content and nuclear size has been reported (Jovtchev et al., Reference Jovtchev, Schubert, Meister, Barow and Schubert2006), no increase in nuclear size was found when DNA was replicated in the S phase (Jorgensen et al., Reference Jorgensen, Edgington, Schneider, Rupes, Tyers and Futcher2007; Neumann and Nurse, Reference Neumann and Nurse2007). The nuclear size of fission yeast cells was not affected, even with a 16-fold increase in DNA content (Neumann and Nurse, Reference Neumann and Nurse2007). While numerous studies have reported on the NC ratio during mitosis, little information is known about how the pronuclear size at the end of meiosis II is regulated and determined in mammalian zygotes. Also, the mechanisms of pronuclear formation remain elusive.
During meiosis, the DNA content decreases twice from 4C to 2C and from 2C to 1C, while the number of chromosomes is reduced from 2N to 1N during the first meiosis, which then remains at 1N after the entry of a sperm into an oocyte. During the process of fertilization, a sperm cell forms a male pronucleus within an oocyte. The oocyte then releases a polar body while the chromosomes within the oocytes form a female pronucleus. The two pronuclei gradually increase their size until syngamy (Otsuki et al., Reference Otsuki, Iwasaki, Tsuji, Katada, Sato, Tsutsumi, Hatano, Furuhashi, Matsumoto, Kokeguchi and Shiotani2017, Reference Otsuki, Iwasaki, Enatsu, Katada, Furuhashi and Shiotani2019). Therefore, the NC ratio of pronuclei may have different features from the NC ratio during mitosis. In our previously published work (Otsuki et al., Reference Otsuki, Nagai, Lopata, Chiba, Yasmin and Sankai2012) that deals with the symmetrical division of mouse oocytes during meiotic maturation, which can lead to the development of twin embryos that amalgamate to form a chimeric hermaphrodite, we proposed that the smaller the size of the cytoplasm becomes, the smaller the size of the pronucleus becomes. In the course of our experiments, we also observed asymmetrical cell divisions, with different sizes of oocytes, which were larger than the size of the polar bodies. As the size of divided cells depends on the angle of the MI spindle in relation to the surface, we obtained many differently sized MII oocytes during these experiments. To extend our previous results, our present study analyzed the NC ratio of female and male pronuclei, and also compared the size of monopronuclei by means of photographs, which were obtained in the course of our reported work.
Materials and methods
Image data analysis from previous experiments
During our previously published experiments, gentle compression of mouse oocytes during meiosis I prevented the usual extrusion of a small polar body and resulted in the symmetrical/asymmetrical division of the ooplasm into two cells within the zona pellucida (Otsuki et al., Reference Otsuki, Nagai, Lopata, Chiba, Yasmin and Sankai2012). The divided oocytes were fertilizable by IVF when a part of the zona pellucida was opened using a laser and subsequently pronuclei formed in both of the cells. Images were taken focusing clearly on each female and male pronucleus using a digital camera (Nikon D200), which was equipped with a DIC inverted microscope (Nikon ECLIPSE TE2000-U).
Image analysis
Pixel Annotation Tool software (v.1.4.0) was used for all image colour coding. Images of pronuclei and cytoplasm were segmented with filled colour and the size of the pronuclei and cytoplasm were measured using Open Source Computer Vision Library (v.4.1.2) by calculating the number of pixels within the each coded colour. A larger pronucleus was considered to be a male pronucleus and a smaller one was considered to be female. Volumes were converted from square measures. Zygotes that contained second polar bodies were used in these studies.
Statistical analysis
All statistical analyses were performed with numpy.polyfit and EZR v.1.51 (Saitama Medical Center, Jichi Medical University, Saitama, Japan), which is a graphical user interface for R (The R Foundation for Statistical Computing, Vienna, Austria). Differences were considered statistically significant when the P-value was < 0.05. Receiver operating characteristic (ROC) curves were used to determine a cut-off value of volumes.
Results
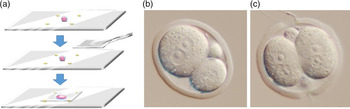
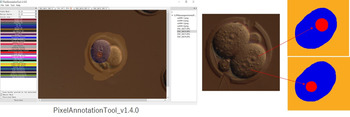
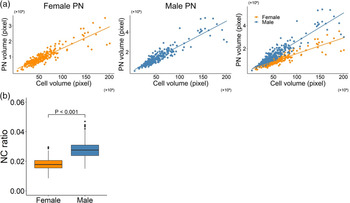
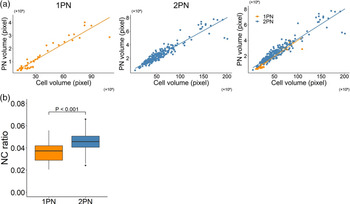
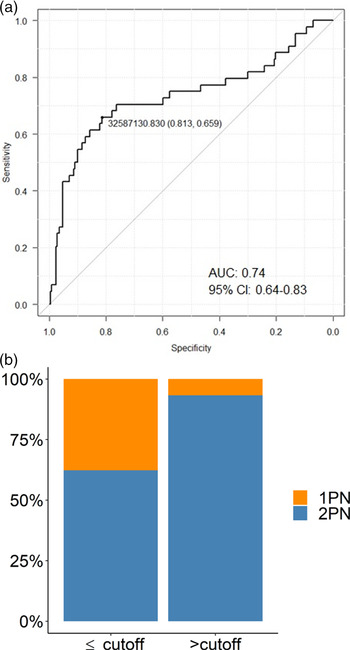
Figure 1 shows an example of 2-cell MII oocyte after MI oocytes were gently compressed to prevent the usual extrusion of a small polar body. The male and female pronuclei that formed after IVF, and the cytoplasm in each cell was colour coded using Pixel Annotation Tool software (Figure 2). The volumes of both female and male pronuclei were found to be strongly correlated with the volume of the cytoplasm (Figure 3a, left and centre). The average NC ratio was 0.018 in female pronuclei, whereas it was 0.028 in male pronuclei (Figure 3b). The average NC ratio of the male pronucleus was also significantly greater than that of the female pronucleus (P < 0.001) (Figure 3b). The volume of 1PN and the total volume of 2PN were strongly correlated with the cell volume (Figure 4a, left and centre). The average NC ratio of 2PN (total volume of female and male pronuclei) was significantly greater than that of 1PN (P < 0.001) (Figure 4b). ROC curve analysis showed that the cut-off value for the differences in volumes between 1PN and 2PN was 3.26 × 107 pixel volume (AUC: 0.74, 95% CI: 0.64–0.83) (Figure 5a). 1PN occurrence was significantly higher when the volume of cytoplasm was lower than the cut-off value (P < 0.001) (Figure 5b).
(a) Diagram showing gentle compression of MI stage oocyte that prevents the usual extrusion of a small polar body, which results in symmetrical/asymmetrical 2-cell oocytes. (b) Example of a zygote derived from an asymmetrical 2-cell MII oocyte. (c) Example of a zygote derived from a symmetrical 2-cell MII oocyte.

Male and female pronuclei, and cytoplasm in each cell were colour coded using Pixel Annotation Tool software. Images of pronuclei and cytoplasm were segmented with filled colour in red and blue respectively and the size of the pronuclei and cytoplasm were measured using Open Source Computer Vision Library (Open CV) by calculating the number of pixels within each coded colour.

Correlation between volumes of pronuclei and cytoplasm in mouse zygotes. (a) Left: Correlation between volume of female pronuclei and volume of cytoplasm (y = 0.014x + 1.90 × 10⁵, R2 = 0.81). Centre: Correlation between volume of male pronuclei and volume of cytoplasm (y = 0.025x + 1.45 × 10⁵, R2 = 0.83). Right: Left and centre graphs were combined. (b) Average NC ratio in female and male pronuclei. The average NC ratio was 0.018 in female pronuclei, while it was 0.028 in male pronuclei. The average NC ratio of the male pronucleus was significantly greater than that of the female pronucleus (P < 0.001).

Correlation between total volumes of 2PN and 1PN zygotes. (a) Left: Correlation between volume of 1PN and cell volume (y = 0.041x – 1.01 × 10⁵, R2 = 0.89). Centre: The correlation between the total volume of 2PN and cell volume (y = 0.038x + 3.36 × 10⁵, R2 = 0.88). Right: Left and centre graphs were combined. (b) Average NC ratio in 1PN and 2PN zygotes. Average NC ratio in 2PN zygotes was significantly greater than that in 1PN (P < 0.001).

Occurrence of 1PN and volumes of cytoplasm in fertilized zygotes. (a) ROC curve analysis showed that the cut-off value for the differences in volumes between 1PN and 2PN was 3.26 × 107 pixel volume (AUC: 0.74, 95% CI: 0.64–0.83). (b) 1PN occurrence was significantly higher when the volume of the cytoplasm was lower than the cut-off value (P < 0.001).

Discussion
In this study, it was found that the size of both female and male pronuclei correlated with the size of the cytoplasm when mouse oocytes were experimentally cleaved into two cells of different size. Therefore, in mouse zygotes, the NC ratio was retained although the volume of the male pronucleus was approximately 1.6 times larger than the female pronucleus, in studies in which the larger pronucleus was clearly identified as male (Adenot et al., Reference Adenot, Mercier, Renard and Thompson1997). A convincing explanation as to why the male pronucleus is larger than the female pronucleus has not yet been published. This difference in size may be related to the transcriptional activity that is greater in male pronuclei than in female pronuclei (Aoki et al., Reference Aoki, Worrad and Schultz1997) or to the higher concentration of transcription factors in male pronuclei than in female pronuclei (Worrad et al., Reference Worrad, Ram and Schultz1994). It has been reported that, after fertilization, the highly condensed chromatin of sperm undergoes marked morphological changes related to the replacement of protamines by histones. Subsequently, the paternal chromatin becomes decondensed within the male pronucleus. In contrast, in the female pronucleus after second polar body extrusion, the chromosomes become decondensed into filamentous chromatin. In the present study, the apparent NC ratio, at which the volume of the cytoplasm begins to increase was found to enlarge to a greater extent in cells that contain male pronuclei rather than female pronuclei.
Some studies have reported that the size of the nucleus is associated with transport through nuclear pore complexes. Theerthagiri et al. (Reference Theerthagiri, Eisenhardt, Schwarz and Antonin2010) showed that two components of the nucleoporin (Nup) 93 complex, Nup188 and Nup205, were indispensable for nuclear pore complex formation, while depletion of Nup188 increased the nuclear size, due to an increased transport of proteins through the nuclear pore in Xenopus eggs. Some experimental data suggest that diffusible cytoplasmic factors have an influence on nuclear size (Gurdon, Reference Gurdon1976; Neumann and Nurse, Reference Neumann and Nurse2007, Levy and Heald, Reference Levy and Heald2010). In fact, importin α was reported to act as a sensor for cell surface area to volume ratio in Xenopus embryos and human cells (Brownlee and Heald, Reference Brownlee and Heald2019). For future analysis, it might be interesting to investigate those molecules, which may have a different sensor for cell surface area or a different number of nuclear pore complexes contained in female and male pronuclei.
From our studies with human oocytes, we reported previously that male pronuclei are larger than female pronuclei at the beginning of pronuclear formation, but the difference in size gradually diminished and the sizes become similar at the end of the zygotic stage. Such zygotes are known to be capable of giving birth to healthy babies (Otsuki et al., Reference Otsuki, Iwasaki, Tsuji, Katada, Sato, Tsutsumi, Hatano, Furuhashi, Matsumoto, Kokeguchi and Shiotani2017, Reference Otsuki, Iwasaki, Enatsu, Katada, Furuhashi and Shiotani2019).
In humans, a single pronucleus (1PN) may occur after in vitro fertilization and the incidence has been reported to be 2.7–5.6% (Staessen et al., Reference Staessen, Janssenswillen, Devroey and Van Steirteghem1993; Balakier et al., Reference Balakier, Squire and Casper1993; Otsu et al., Reference Otsu, Sato, Nagaki, Araki and Utsunomiya2004). However, its occurrence is very rare in mouse oocytes and we have not seen any 1PN formation in normally fertilized, uncompressed mouse oocyte during our experiments. The size of the 1PN in human zygotes was reported to be larger when the maternal and paternal genomes were both within a single pronucleus (Otsu et al., Reference Otsu, Sato, Nagaki, Araki and Utsunomiya2004). In our current study, the incidence of 1PN oocytes was found to be significantly higher when the volume of the cytoplasm was smaller than the cut-off value. The results of our studies could indicate that 1PN formation occurs when a sperm fuses with the plasma membrane of oocytes in close proximity to the metaphase II spindle. As zygotes that exhibited second polar bodies were only used for this study, chromosomal triploidy in 1PN and chromosomal monoploid male 1PN formation are unlikely explanations. However, parthenogenetically activated female 1PN could not be excluded in the present study. Several studies have shown that in mouse oocytes, sperm are specifically excluded from binding to the oolemma in a relatively large membrane domain above the underlying MII spindle, which suggests that this feature may prevent sperm penetration (Johnson et al., Reference Johnson, Eager, Muggleton-Harris and Grave1975; Van Blerkom and Caltrider, Reference Van Blerkom and Caltrider2013; Van Blerkom and Zimmermann, Reference Van Blerkom and Zimmermann2016). As microvilli have been reported to be evenly distributed around the surface of human MII stage oocytes (Santella et al., Reference Santella, Alikani, Talansky, Cohen and Dale1992) unlike the oocytes of mice (Longo and Chen, Reference Longo and Chen1984), diploid mono-pronuclear formation may occur. Such events may also take place during natural human conceptions, particularly when entry of the fertilizing sperm is close to the MII spindles and the second polar body is extruded.
Although available data were limited, there were three major novel findings obtained for the mouse zygotes that were evaluated. The zygotes retained their NC ratio during pronuclear formation. Such zygotes were observed to have a greater NC ratio with male rather than with female pronuclei. Moreover, we observed a higher incidence of 1PN formation in zygotes with a smaller volume of cytoplasm. As NC ratios with male and female pronuclei are similar in human zygotes, a finding that is quite different from that in the mouse, it may be useful to further investigate the structural and/or molecular differences in zygotes with two pronuclei and those with a single pronucleus in both mice and humans.
Financial support
None.
Conflict of interest
None of the authors has any conflict of interest to declare.
Ethical statement
This paper used only photographs obtained during experiments for our previous study (Otsuki et al., Reference Otsuki, Nagai, Lopata, Chiba, Yasmin and Sankai2012 in Human Reproduction journal). Consequently, no ethical consent was required.