

Standard-of-living debates in history
The controversy as to living standards during the Industrial Revolution has perhaps been of most value when it has passed from the somewhat unreal pursuit of the wage-rates of hypothetical average workers and directed attention to articles of consumption: food, clothing, homes: and, beyond these, health and mortality.Footnote 1
In recent decades, many economic historians of Britain and other parts of Europe have investigated the consequences of accelerated economic change on the living standards of various classes within the population. The debate over living standards during the industrial revolution in Britain has rumbled on since the 1960s, and debates in other parts of Europe have also attracted considerable scholarly attention. Recently, scholars have also begun to examine issues relating to living standards and well-being in parts of Asia, especially India, China and Japan.Footnote 2 Several different indicators have been used, including trends in real wages rates, trends in mortality rates and anthropometric measures (heights and weights).
The purpose of this paper is to review the evidence relating to changes in living standards across South East Asia in the first four decades of the twentieth century, using a range of indicators. There are several reasons for making such comparisons. First, South East Asia has until now been largely neglected in debates over the impact of economic growth on living standards, at least until the 1960s. This is particularly unfortunate because rates of economic growth in most parts of South East Asia were quite rapid in the decades from 1900 to 1930; certainly they were more rapid than in China and India.Footnote 3 South East Asia is thus an important ‘laboratory’ for examining the extent to which colonial governments were able to convert growing national output into improved living standards for the local populations. A further reason for making comparisons is that, after 1900, official attitudes to welfare policies changed in South East Asia, and increasingly the various colonial regimes were not just introducing new policies themselves, but also studying those of neighbouring regimes.
The paper tries to answer four specific questions. First, can we draw any conclusions about living standards in South East Asia across colonial territories at the end of the 1930s, when the Japanese army was poised to bring the era of western colonialism to a dramatic end? Second, can we draw conclusions about changes in living standards in particular colonies in the decades from 1900 through to 1940? Third, which indicators are most useful and reliable for scholars who are trying to assess changes in living standards either across countries or over time? And fourth, to the extent that changes did occur over time in particular colonies, what role did governments play in bringing about these changes? But before reviewing the evidence, the paper examines why official concerns about living standards among colonial populations in South East Asia became more evident after 1900.
Changing official attitudes to colonial welfare policies
By the early twentieth century, colonial governments in several parts of Asia were taking a more activist approach to promoting economic development in the territories they controlled. In 1901 the Calvinist-Catholic coalition which had come to power in The Netherlands announced that a ‘new approach would be taken in colonial management’.Footnote 4 The emphasis was on improving living standards through increasing agricultural output, and through the expansion of education in vernacular languages, and the movement of people from the densely settled parts of Java and Bali to other parts of the huge Indonesian archipelago. Government expenditures on irrigation, harbour works, transport infrastructure and land settlement all increased substantially over the first three decades of the twentieth century.Footnote 5 In addition, the government developed a rural credit system, established village rice banks and reformed the network of pawnshops, which became an important source of credit for indigenous Indonesians.
Dutch concerns over ‘indigenous welfare’ reflected a nagging concern shared among all the European colonial powers in Asia by the early twentieth century that impoverished colonial populations would not just be of little benefit to the metropolitan power, but could become a serious liability. This concern was prompted in part by the increasing demands on the part of metropolitan populations themselves for greater economic security, as well as a stronger voice in political affairs. Lindert has shown that expenditures on social transfers (including unemployment benefits, pensions, health and housing subsidies) in France and the United Kingdom at least doubled, relative to GDP, between 1890 and 1930; in The Netherlands they tripled.Footnote 6 Given these growing demands on public finances from their own populations, the main European colonial powers were increasingly reluctant to undertake policies in their colonies which might lead to further charges on the home budgets. If public expenditures were to increase in the colonies, the money would have to come from revenues raised by the colonial governments. And increased revenues would be easier to mobilize if colonial economies were dynamic and growing, rather than stagnating.
Another reason why the policies of not just the Dutch but also the British and French colonial regimes in South East Asia were being rethought around the turn of the twentieth century was that two important new colonial powers had emerged in the region, America and Japan. After the defeat of Spain by American forces in 1898, President McKinley imposed an American administration on the Philippine islands. A bloody struggle with nationalist forces ensued, and after their defeat William Howard Taft was dispatched in 1900 to form a civilian government. McKinley instructed Taft to promote the ‘happiness, peace and prosperity of the people of the Philippine Islands’.Footnote 7 This reflected the strongly moralistic view that the administration took of its colonial mission, which both McKinley and Taft realized was deeply unpopular with large sections of American public opinion. Unlike the Europeans, who (according to many Americans) viewed their colonies as economic assets to be exploited mainly for the benefit of the metropolitan power, American policy in the Philippines was dominated by a determination to prepare the population of the Philippines for self-government, and ultimate independence. Crucial to this strategy was mass education.
Japan's empire in East Asia was created between 1895 and 1910, largely as a result of military victories over two decaying imperial states, China, and Tsarist Russia. The island of Taiwan (or Formosa as it was known during the Japanese period) was annexed from China under the Treaty of Shimonoseki, and an administration was established under a Japanese Governor General in 1896. The military pacification of the island in the latter part of the 1890s was not unlike similar exercises carried out by the French in Tonkin, the Americans in the Philippines, or the Dutch in northern Sumatra at about the same time, and was probably no more ruthless than these other military campaigns.Footnote 8 By 1900 the island was largely under Japanese control. Increasingly over the decades from 1910 to 1940, Taiwan was viewed by the Japanese mainly as a source of food, especially rice and sugar. By the 1920s Taiwan was providing urban markets in Japan with a significant share of their rice requirements. But in addition the Japanese had broader developmental objectives including the introduction of modern health care and education.
Another important aspect of colonial policy in Asia from the early twentieth century onwards, was that increasingly colonial officials travelled to neighbouring territories, with the express purpose of learning about particular policies.Footnote 9 Dutch initiatives, such as the peoples’ credit system, attracted the attention and admiration of both British and French officials.Footnote 10 In addition, after 1919, international organizations provided opportunities for comparing progress across different parts of the world. The League of Nations and the International Labour Office served as important channels for information exchange, and in 1925 the Institute of Pacific Relations was founded as an independent research organization to which all the principal colonial powers eventually belonged, as did China, Canada, Australia and New Zealand. Delegations from Korea and the Philippines also attended the early conferences; indeed the Philippines participated in almost all the international conferences which the Institute of Pacific Relations held until the 1950s, although it did not attain self-government until 1935, and independence was granted only in 1946.Footnote 11
From the outset, the Institute of Pacific Relations paid particular attention to economic questions such as population and food supply, industrialization policies and trends in living standards.Footnote 12 In the 1933 meeting in Banff, Canada, the difficulties inherent in making cross-country comparisons of living standards received detailed attention. A representative of the International Labour Office argued that:
In the vocabulary of many specialists, the term ‘standard of living’ implies principally the totality of goods and services consumed and utilized by a family or a category of people during a stated period and in a specified place. Large quantities and superior qualities of these goods and services indicate a high standard. Comparisons have proved feasible and even easy within the same region. The difficulties multiply when different regions or unlike countries become the object of investigation.Footnote 13
However the International Labour Office delegate went on to suggest that:
For everyday purposes, useful approximations may be arrived at chiefly by the judicious and critical use of two methods. The first consists in measuring the purchasing power of income in a certain aggregate of commodities and services. Between regions and countries with somewhat similar tastes, habits, and social conditions, real incomes usually indicate the prevailing standard of living with sufficient accuracy to be of practical service to statesmen and social scientists.
The second method consists in a minute comparison, item by item, of the elements entering into the daily consumption of the groups under investigation. The material may be found in the various national budget inquiries which supply the necessary figures for cost-of-living indices and give us the most reliable picture we possess at present of the actual needs and manner of living among working-class populations.Footnote 14
Both the Institute of Pacific Relations and the International Labour Office carried out a number of studies of living standards and labour conditions in various parts of East and South East Asia in the 1920s and 1930s, often in conjunction with the various colonial authorities.Footnote 15 The results of some of these studies will be discussed further below. The Institute of Pacific Relations also sponsored the first estimates of national income in Indonesia.Footnote 16 In addition, colonial statisticians carried out budget surveys in several South East Asian colonies in the inter-war years. These were sometimes very detailed, and have been mined by subsequent scholars studying consumption patterns in various parts of South East Asia in the inter-war years, although as yet few attempts to compare results across countries have been made. In what follows, I use available data from these, and other sources, to make comparisons across South East Asia and to draw conclusions regarding the impact of colonial policies on the living standards of subject populations.
Indicators of welfare: availability of food and clothing
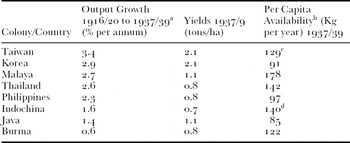
The most basic need in any human society is food, and a widely used indicator of living standards in Asia was per capita rice consumption. By the early twentieth century, colonial governments in most parts of South East Asia were collecting data on food production and consumption, and for the main food crops, especially rice, it is possible to compare yields per hectare, output growth and per capita availability (Table 1). Everywhere in South East Asia, yields were lower than in either Taiwan or Korea. These two colonies also experienced more rapid growth rates of rice output than anywhere in South East Asia. This was in large part due to the successful transfer of Japanese yield-raising rice technologies to its two colonies, which by the 1920s had become important suppliers of rice to the metropolitan Japanese market.Footnote 17 But the growth in exports from both Taiwan and Korea meant that less was available for consumption within the colonies, and, by the latter part of the 1930s, per capita domestic availability was lower in both Japanese colonies than in Indochina, Taiwan and British Malaya. Per capita rice availability in Korea was lower than in any part of South East Asia except Java (Table 1). Many Koreans consumed more millet, and other coarse grains, than rice.
Growth of rice production, 1916–1920 to 1937–1939 yields and per capita availability: East and South East Asia, 1930 s

a Output growth for British Malaya: 1917/19 to 1937/39; Korea: 1917/18 to 1937/38; Indochina: 1916/18 to 1936/38.
b Milled rice.
c Average for 1938/9 and 1939/40.
d Average for 1934–38.
Sources: See Footnote. Footnote 18
What explains the considerable variation in the per capita consumption of the main food staple across South East Asia by the 1930s? In British Malaya, in spite of attempts by the British authorities to increase rice output, around two thirds of total rice availability was supplied by imports.Footnote 19 The Philippines and Indonesia were also net rice importers while Thailand, Indochina and Burma were all important exporters. Thus whether a country or region was an importer or exporter does not appear to have been the main determinant of per capita domestic availability. Rather it was the preferences and purchasing power of the populations. In the case of both Java and the Philippines, rice was supplemented by other food staples including corn, vegetables, beans and rootcrops; this was also true in other parts of South East Asia to varying extents. Mears et al., estimated per capita availability of rice and corn in the Philippines from 1910 to 1940, and found that it reached a maximum in the mid-1920s and fell thereafter.Footnote 20 A moving average of both rice and rice-plus-corn consumption per capita tended to move together which suggests that corn was not just a substitute for rice. Consumption of both staples was determined by changes in purchasing power, which fell for many people in the Philippines over the 1930s.
In Java, where population densities were higher than in most other parts of South East Asia, rice availability per capita was, by the inter-war years, very low. It was almost certainly low in many regions outside Java as well, with the exception of the less densely settled rice-producing regions such as Aceh, West Sumatra and South Sulawesi. Pierre van der Eng has estimated that, for Indonesia as a whole, by the 1930s only around 40 per cent of total calorie consumption came from rice.Footnote 21 Given the paucity of data outside Java, these figures must be treated with caution but it is probable that in many regions outside Java, as well as in Java, corn, sago, and root crops played an important role in the diets of many people. Cassava was eaten in several forms: many poorer families in Central and East Java consumed it in dried form (gaplek) in the paceklik, or months before the main rice harvest.Footnote 22 Fresh roots were also widely consumed, usually with some form of sauce to make them more palatable.
Cassava, whether consumed fresh or dried, was a cheaper source of calories than rice and indeed cheaper than corn or sweet potatoes.Footnote 23 But in spite of cheap supplements to rice, average calorie consumption per capita in Java by the 1930s was, for most population groups investigated by Dutch officialdom, well below 2000 per day. Protein consumption was under 50 grams per day.Footnote 24 The sample of farmers living near estates investigated in the final report of the Coolie Budget Commission found that average daily calorie consumption was only 1391, and protein consumption per capita around 35 grams. Plantation factory labourers living off the plantation were consuming about the same, though field labourers were consuming less.Footnote 25 This report found that calorie consumption rose with increased household incomes, especially amongst those living off the plantation. This finding appears to hold also for the sample of rural households investigated in the Kutawinangun study in Java in the early 1930s, which found a strong positive correlation between income per capita and calorie consumption. Nonetheless, the medical experts who participated in the Kutawinangun study found the state of health and nourishment of the entire village to be ‘most satisfactory’.Footnote 26
One possible explanation for the reasonable state of health in such a densely settled area was that those households who owned little land cultivated their house gardens very intensively. The Kutowinangun study, and other studies carried out in Java in the inter-war years, found that as average holding size decreased, the amount of land allocated to house gardens, and the intensity of planting, increased.Footnote 27 The tendency for those households where land availability per capita was low to exploit their gardens more intensively was to persist into the post-independence era.Footnote 28 The Kutowinangun study found a significant negative correlation between land owned per capita, and the percentage of household income derived from ‘sideline’ occupations, which suggests that land-poor households were able to get at least some income from off-farm activities, and this income helped them to maintain an adequate diet. On the other hand, the data from the Kutowinangun survey showed that there was a significant positive correlation between household income and calorie and protein consumption, for both agricultural and non-agricultural households.Footnote 29 What the household earned determined what the household ate.
Elsewhere in Java, there was evidence of more severe malnutrition in the latter part of the 1930s, especially in regions where cassava was a staple food, and where opportunities for earning extra cash income were limited. In 1939, the Director of Public Health instructed the National Nutrition Institute (Instituut voor Volksvoeding) to carry out a dietary survey in the Bojonegoro region in northeastern Java where the food situation was causing grave concern.Footnote 30 In five villages selected for detailed fieldwork, it was found that most families were receiving well below the stipulated minimum of 1,500 calories per day. Poor diet made the population more prone to malaria, which in turn made hunger oedema more widespread. The governor of the province of East Java, Charles van der Plas, argued that effective programmes to combat hunger oedema across East Java would cost millions of guilders, and the money might be better spent on other policies including improved irrigation and agricultural extension in poor areas, and better education about child nutrition. Other senior officials, such as H. J. van Mook, argued that the situation in Bojonegoro was extreme, although it was widely acknowledged that the growing dependence on cassava as a source of calories was causing dietary problems in other parts of Java, and that, given the expected growth in population, out-migration and the provision of more non-agricultural employment would have to play a greater role in improving living standards on Java.Footnote 31
It was not just in the densely settled parts of Java that, by the early twentieth century, many households were reliant on non-rice foods for a significant part of their food supply. It has been argued that in many parts of the Outer Islands of Indonesia, it was colonial policy which encouraged rice cultivation and consumption in regions where more diversified food consumption patterns had previously been the norm. In parts of Sulawesi, root crops were widely consumed by the common people in the late nineteenth century, and rice was mainly consumed by the elite.Footnote 32 In the Philippines, according to Miller:
During the regular annual periods of food scarcity which occur in certain backward communities, it is customary to make the chief food go farther by adding less appreciated foods. Thus in rice eating regions, ground corn is added to the morisqueta [boiled rice], and more root crops are consumed. In corn-consuming regions the people resort to cultivated roots and even to wild roots and starches from wild palms. In the most backward communities the coarsest forms of wild food supplement the chief diet. In these localities the period of famine is a time of real want, when the hunger belt must be drawn tight.Footnote 33
Miller did not estimate what proportion of the total population was subject to severe food shortages on an annual basis; he argued that in the most advanced regions such as Laguna and Pangasinan, where production was diverse, or in those regions producing export crops such as coconut, where there were buoyant world markets, annual food shortages were largely absent, and the effects of periodic droughts less severe. But in some parts of the country there were persistent shortages. Lava found that the Ilocano families he investigated were consuming fewer calories per day than prisoners; indeed most families of five were consuming fewer than 6,000 calories.Footnote 34 The investigation into living standards of sugar workers in the Philippines conducted by Runes did not include estimates of calorie consumption, although Runes suggested that they might be consuming less than the Ilocano families surveyed by Lava, as they were often not able to cultivate their own land. His estimates suggested that sugar workers were spending around 80 per cent of their earnings on food, much of it inferior in quality.Footnote 35
In French Indochina, reliance on rice as the staple foodstuff varied considerably across different regions. Gourou found that, whilst rice monoculture often prevailed in Cochinchina, in the centre and north of Vietnam more diversified cultivation systems were found, and millet, sweet potatoes, yams, beans and manioc were grown as winter crops for household consumption.Footnote 36 In addition, maize was cultivated both for local consumption and for export. Given the deficiencies in the statistics on hectarage and yields, it was not possible to estimate precise production and consumption data, even for the Tonkin delta, let alone the more remote areas. Gourou estimated that the average Tonkinese adult consumed 400 grams of rice per day, and at least 60 grams of root crops. Small amounts of fish were consumed but virtually no meat.Footnote 37 These figures suggest a calorie intake of well below 2000 per day, although other foods were probably consumed as well, especially at feasts and ceremonies. Gourou did not think that food consumption in Cochinchina would have been much higher, in spite of the fact that the average household cultivated more land. He argued that living standards in general did not differ greatly between north and south; as in Java the population in the densely settled regions of Tonkin cultivated their land more intensively, and derived more income from artisanal pursuits. To a considerable extent this compensated for the very small amounts of land cultivated by most families.
Thailand was usually considered a land-abundant country and food availability was relatively high in the pre-1940 era, although the available data indicate that planted area per person was no higher than in Burma, British Malaya, Cochinchina and the Philippines.Footnote 38 Detailed information on the diets of over 9,000 people in rural Thailand between 1930 and 1931 was reported by Zimmerman; this study found very few cases of severe malnutrition, or diseases such as rickets, scurvey or beri-beri.Footnote 39 On average, 693 grams of glutinous rice were consumed per adult per day in those areas in the north and northeast of the country where this was the staple, and 553 grams of non-glutinous rice in central and southern regions. Glutinous rice was usually produced by hand-pounding which left more pericarp on the grain, thereby improving the nutritive content. Zimmerman argued that this compensated for the lower amount of fish and meat consumed in the northern part of the country.
If these figures are representative, it would appear that rice availability per capita was considerably higher in Thailand than in most parts of French Indochina, the Philippines or Indonesia, which indeed is what the data on per capita availability indicate. Thus there was less need to gain extra calories from root crops. But Zimmerman pointed to some worrying trends in the diet of many Thais. Hand pounding was in decline, and preferences were shifting towards milled rice, and imported dried fish, rather than fresh, locally produced foods. He argued that ‘milled rice without more fish and animal food is probably not a complete diet’.Footnote 40 This study pointed out that, to the extent that malnutrition existed in Thailand, it was the result of lack of knowledge and understanding, rather than lack of food. The problem of the switch from hand-pounded or parboiled rice to polished rice also worried officials in British Malaya, who were concerned with the prevalence of beri-beri amongst the immigrant Chinese in particular. It was only in the 1920s that scientists grasped the association between this disease and vitamin B intakes; beri-beri was largely unknown among Malays, who ate hand-pounded rice, and Tamils, who consumed parboiled rice. The possibility that Malays would be tempted into consumption of less nutritious foods was yet another reason why the British wanted to keep them in traditional rural occupations.Footnote 41
In addition to the rural surveys, there are also several surveys from urban areas. In Rangoon an enquiry into the standard and cost of living of urban workers was carried out in 1926–1927.Footnote 42 This survey found that on average Tamil and Telugu workers in occupations such as carriers, stevedores, cargo boatmen, rickshaw pullers and coolies working for the city government were consuming 259 kg of rice per annum, which was almost twice the per capita rice availability for the country as a whole.Footnote 43 A decade later, the municipal government of Batavia in Java requested the Central Bureau of Statistics to carry out a survey of living standards among the coolie labourers of the city. This investigation showed that per capita rice consumption (153 kg per person) was much higher than the availability figures for Java as a whole.Footnote 44
The results of these two surveys might suggest that urban workers had a much higher standard of living than rural workers, but, as will be discussed below, other indicators do not support this. In particular both the Batavia and Rangoon surveys found that rental costs took a considerable share of total budgets, both for households and for single men. For example, the Burmese families surveyed in the Rangoon study were spending around 14 per cent of total expenditures on rent; single labourers were spending 7.5 per cent.Footnote 45 Coolies surveyed in the Batavia study were spending between 14 and 20 per cent of total expenditures on housing. As will be discussed below, contemporary observers stressed the poor housing conditions of many unskilled urban workers, which caused many health problems associated with acute overcrowding.Footnote 46 Rural families usually owned their own housing, and lived in less crowded conditions, although this was not the case for workers on estates.
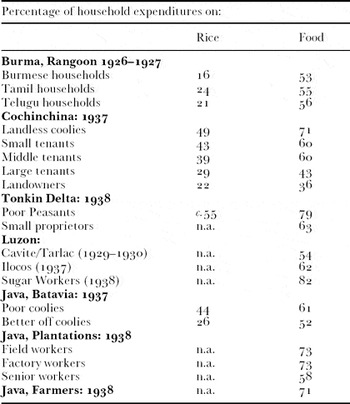
Budget studies, carried out in various parts of South East Asia in the 1920s and 1930s, found that many households, including those of unskilled urban workers in Rangoon, small and middle tenants in Cochinchina, small proprietors in Tonkin, farmers in Ilocos, poor coolies in Batavia, and field and factory workers on estates in Java, were all committing more than 50 per cent of total household expenditures to food (Table 2). Poorer groups such as the sugar workers surveyed by Runes, farmers surveyed in Java, poor peasants in Tonkin, and landless coolies in Cochinchina were spending over 70 per cent on food. Other studies did report lower food expenditure ratios; for example the 15 farm households surveyed in Kutowinangun in 1932 only committed about one-third of total expenditures to food, although among the sample studied in the following year the proportion was 59 per cent.Footnote 47 On balance the evidence suggests that many households across South East Asia had little left to spend on non-food items in the 1930s.Footnote 48
Budget studies in Burma, Vietnam, the Philippines and Java, 1920s and 1930s

Sources: See Footnote.Footnote 49
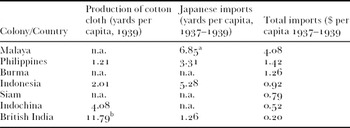
Apart from food, the most essential basic need in a tropical climate was cotton cloth. Although domestic production of cotton cloth was growing in several parts of South East Asia by the latter part of the 1930s, only in French Indochina did domestic production fill most of the domestic market needs.Footnote 50 Elsewhere, with the partial exception of Indonesia, reliance on imports was high (Table 3). Imports from Japan amounted to over five yards per capita in Indonesia in the latter part of the 1930s, and almost seven yards in British Malaya, although part of the imports into Malaya probably went to other parts of the region, including Thailand and Sumatra. Total imports (in per capita dollar terms) were much higher in British Malaya than in any other part of colonial Asia, and even allowing for the fact that some of these imports would have ended up elsewhere, it would appear that the inhabitants of British Malaya were spending more on cotton cloth than their neighbours. The evidence on per capita expenditures on cloth, together with the high per capita rice availability, would suggest that consumption standards were higher in British Malaya by the late 1930s than in other colonial territories in South East Asia, or in independent Thailand. But consumption of basic needs is only one part, albeit an important one, of a broader indicator of living standards. For a more complete picture, we need to turn to the demographic and anthropometric evidence.
Production and imports of cotton cloth: circa 1939

a Imports are to the Straits Settlements only; it is assumed that they were transported to other parts of British Malaya.
b 1943 figures.
Source: See footnote.Footnote 51
Demographic and anthropometric measures
By the early twentieth century, most colonial regimes in Asia were collecting information on demographic indicators, either through improved procedures for registration of births and deaths, or through population surveys and censuses. This information could in turn be used for estimating crude birth and death rates, and other demographic indicators such as infant mortality rates and life expectancies. Most of these estimates were hedged with caveats about the reliability of both the data and the estimation techniques. But they do allow comparisons to be made of demographic indicators, across countries, across regions within countries, and between ethnic groups and over time, which in turn can be used to examine trends in living standards.
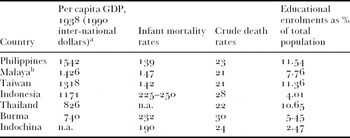
Infant mortality rates are perhaps the most useful indicator, as estimates were quite widely available by the late 1930s, and show to what extent populations, and especially nursing women, in a particular country or region had access to modern health care, were eating a good diet and were possessed of sufficient knowledge to give their babies the right food, and protect them from the main water-borne and insect-borne killers, such as diarrhoea, cholera, and malaria.Footnote 52 By the latter part of the 1930s, the lowest infant mortality rates were reported in the Philippines, the Federated Malay States, the Straits Settlements and South Vietnam. Rather higher rates (of over 200 per thousand) were estimated in Burma and Java (Table 4). To place these figures in a broader international perspective, infant mortality rates in Romania in the late 1930s were estimated to be 179 per 1,000 live births, 138 in Poland, 65 in France, 54 in England, 50 in America and 36 in The Netherlands.Footnote 53 There was a large gap in all the colonial territories between their estimates and those in the metropolitan powers; the gap was particularly pronounced between Java and The Netherlands.
Development indicators: East and South East Asia, late 1930s

a For the Philippines, Malaya, Taiwan and Indonesia, GDP data are three-year averages centred around 1938. For Thailand and Burma the data refer to 1938 only.
b GDP and crude death rate data refer to the territory covered by modern Malaysia (British Malaya plus Sabah and Sarawak, less Singapore). Infant mortality rates refer to the Federated Malay States only. Educational enrolments refer to British Malaya including Singapore.
Sources: See Footnote.Footnote 54
In all the South East Asian colonial territories where data on crude death rates and infant mortality rates are available over a period of years, there seem to have been declines in the first part of the twentieth century. The crude death rates estimated by Vlieland from the population censuses of 1911, 1921 and 1931 showed quite sharp declines in both crude death rates and infant mortality rates in the Singapore municipality and the Straits Settlements.Footnote 55 Gooszen argued that ‘it is likely that the average level of mortality declined in the late nineteenth century in the north coast of Java’, most probably because of improvements in the supply of drinking water, and increased government efforts to combat malaria.Footnote 56 Vaccination against another killer, smallpox, had in fact begun in Java in the early part of the nineteenth century and by the 1870s smallpox had largely been eradicated, although it was still rife in parts of the Outer Islands.Footnote 57 In spite of the increased attention given to public health measures after 1900 in Java, there does not seem to be any further evidence of declining mortality rates until the 1920s. Java, like many other parts of Asia, was badly affected by the influenza pandemic which struck at the end of the second decade of the twentieth century, and which caused sharp increases in mortality rates, especially in Central and East Java.Footnote 58
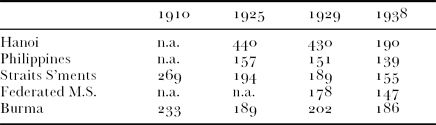
After 1920, infant mortality rates appear to have declined in Hanoi, the Philippines, the Straits Settlements, the Federated Malay States and Burma (Table 5). To the extent that these estimates are derived from population censuses, they give a reasonably accurate picture of trends within the total populations of these colonies.Footnote 59 In all cases, colonial authorities would have attributed the decline to increased expenditures on health personnel, and on programmes designed to address specific health problems of nursing mothers and infants in both urban and rural areas. That such programmes did feature more prominently in colonial government priorities is clear, although the amount devoted to health expenditures in the various colonies and in Siam (Thailand) varied considerably, both over time and across countries. The comparative study carried out by Schwulst showed that in the early 1930s, the Federated Malay States were spending the highest proportion (15 per cent) of the budget on health followed by the Philippines (8 per cent).Footnote 60 Other colonies and independent Siam seem to have given health expenditure a lower priority at that time.
Infant mortality rates in South East Asia: 1910–1938
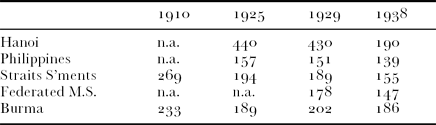
Notes: Figures for Burma refer to 1910, 1925, 1930 and 1935; for the Philippines, 1926–1930, 1931–1935 and 1936–1940; for the Straits Settlements 1910, 1925, 1929 and 1937.
Sources: See Footnote.Footnote 61
A further point to emerge from the evidence on infant mortality rates was that there were considerable variations between urban and rural areas, with urban areas often registering much higher rates than rural areas. Perhaps this was not surprising, bearing in mind the evidence from nineteenth-century Europe that urban mortality rates were often very high, to the point where cities only grew because of high rates of in-migration.Footnote 62 In British Malaya, the 1931 census data indicated that infant mortality rates were considerably higher in the Singapore municipality than in the more rural Federated Malay States.Footnote 63 In Java, one medical officer found extremely high infant mortality rates, ranging between 400 and 500 per 1,000, in overcrowded kampong areas of Batavia (now Jakarta) between 1917 and 1919. Although these rates horrified the Dutch investigators, they were little different from the rates prevailing in Hanoi in the mid-1920s.Footnote 64 Infant and child mortality rates were much lower in the city of Bandung, which was situated in the healthier mountain region of West Java, and in some rural areas, including the regency of Purwokerto in Central Java, where infant deaths per 1,000 live births in 1935 and 1936 were estimated to be below 100.Footnote 65 Apart from the healthier climate, Brand argued that the higher educational levels of the Sundanese, who were the majority ethnic group in the western areas of Java, made them more receptive to modern medical ideas than the indigenous populations in other parts of Java.
As well as the rural-urban and regional differences in mortality in many parts of South East Asia, there were also often glaring differences in mortality rates between ethnic groups. The study of infant and child mortality rates in Batavia (Jakarta) carried out by de Haas between 1935–1937 found that infant mortality rates were around 30 per 100 for native children, 15 per 100 for Chinese and only 5 to 6 per 100 for European infants. Similar inter-ethnic differences prevailed in mortality rates for pre-school children. The rate for Europeans in Batavia was only slightly higher than in The Netherlands between 1929 and 1932.Footnote 66 Although subsequent scholars, including Nitisastro, consider the de Haas estimates of infant mortality to be too high, they did gain considerable currency and have been cited in other studies.Footnote 67 Other research, including that carried out by Brand in Bandung, confirmed the large differences between ethnic groups (Table 6). Recent scholars have attributed the relatively high mortality rates amongst the indigenous populations in Java to the slow progress made in the shift from curative to preventative medicine in the inter-war years. Certainly the budget cuts in the early 1930s impeded the development of public health programmes aimed at increasing awareness of modern medical advances amongst the indigenous population.Footnote 68
Infant mortality rates in South East Asia by ethnic group: 1930s

Sources: See Footnote. Footnote 69
There were also marked differences in infant mortality rates amongst the various ethnic groups in the Straits Settlements. Manderson quotes official data from 1934 that put the infant mortality rate amongst the Malay population at 235 per 1,000, compared with 154 in the Chinese population and only 25 per 1,000 in the European population (Table 6). In the Federated Malay States, the gap between Malay and Chinese infant mortality was less marked than in the Straits Settlements. In the northern Malay state of Kedah, infant mortality rates amongst both the Chinese and Indian populations were higher than those of the Malays; as many of the Chinese and Indians worked as estate labourers, this probably reflected the poor standards of health care available on at least some plantations.Footnote 70 By the 1930s, the government of British Malaya had established infant welfare centres in most of the Malay states, as well as in the Straits Settlements where it was estimated in 1937 that 300,000 mothers and babies had been in contact with clinic staff.Footnote 71 They received guidance on feeding and on protecting babies and young children against malaria, cholera, respiratory tract infections and other common killers.
Many colonial health officials attributed high infant and child mortality rates to poor feeding habits and parental ignorance. It was argued, for example, that the frequent respiratory illnesses were due to poor feeding practices. Doctors also deplored the tendency to feed babies with rice as soon as they were weaned, as well as the fact that they were often carried around on the backs of mothers or elder siblings all day, and that parents usually ignored minor illnesses, and bathed young babies in cold water, and placed them in draughts.Footnote 72 At the same time, some health officials stressed that, in many parts of Europe until the latter part of the nineteenth century, infant and child mortality rates were as high as those found in many parts of South East Asia in the third and fourth decades of the twentieth century. Brand argued that the mortality situation amongst the native population of Bandung ‘is only a few decades behind the situation in The Netherlands itself’.Footnote 73 This optimism was based on an awareness that high infant and child mortality rates were not always the result of economic conditions, but rather of ignorance, which could and should be remedied by better advice and education. It was regrettable that budgetary cuts during the 1930s slowed down the development of innovative health outreach projects in several parts of colonial Asia.
Further evidence on living standards in Java in the early twentieth century compared with Europe in the nineteenth century can be gleaned from a survey carried out in Jakarta in the latter part of the 1930s looking at the health status of school children. The curve of heights related to age for boys was broadly similar to that found in Brussels in 1835 and higher than in Lancashire in 1837. It was also higher than that derived from a survey of factory workers in The Netherlands in 1863–1867.Footnote 74 At most ages between 6 and 18 years, the girls surveyed in Jakarta were slightly taller than girls in either Brussels or Lancashire. This might suggest that nutritional standards for school children in Jakarta in the 1930s were at least as good as, and perhaps better than, those prevailing in the more industrial parts of nineteenth-century Europe. But it is probable that children attending school in Jakarta were drawn disproportionately from the more affluent classes of society, and that a sample drawn from lower income groups, in both urban and rural areas, would have produced rather different results
A much larger survey of heights and weights of children from birth to 21 years was carried out in the Philippines by Concepcion. She studied data from over 30,000 Filipino children, and compared her findings with studies from China and Japan. Whilst she found some improvement compared with earlier studies carried out by American doctors, she argued that ‘compared with Chinese children, the Filipino children compare favourably in weight and stature in certain ages only’.Footnote 75 Compared with Japanese children, Filipino girls seemed to be doing less well than boys. Her findings led to the conclusion that ‘Filipino children seem to possess all the potentialities found in other races especially during the first two years after birth but somehow they cannot keep up and they are left behind’. She suggested that poor nutrition and the widespread prevalence of intestinal parasites were perhaps the main reason for this.Footnote 76
Wage data
In recent years a number of scholars have constructed long-term series on wages for various parts of the world, and used these to draw a range of conclusions about trends in economic conditions, both over time and across countries and continents. This ‘real wage revivalism’, to use Maddison's not entirely complimentary term, is due mainly to the increasing scholarly awareness of data on both wages and prices for many parts of Europe, the Mediterranean lands, and also parts of Asia, not just for the twentieth century but for earlier periods as well.Footnote 77 In the Asian context, Williamson has used a large data set to answer a broad set of questions regarding the emergence of disparities in income and living standards in the years from 1870 to 1940.Footnote 78
Though the work of Williamson and others is certainly producing interesting and provocative results, there are a number of problems inherent in using wage data to infer trends in incomes and living standards. In South East Asia, as in many other parts of the developing world, it is often difficult to compile consistent wage series over long periods, even for a particular type of labour such as unskilled coolies in a specific location. Daily wage data may not reflect changes in hours of work or in non-monetary compensation such as meals. In addition, many labour markets in Asia were segmented by region and ethnicity. Trends in wages in Manila were different from those in rural areas, whilst wage levels in Singapore or Bangkok probably reflected conditions in southern China more those in rural Thailand or rural Malaya. Another problem is that many labour markets in South East Asia, especially during the depression of the 1930s, seem to have experienced some degree of ‘nominal wage rigidity’, in the sense that money wages did not fall as fast as the cost of living. This caused some increase in real wage rates, even when numbers employed were contracting.Footnote 79
A further difficulty inherent in using wage data to infer trends in living standards is that, in most pre-industrial economies, wages were only a part of total household income, and most agricultural workers were not earning the bulk of their incomes from wage labour. Even as late as the 1960s, when more complete census data on occupations were available, only a minority of agricultural workers in the Philippines, Thailand and Indonesia were classified as ‘employees’ (i.e. getting most of their income from wage work) (Table 7). The rest were either classified as ‘self-employed’ or, in the case of many women, ‘family workers’, which meant that they were engaged in a range of income-generating activities in the household for which they were recompensed in kind rather than in cash. It would indeed be quite possible for household incomes to be increasing even if wage rates were static or declining, if the total work effort on the part of household members was increasing. More research needs to be done on changing work patterns within households in most parts of Asia before firm statements can be made on the relationship between changes in real wages and changes in household incomes.
Employees as a percentage of all employed workers

a Also includes currently unemployed workers who have worked in the past.
Sources: See Footnote.Footnote 80
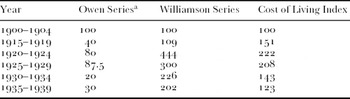
For all these reasons, some of the strong statements which have been made by scholars such as Williamson about the relationship between wage levels and living standards in Asia must be rejected. Williamson has argued that living standards in the Philippines doubled during the American colonial era because a series on real wages showed that real wages more than doubled between 1895–1899 and 1935–1939.Footnote 81 The data which Williamson drew on refer to wages in Manila, which appear to have moved in a very different direction to those in other parts of the country (Table 8). One reason for this could have been the introduction of minimum-wage regulations for workers in government employment in the Philippines in the latter part of the 1930s, although these were not universally implemented.Footnote 82 Wages for labourers on public works projects in Manila in the late 1930s were certainly high in comparison with most other parts of Asia; on the other hand, figures from Runes’ survey show that wages for sugar workers in rural areas were much lower than the urban unskilled wage, and indeed lower, in rice terms, than the wage for estate workers in Sumatra.Footnote 83
Indices of wage data in the Philippines: Owen and Williamson Series compared (1900–1904 = 100)

a Series refers to unskilled workers in Camarines Sur; when a spread of wage rates is given, the midpoint is taken.
Sources: See Footnote.Footnote 84
Towards a composite indicator of human development
Over the last three decades of the twentieth century, much work was devoted to estimating composite indicators of development using both monetary and non-monetary indicators. This reflects the fact that many scholars working in the field of international development argue that per capita GDP alone is not always a good indicator of living standards, either for the purposes of international comparisons at a point in time, or for estimating trends over time in a particular country.Footnote 85 The best known composite indicator is the Human Development Index, which is composed of per capita GDP data, life expectancy, literacy and educational enrolment ratios. This index is published annually by the United Nations Development Programme, and has been extended back to the 1970s, although its critics consider it to be rather limited in scope, and several scholars have suggested extensions.Footnote 86 Attempts have also been made to extend the Human Development Index much further back in time, most notably by Crafts, although the only Asian country for which he made estimates prior to 1950 was Japan.Footnote 87 Metzer produced Human Development Index estimates for 36 countries in the late 1930s. These placed the Philippines at 22, above the Latin American countries with the exception of Chile.Footnote 88 Thailand was ranked at 26, and India in bottom place at 36. No other Asian country was included in Metzer's sample.
There are serious data difficulties in estimating a Human Development Index for many parts of Asia prior to 1950, not least because concepts such as ‘literacy’ were far from straightforward in the colonial context. The Dutch, in the first archipelago-wide census carried out in 1920, deemed people to be literate if they could read in the Latin script, although many Indonesians, and Malays living in British Malaya, had by then been taught in religious schools to read and write Malay in the Arabic script. A better indicator of educational progress would probably be enrolments as a proportion of population, taking into account religious as well as secular schools. There seems to be little doubt that the Philippines was well ahead by the latter part of the 1930s; indeed educational enrolments were probably higher in the Philippines in the early years of the twentieth century than in Indonesia or French Indochina in the late 1930s (see Tables 4 and 9).
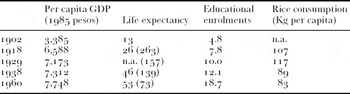
Per capita GDP and welfare indicators: Philippines, 1902–1960

Notes: Life expectancy at birth; averages for male and female. Figures in brackets refer to infant mortality rates. From 1929 onwards these are five-year averages for 1926–1930, 1936–1940, and 1958–1962. Educational enrolments refer to enrolments in public and private schools and colleges as a percentage of total population.
Sources: See Footnote.Footnote 90
In the Philippines, per capita GDP, life expectancy and school enrolments all more than doubled between 1902 and 1938 (Table 9). This might seem to confirm the Williamson argument, made on the basis of the wage data alone, that living standards doubled during the American colonial era, although most of the improvement occurred before 1930. But two caveats should be noted. First, the indicators in 1902, both economic and demographic, would have been influenced by the conflicts which occurred over the previous six years, when Filipino militias fought against both Spanish and American forces, with considerable loss of life and destruction of infrastructure. Apart from the actual fighting, there appears to have been a sharp jump in mortality rates in the early 1900s due to disease. Indeed, it seems likely that a health crisis in the Philippines had been in progress for at least the last two decades of the nineteenth century, although the cholera and smallpox epidemics of the early 1900s were probably related, in part at least, to the fighting with both the Spanish and American troops.Footnote 89 Whilst the American occupation did bring with it improved disease control, it is possible that mortality rates would have fallen after 1902 had political independence been achieved in the early 1900s.
A second caveat concerns distributional issues. A frequent criticism of GDP data is that it is simply a measure of the value of all goods and services produced in an economy over a period of time. Whilst GDP data broken down by expenditure can indicate what happens to aggregate consumption over time, it cannot show changes in the distribution of consumption expenditures between regions or social classes.Footnote 91 This criticism also applies to the Human Development Index, and similar indicators, in that they are based on averages, and do not take into account distributions around the averages. In the Philippines, as elsewhere in Asia, these averages masked considerable variation by region, ethnicity and social class in both incomes and other indicators including educational attainment, and infant mortality. This paper has drawn attention to the very different trends in wages between urban and rural regions in the Philippines after 1900. The fall in per capita availability of rice and corn between 1929 and 1938, in spite of the fact that per capita GDP rose slightly, also indicates a worsening of income distribution over the 1930s (see Table 7).
Distributional considerations are also important in evaluating progress in the various components of British Malaya between 1900 and 1940. Although all the available evidence points to falls in mortality rates after 1900, and to some increase in educational enrolments, as well as to considerable growth in real per capita GDP, most of the population, both indigenous and immigrant, shared to only a limited extent in the economic growth which took place. Many were unable to attend school or access modern health facilities. As in the Philippines, the first comprehensive household survey carried out in Malaya in 1957 showed very considerable income disparities both within and between ethnic groups. It is likely that these disparities already existed in the late 1930s, and were indeed the result of the economic development policies of the British after 1870.Footnote 92
Conclusions
To return to the first of the four questions raised at the beginning of the paper, the available evidence across South East Asia in the late 1930s does allow comparison of the relative position of the various colonial territories, and of Thailand. The data on per capita income, infant mortality, crude death rates and educational enrolments together point to the Philippines as having the highest living standards of any colonial territory in South East Asia. Given that per capita GDP was higher than in Thailand, a Human Development Index-type indicator would have placed the Philippines above Thailand as well, although Thailand did relatively well on school enrolments, and mortality rates were, in the late 1930s, probably about the same as those of the Philippines and British Malaya. These figures were statistical averages, and there were certainly considerable fluctuations around the average by region and by ethnic group, both in the Philippines and elsewhere. But taken together, the evidence on incomes, mortality and educational enrolments do indicate that living standards were higher in the Philippines than in other parts of South East Asia by the latter part of the 1930s.
But once rice availability per capita is taken into account, as well as other indicators of calorie intake in the Philippines, the picture looks rather less impressive compared with Thailand and Malaya. The low average rice consumption per capita, together with the evidence that per capita calorie consumption was apparently very low for some segments of the rural population, indicate that disparities in consumption standards across regions and social classes were considerable. Only Java had lower per capita rice availability than the Philippines in the latter part of the 1930s. Given that educational enrolments were lower than in the other colonies (except French Indochina), and infant mortality rates high, it seems reasonable to rank Java close to the bottom in terms of living standards. In Burma, per capita GDP was lower than elsewhere in South East Asia, infant mortality rates were high, and educational enrolments low. Per capita rice consumption was higher than in Java or the Philippines but insufficient to afford many Burmese an adequate diet. By the late 1930s, Java and Burma, together with northern and central Vietnam were almost certainly the parts of South East Asia with the lowest levels of human development.
To what extent did living standards improve between 1900 and 1940? In the Philippines, per capita GDP, life expectancy, educational enrolments and per capita rice consumption all increased over the first three decades of the twentieth century, albeit from a very low base in 1902. Elsewhere it is more difficult to assemble evidence on changes in non-monetary indicators such as educational enrolments or mortality, although the evidence on infant mortality for most parts of South East Asia, does show some decline from the 1920s onwards. In Burma, British Malaya and Indonesia, per capita GDP also increased between 1900 and 1930; school enrolments also increased in these colonies although the rate of increase was often slow, and held back by the fear of many colonial officials that ‘educated natives’ would not be able to find appropriate employment.Footnote 93
The third question posed at the beginning of the paper related to the usefulness and reliability of the indicators used to measure changing living standards in South East Asia. Given that the Philippines, which according to the Maddison data had the highest per capita GDP in the region by 1938, also performed best in terms of demographic and educational indicators, does that imply that GDP data by themselves are an adequate indictor not just of production but also of living standards? There are at least two reasons in favour of a broader indicator than just GDP estimates alone. First, the GDP data themselves may not be entirely accurate.Footnote 94 Second, even if they are a broadly accurate indicator of the value of total output, they may not be an accurate indicator of relative living standards, especially if the proportion of total output devoted to consumption, or the distribution of consumption expenditures varies between countries. In South East Asia, as in most other parts of the world before 1950, it is difficult to measure the distribution of household income or expenditures with any precision. But the rather low rice consumption figures for the Philippines in the 1930s might indicate that the benefits of the growth in national income were not evenly spread between all social classes.
The fourth question concerned the extent to which the various colonial governments were successful in converting the growth in per capita GDP which occurred after 1900 into improvements in living standards. The main criticism of colonial economic policy in South East Asia in the years from 1900 to 1940 made by many nationalists was not that governments did nothing to improve the welfare of both indigenous and migrant populations, but that, given the resources which they had or could have mobilized, they did far too little. This is most obviously true of the two colonies which had the highest per capita GDP, the Philippines and British Malaya. But even in the Philippines, where the American colonial government was committed to eventual independence, conservative fiscal policies held back government spending on education, public health and infrastructure development. Per capita government expenditures were around six dollars in the 1920s and fell to five dollars by 1939.Footnote 95 Per capita government revenues and expenditures were higher in the three parts of British Malaya, which reflected the fact that the British relied heavily on revenues from government enterprises, and from the opium and alcohol monopolies. There was no corporate or personal income tax in British Malaya until after the Pacific War. A more broadly based and equitable tax system could have been used to finance greater expenditures on infrastructure, health and education but such changes in fiscal policy only came about after 1950.
Elsewhere, colonial administrations had fewer resources and were also constrained by conservative fiscal policies imposed by metropolitan governments. Government expenditures per capita in Vietnam in the decades of the 1920s and 1930s were around two dollars; they were only slightly higher in Burma. Although expenditures were higher in Indonesia in 1920 as a result of the ethical policy, a more conservative approach was adopted in the 1920s and 1930s, and expenditures on economic and social infrastructure were cut back.Footnote 96 Independent Thailand, for the most part, followed the same conservative policies as the colonial territories. Given these low levels of expenditure, and the need to pay for routine administration, it is hardly surprising that expenditures on health and education were low. The legacy left to independent Indonesia, Burma and Vietnam was one of poor nutrition, high mortality, and low levels of educational attainment.