


Haemolytic–uraemic syndrome is a major cause of acute renal failure in childhood. The main clinical manifestations of haemolytic–uraemic syndrome are microangiopathic haemolytic anaemia, thrombocytopaenia, and acute renal failure. The kidneys and the gastrointestinal tract are the most commonly affected organs in haemolytic–uraemic syndrome, but extrarenal complications involving the heart also occur and are a cause of chronic morbidity and mortality.
A 21-month-old infant weighing 13 kg with no underlying conditions was referred to our paediatric ICU because of a convulsive episode in the context of bloody diarrhoea for 10 days and vomiting in the previous 24 hours. At admission, the patient had another seizure, with poor general condition, altered consciousness, and irritability.
On arrival to our paediatric ICU, his vital signs were stable except for tachypnoea, pallor, signs of dehydration, and Glasgow Coma Scale of 12 (Eye 3, Verbal 4, Motor 5). He was afebrile, his heart rate was 125 beats/minute, blood pressure was 103/61 mmHg, respiratory rate was 60 breaths/minute, and his oxygen saturation was 100% (fraction of inspired oxygen 0.5). Chest auscultation showed good bilateral air entry without pathological sounds, and his abdomen was soft and palpable, no masses.
Laboratory studies revealed anaemia with signs of intravascular haemolysis – haemoglobin 9.9 g/dl, haematocrit 28.7%, haptoglobin<10 mg/dl (30–200 mg/dl), schistocytes 4.6%, lactate dehydrogenase 2002 IU/L (110–295), reticulocytes 4.14% (0.8–2.5%) – thrombocytopaenia (45,000 platelets), acute renal failure (blood urea nitrogen 249 mg/dl; creatinine 4.21 mg/dl), and electrolytes within normal limits except for serum sodium 134 mEq/L, potassium 4.5 mEq/L, and metabolic acidosis in capillary blood gases.
Haemolytic–uraemic syndrome was diagnosed on the basis of microangiopathic haemolytic anaemia, thrombocytopaenia, and oliguric renal failure. After initial stabilisation, anuria persisted, and given the severity of his renal failure peritoneal dialysis was performed at admission. Stool cultures were positive for Escherichia coli serogroup O111.
At 48 hours, antibiotic therapy was initiated with cefotaxime and vancomycin after clinical sepsis was diagnosed, and transfusion of packed red blood cells was required.
Progressive worsening of the patient’s respiratory status started at 72 hours, with hypoxaemic acute respiratory failure and increased oxygen requirements. When high-flow nasal cannulae therapy failed to decrease his work of breathing, non-invasive ventilation using bilevel airway pressure was applied, with slight improvement. Lung ultrasound suggested right pleural effusion, and thus a drainage tube was placed. On the 4th day, clinical haemodynamic worsening was detected – hypotension and greater oxygen needs – in the context of worsening acute pulmonary oedema, despite adequate fluid removal being achieved with peritoneal dialysis.
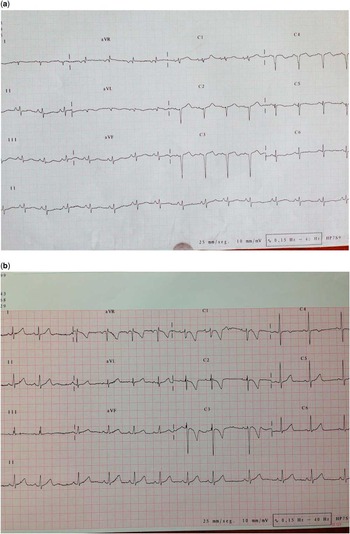
A bedside echocardiography was performed and showed depressed left ventricular function with an ejection fraction of 27% (normal values: 56–78%), global hypokinesis especially at the interventricular septum, moderate mitral regurgitation secondary to mitral annulus dilation, and moderate tricuspid regurgitation with normal pulmonary pressures with left ventricular end-diastolic dimension (38 mm). No pericardial effusion was found. An electrocardiogram demonstrated low-voltage QRS waves and deep septal Q waves (Fig 1a). Chest X-rays showed bilateral interstitial infiltrates and signs suggestive of acute cardiogenic pulmonary oedema.
( a ) Electrocardiogram showing sinus rhythm of 110 beats/minute, low-voltage, complex QRS in all leads, and deep septal Q waves. Re-polarisation abnormalities. Right axis. Flattening of T waves in the left praecordial leads. ( b ) Electrocardiogram showing sinus rhythm of 78 beats/minute, normal voltage, and resolution of the infarct pattern.

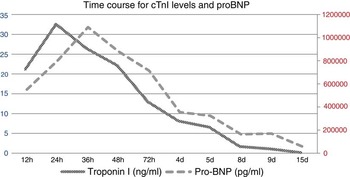
More blood tests were obtained: creatine phosphokinase levels were 810 IU/L with 6.7% creatine phosphokinase-MB (total creatine phosphokinase-MB 54 IU/L). Cardiac troponin I level was 32.49 ng/ml (normal value <0.04 ng/ml), and pro-brain natriuretic peptide level was 1,090,469 pg/ml (normal value <300 pg/ml). Both biomarkers and repeated echocardiograms suggested myocardial ischaemia – septal region infarction.
Cardiovascular support was initiated with dopamine in the early hours, adding milrinone for 5 days. As the patient’s response was limited, levosimendan and clopidogrel were initiated.
Given the typical data of haemolytic–uraemic syndrome, but with significant extrarenal complications, monoclonal antibody (eculizumab) therapy was administered starting 5 days after admission, according to the following protocol for children: 600 mg at first infusion (week 1) then 300 mg at weeks 2, 4, 6, and 8.
Follow-up echocardiography at 15 days revealed return of normal ventricular function and progressive decrease of biomarkers (Fig 2) in relation to haemodynamic and respiratory improvement, which allowed the withdrawal of inotropes while maintaining hydralazine and antiplatelet treatment.
Evolution of cardiac troponin I (cTnI) and pro-brain natriuretic peptide (proBNP) levels from initial involvement until discharge from the paediatric ICU. Time course for cTnI and proBNP levels beginning from 24 h before and extending to 15 days following acute cardiac injury involvement

Peritoneal dialysis was continued for a total of 16 days until renal function with adequate urine output was recovered; three weeks after eculizumab treatment was initiated, renal function recovered (Creatinine <0.77 mg/dl) and remained normal during follow-up.
The patient was discharged home in satisfactory conditions on hospitalisation day 29. A follow-up appointment after 6 months revealed normal left ventricular function with an image of septal aneurism and left ventricular end-diastolic dimension (M-mode) slightly above the normal range.
At the time of this publication, 11 months after admission to our institute, the patient is surviving only with carvedilol treatment, with pro-brain natriuretic peptide and cardiac troponin I levels within the normal range and without infarct pattern on the electrocardiogram (Fig 1b).
Discussion
Given the potential for morbidity and mortality in patients with cardiac involvement associated with haemolytic–uraemic syndrome, early recognition and supportive therapy are indicated. Therefore, in the presence of elevated markers of cardiac injury – pro-brain natriuretic peptide and cardiac troponin I level – bedside echocardiography should be considered to assess myocardial injury in children severely affected by haemolytic–uraemic syndrome.
Clinical manifestations of myocardial injury in haemolytic–uraemic syndrome are diverse. Primary cardiac involvement includes thrombotic microangiopathy of the coronary vasculature, resulting in myocardial ischaemia, myocardial infarction or depressed myocardial function, myocarditis, congestive heart failure with dilated cardiomyopathy and secondary arrhythmias, and pericardial effusion with tamponade.Reference Mohammed, Filler, Price and Sharma 1
Secondary cardiac involvement in haemolytic–uraemic syndrome may be due to different manifestations of the disease itself as well as to its treatment, such as fluid overload in an anuric patient, electrolyte abnormalities, and persistent severe hypertension.
The pro-brain natriuretic peptide levels correlate with different types of adult angina and also with the extent of regional wall motion abnormalities as assessed by echocardiography.Reference Choi, Kwon, Yoon, Kim and Kim 2 The rise in pro-brain natriuretic peptide concentration may be sustained over several weeks after ischaemia and correlates with infarct size, as measured by cardiac enzyme release.Reference Arakawa, Nakamura, Aoki and Hiramori 3 In addition, the number and time course of the “peak” vary depending on different types of myocardial infarction.Reference Antman, Cohen and Bernink 4 Cardiac troponin I and pro-brain natriuretic peptide levels have been described as detectors of acute myocardial injury involvement in severely ill haemolytic–uraemic syndrome patientsReference Askiti, Hendrickson, Fish, Braunlin and Sinaiko 5 and cannot be attributed simply to renal insufficiency.
In our case, there was significant elevation in cardiac troponin I and pro-brain natriuretic peptide levels from the onset of acute myocardial failure with a peak elevation 24 hours later.
In our patient, initial fluid overload without important hypertension or electrolyte disturbances led to suggest the diagnosis of primary ischaemic myocardial injury by microangiopathy.Reference Tobias 6
Although extrarenal manifestations of haemolytic–uraemic syndrome are not frequent, myocardial dysfunction should be given special consideration because of the importance of proper early haemodynamic management and potential complications with high morbidity and mortality.Reference Machol, Vivante, Rubinsthein, Dekel, Danieli and Paret 7 In our case, both bedside echocardiography and repeated monitoring of biomarkers (Fig 2) were useful diagnostic tools that provided relevant information throughout the patient’s evolution. Follow-up electrocardiogram demonstrated resolution of the infarct pattern (Fig 1b). Early treatment with eculizumab may have been beneficial to the recovery of cardiac function or to avoid progression to severe systemic complications due to the clinical control of manifestations of thrombotic microangiopathy with sustained, long-term (>1 year), marked improvements and stabilisation of cardiac function and biomarkers values.
As Dr Poulton concluded in 1987, cardiac involvement is a rare but important complication in extrarenal haemolytic–uraemic syndrome. In patients with haemolytic–uraemic syndrome with any signs, symptoms, or laboratory evidence of cardiac involvement, an echocardiogram should be obtained.Reference Poulton, Taylor and De Giovanni 8
Acknowledgements
Authors would like to thank all residents and PICU nurse and medical staff for their invaluable support. Also thanks to Dr Marisa Justa of our division of pediatric nephrology and Wee Tan for the style corrections.
Financial Support
This research received no specific grant from any funding agency, commercial, or not-for-profit sectors.
Conflicts of Interest
None.
Ethical Standards
The authors assert that all procedures contributing to this work comply with the ethical standards of the relevant national guidelines on human experimentation and with the Helsinki Declaration of 1975, as revised in 2008, and has been approved by the institutional committees (Miguel Servet hospital ethics committee).