


Introduction
Carried aloft by a NASA rocket launched fromVandenberg Air Force Base, southwest California, on 4 November 1995, the Canadian RADARSAT-1 is equipped with a C-band (5.3 GHz) synthetic aperture radar (SAR) capable of acquiring high-resolution (25 m) images of Earth’s surface day or night and under all weather conditions. Along with the attributes familiar to researchers working with SAR data from the European Remote-sensing Satellite (ERS) and the Japanese Earth Resources Satellite, RADARSAT-1 has enhanced flexibility to collect data using a variety of swath widths, incidence angles and resolutions. Most importantly, for scientists interested in Antarctica, RADARSAT-1 can be maneuvered in orbit to rotate the normally right-looking SAR to a left-looking mode. This ’Antarctic mode" provides first-time capability to acquire nearly instantaneous, high-resolution views of the entirety of Antarctica on each of two mappings Reference Jezek and CarseyJezek and Carsey, 1993). The first Antarctic Imaging Campaign began on 9 September 1997 and was successfully concluded on 20 October 1997 (Reference JezekJezek, 1998; Reference JezekJezek and others, 1998b).
The primary scientific goal of the RADARSAT Antarctic Mapping Project is the creation of seamless digital mosaics for distribution to the international Antarctic science community. The Byrd Polar Research Center is tasked with constructing the mosaic using a mapping system developed by Vexcel Corporation and using ancillary data provided by the Environmental Research Institute of Michigan, the U.S. National Imagery and Mapping Agency and countries participating in the Scientific Committee on Antarctic Research. This paper describes data so far acquired and a preliminary digital product that is of sufficient quality to enable early scientific analyses.
Antarctic Imaging Campaign-1
The first Antarctic Imaging Campaign (AIC-1) was made possible by the unique capabilities of RADARSAT, including an electronically steerable antenna array that provided a range of selectable beam-pointing angles. This capability was essential for maximizing the range of the acquisition swaths away from the satellite nadir track. The satellite can also maneuver in orbit, enabling it to change the look direction of the SAR. These two capabilities permitted data acquisitions to the Earth’s South Pole and represent technical abilities afforded by no other civilian space-borne radar.
AIC-1 acquisitions began 7 days earlier than the anticipated start of the nominal acquisition plan. The early data constituted an important precaution against anomalies encountered later in the mission. Nominal acquisitions (Fig. 1) started on schedule shortly after noon eastern standard time on 26 September. The nominal plan was designed to obtain complete mapping coverage within 18 days, and proceeded nearly flawlessly through completion on 14 October. It was executed in parallel with acquisition plans for other RADARSAT-1 users and with the Canadian Space Agency’s background mission (Reference Mahmood, Crawford, Michaud and JezekMahmood and others, 1998). An additional opportunity was realized because of the early start on 19 September. Radar data collected after the conclusion of the nominal mission were acquired exactly 24 days after the beginning of the early start date. This schedule repositioned the spacecraft to within a few hundred meters of its position 24 days earlier. Consequently the data are suitable for interferometric analysis, a demonstrated technique for estimating ice-sheet surface displacement (Reference Forster, Jezek, Sohn, Gray and MatterForster and others, 1998; Reference GrayGray and others, 1998). Exact repeat data collections started on 14 October and continued through 20 October. A map of exact repeat data is shown in Figure 1.
AIC-1 acquisition map. Thin-lined swaths were collected during the nominal phase of the mission. Thick-lined swaths are exact repeat data relative to the early acquisitions. Individual swaths are 100 km wide.
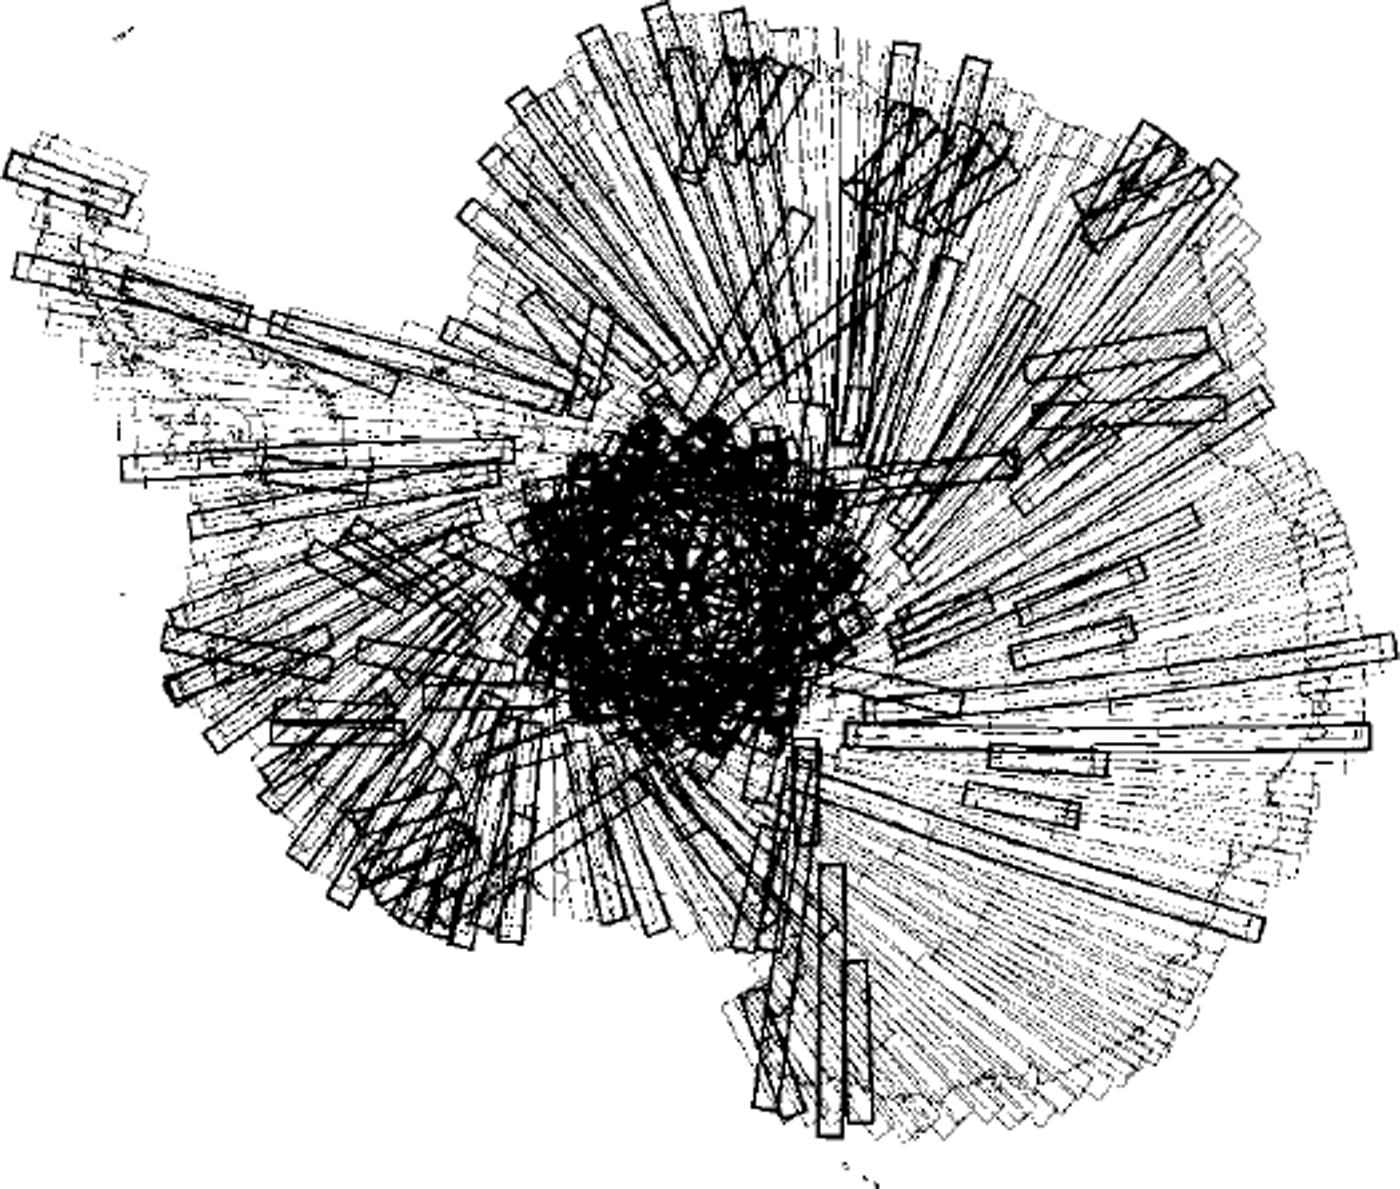
Preparations to return the satellite to normal operations began on 20 October. Arctic-mode operations resumed on 23 October. Acquisitions for customers resumed on 26 October, 9 days ahead of the planned schedule.
Post-Mission Science Assessment
Quick-look images were processed throughout the AIC on the Alaska SAR Processor designed by the Jet Propulsion Laboratory, Pasadena, CA. Quick-look images are 100 km on a side, are not radiometrically or geometrically calibrated and, in this case, have a 100 m pixel size. The images were originally intended to verify that swaths overlapped at the coast and to visually verify data quality, as might be done to make real-time changes in the acquisition plan. In fact the images reveal extraordinary details about the glaciologic and geologic structure of the Antarctic. This is best demonstrated by a composite mosaic constructed from over 4000 RADARSAT-1 quick-look frames processed by the Alaska SAR Facility immediately after the mission (Fig. 2) (Reference Jezek, Sohn and NoltimierJezek and others, 1998a). It is indeed a new view of Antarctica that graphically depicts intricate surface properties over all of East and West Antarctica.
Quick-look mosaic compiled from over 4000 scenes processed by the Alaska SAR Facility during and immediately following the AIC-1. The figure is a polar stenographic projection which has not been corrected for topography or radiometry. Much of the image was manually adjusted to a relative geometric accuracy of several km. Individual swaths are 100 km wide.
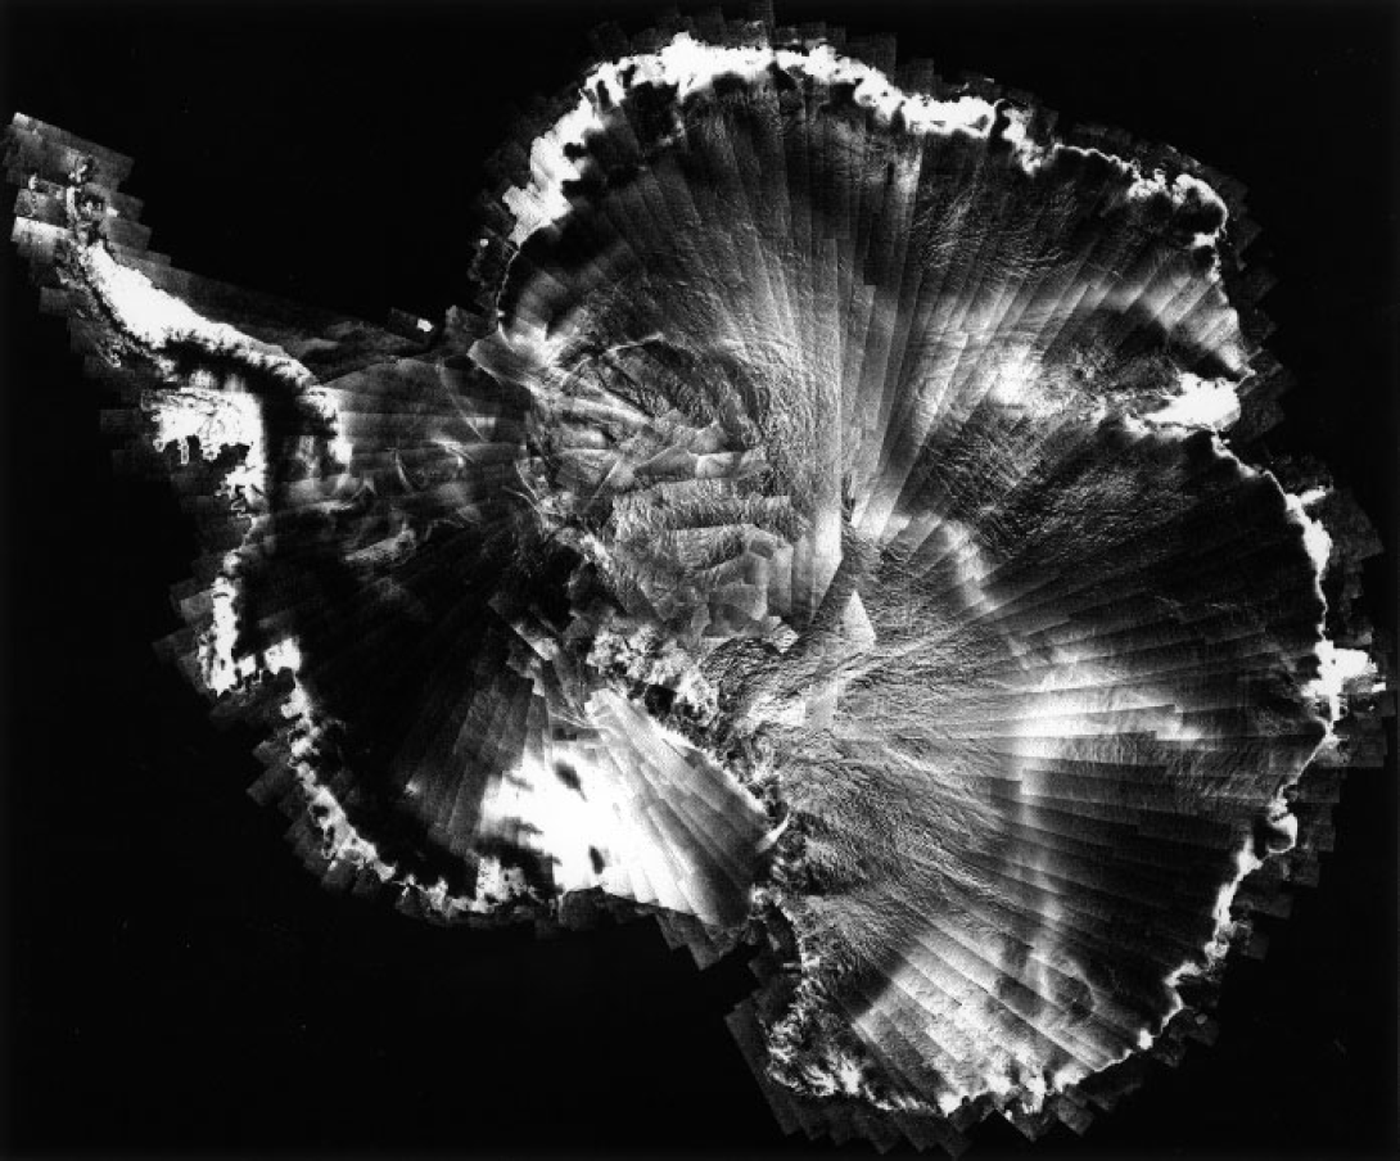
We observe several new and exciting features about Antarctica from the mosaic. First, there are large-scale spatial variations in radar brightness across the entire continent, similar to those observed in backscatter maps derived from the ERS-1 scatterometer (Reference Rott and RackRott and Rack, 1995). The bright portion of Marie Byrd Land and the eastern sector of the Ross Ice Shelf probably represent the region where significant melting and refreezing occurred during sporadic melt events such as the December 1988 occurrence deduced from passive microwave data (Reference Wilson and JezekWilson and Jezek, 1993). Most of the coastal areas and much of the Antarctic Peninsula appear bright also because of firn metamorphosis associated with summer melt. But whereas in Greenland most of the large-scale brightness patterns are associated with firn-melt facies (Reference Fahnestock, Bindschadler, Kwok and JezekFahnestock and others, 1993; Jezek and others, 1994), the remaining, strong variations in radar brightness throughout the Antarctic interior have been attributed to scattering from wind-associated subsurface layering in dry snow facies (Reference Rott, Sturm and MillerRott and others, 1993; Reference RackRack, 1995; Reference Rott and RackRott and Rack, 1995).
Many of the thousands of km-long curvilinear features across East Antarctica appear to follow ice divides separating the large catchment areas. Ice divides taken from Reference DrewryDrewry (1983) are overlain onto the mosaic to demonstrate the correlation (Fig. 3) between ice divides and radar brightness patterns; the mechanism responsible for this correlation is unknown. Based on the signature of those patterns, additional ice-divide-like radar lineaments are extrapolated across other portions of the mosaic. For example, several of these patterns delimit small sectors of the ice sheet inland of Goats Land, East Antarctica, and these may represent small ice divides.
SAR mosaic with elevation-derived ice divides taken from Reference DrewryDrewry (1983) shown by thick white lines. Dashed lines are proposed extensions of ice divides extrapolated from the patterns evident in the SAR imagery. Locations cited in the text are also shown: Dronning Maud Land (DML); Slessor Glacier (S); Recovery Glacier (R); Support Force Glacier (SF); Foundation Ice Stream (F); Ice Stream B (ISB); Mane Byrd Land (MBL); Ross Ice Shelf (MS); Transantarctic Mountains (TAM); Wilkes Subglacial Basin ( WSB).

On the 20 km scale, the East Antarctic ice sheet appears to be very "rough". The texturing is probably due to the flow of the ice sheet over a rough glacier bed. Textures are particularly strong paralleling the flanks of the Transantarctic, Pensacola and Shackleton Mountains and extending deep into adjacent parts of the East Antarctic Plateau. Long linear patterns are strongly suggestive of subglacial geology and may indicate that the ice sheet in this area is resting on relatively resistant basement rocks. Lineament patterns change abruptly across the northernmost section of the Wilkes Subglacial Basin located in George V Land. There the imagery shows remarkable, subtle rounded shapes similar in appearance to the signature of subglacial lakes such as Lake Vostok (Fig. 4).
SAR swaths showing the smooth expression of Lake Vostok (77° S, 105° E) on the surface of the ice sheet. The length of the lake trends roughly north/south. Snow mega-dunes (Reference SwithinbankSwithinbank, 1988, p. 57) appear as long parallel bands at the lower left of the image.

Most intriguing are ice-stream and ice-stream-like features in Dronning Maud Land, partly described in previous research using optical imagery (Reference MarshMarsh, 1985; Reference Swithinbank, Brunk and SieversSwithinbank and others, 1988). Ice streams are made visible by the intense crevassing along the shear margins where chaotic surface roughness results in a strong radar echo. Complexities within the interior of the ice streams are revealed by radar flow stripes that probably originate from subtle variations in topography. Figure 5 highlights the easternmost ice streams. Slessor Glacier (upper center of Fig. 5) is located on the northeastern margin of the Filchner Ice Shelf. The upper reaches of the glacier are funnel-shaped, with the interior of the funnel punctuated by patches of crevasses. The ice stream is about 450 km long from the grounding line to the upstream area that seems to be characterized by several long scars. These are probably shear margins, but it is not possible to deduce whether they are recently initiated or relict ice-stream flow.
East Antarctic ice streams highlighted in theRADAR-SAT imagery by the bright shear margins. The regional setting of several of these features is indicated in Figure 3 Slessor Glacier (S) is fed from a funnel-shaped catchment located in the upper center of the image. Bailey Ice Stream (B) is located just west of Slessor Glacier. Recovery Glacier (R) and two pipe-like tributaries (PI and P2) cut across the center of the image from left to right. The grounding line of the Filchner Ice Shelf follows down the left side of the image. Support Force Glacier (SF) and Foundation Ice Stream (F) are also shown.
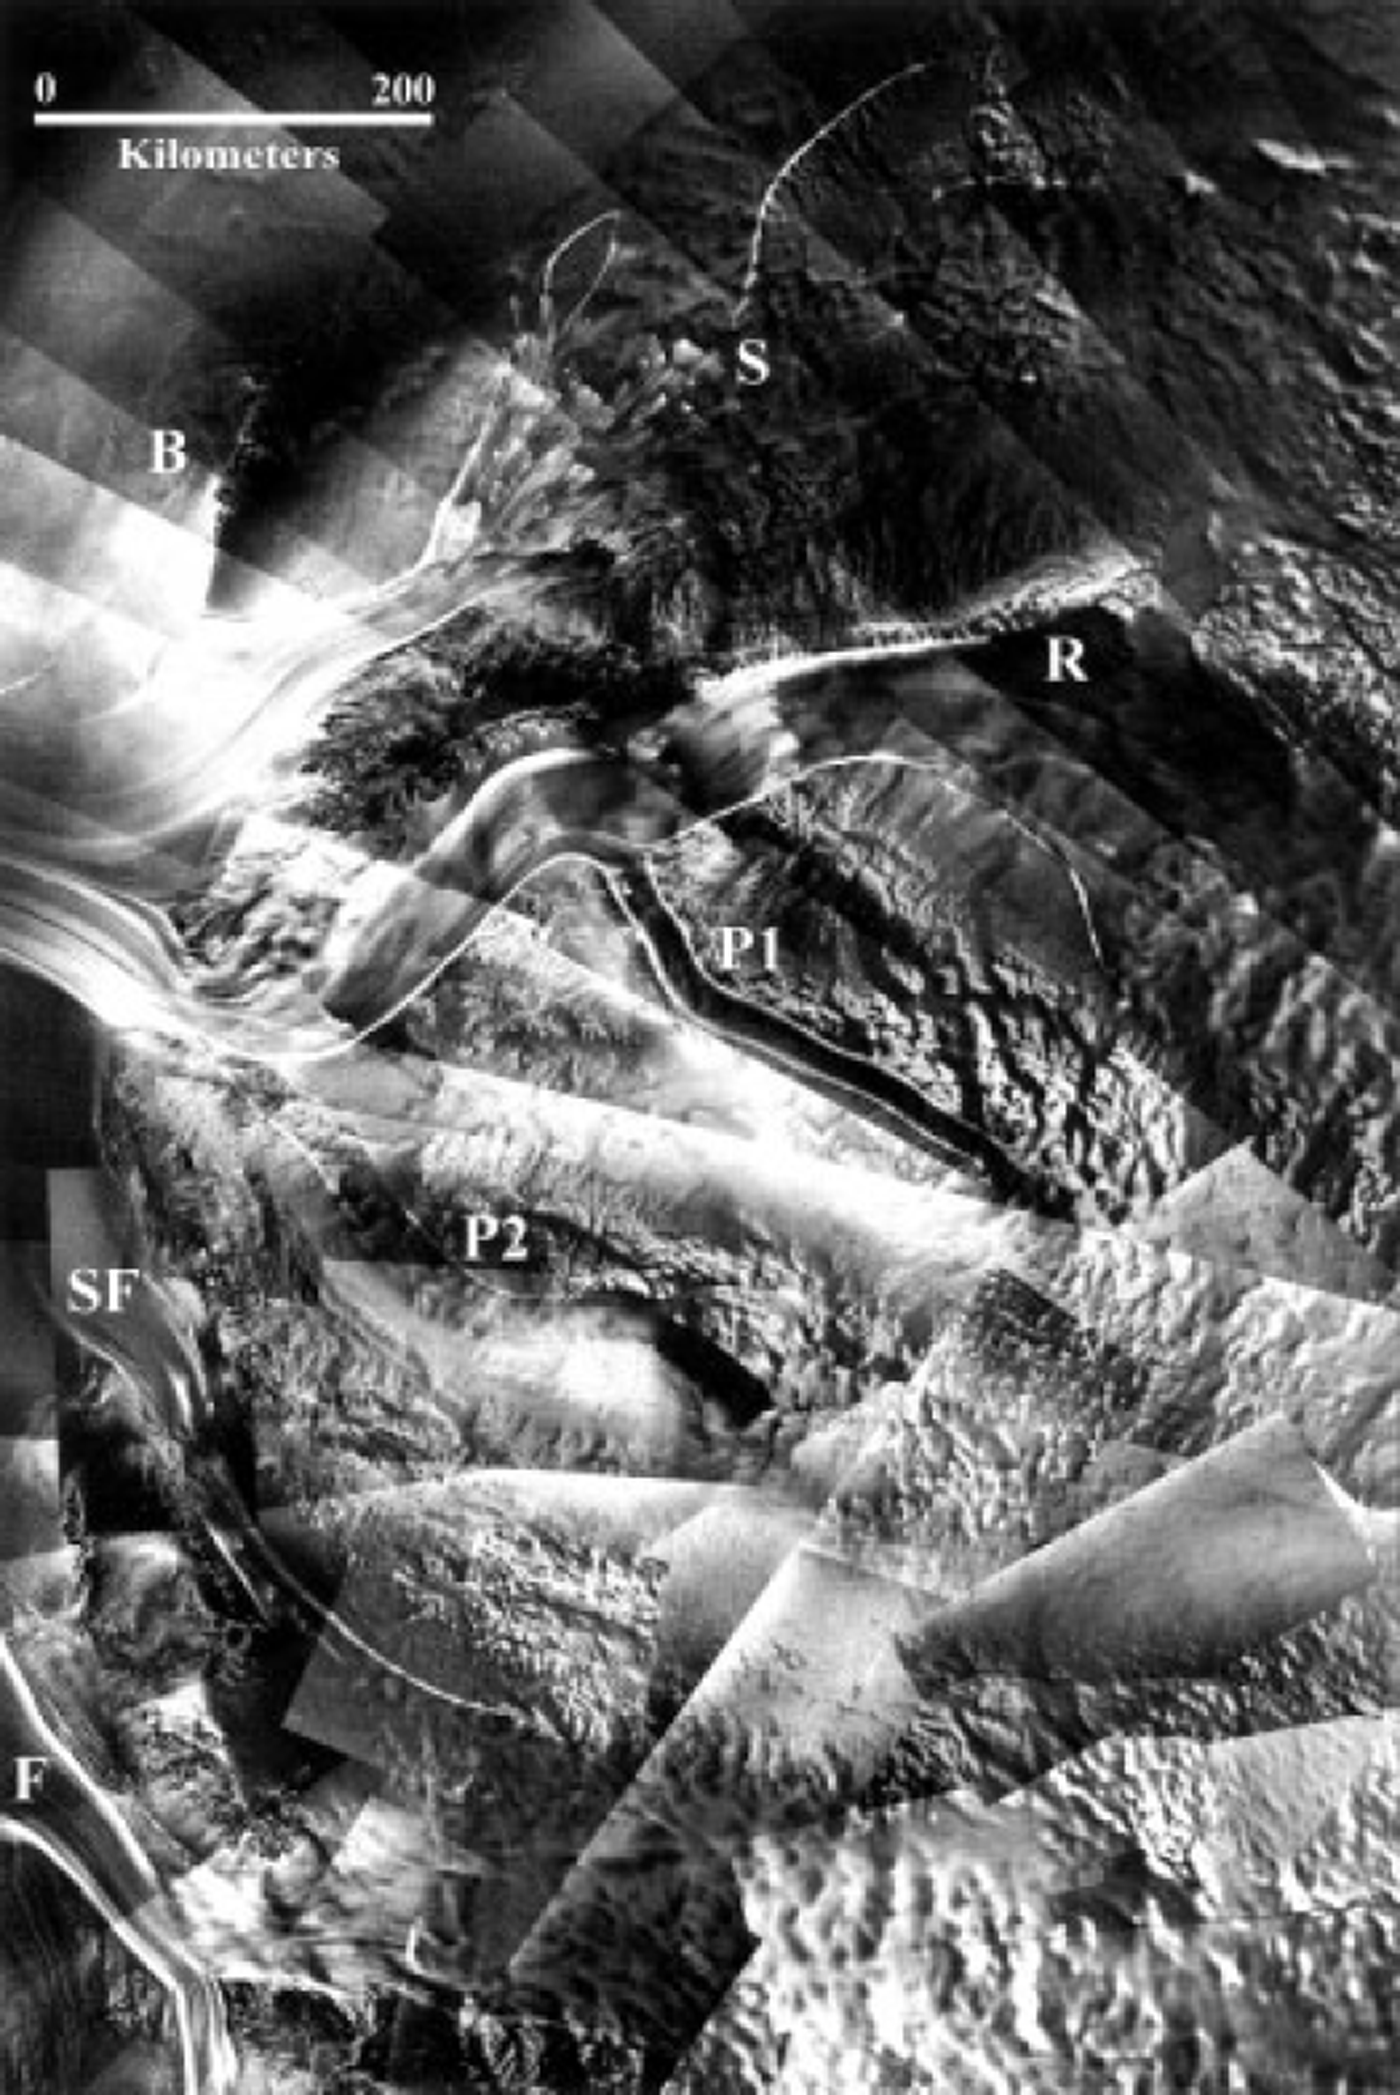
An enormous ice stream, reaching at least 800 km into East Antarctica, feeds Recovery Glacier (Fig. 5). It too is fed by a funnel-shaped catchment. Down-glacier, crevasses cascade across the ice stream at several locations, suggesting that strong variations in basal topography modulate the flow. The confluence of a thin, elongated, 280 km long tributary ice stream with Recovery Glacier is located approximately 250 km from the constriction where Recovery Glacier enters the Filchner Ice Shelf. The central body of the pipe-like tributary is crevasse-free, indicating that shear stresses are concentrated only at the margins. The tributary is an enigma in that there is little evidence for ice flow into the tributary from the adjacent ice sheet and there is little if any indication as to the source of ice from the up-glacier catchment region. A less active pipe-like tributary merges with Recovery Glacier just upstream of the grounding line. The uppermost part of that 300 km long tributary is dark and featureless, similar to the eastern companion. Down-glacier, the tributary surface is mottled like the adjacent ice sheet.
Support Force and Foundation Ice Streams are located at the lower left of the image. The up-glacier part of Foundation Ice Stream forks into two tributary streams that extend about 200 km into East Antarctica. Taken together, these East Antarctic ice streams are as extensive as the more studied West Antarctic ice streams. The presence of the ice-stream system also suggests more active mechanisms for moving ice out of the East Antarctic ice sheet, perhaps indicating a potentially more changeable ice sheet.
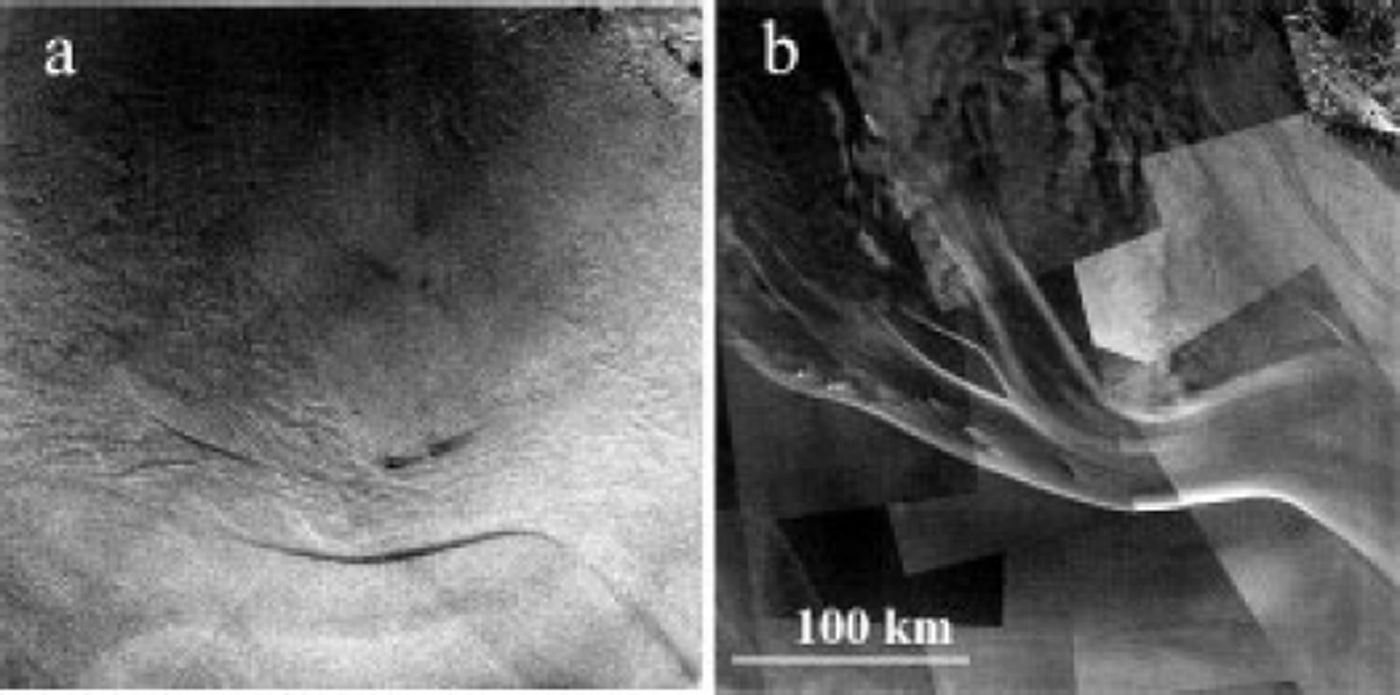
Interesting comparisons are found between 1997 RADARSATdata and 1960s satellite reconnaissance data collected as part of the Corona program (Reference Bindschadler and VornbergerBindschadler and Vornberger, 1998; Reference Sohn, Jezek and van der VeenSohn and others, 1998). The comparison gives an opportunity to search for change, and to study the ice sheet in the visible and microwave parts of the electromagnetic spectrum. Figure 6 compares image data from 1963 and 1997. The tributaries of Ice Stream B and the confluence of Ice Streams A and B are easy to observe in the RADARSATdata. The 1963 visible imagery shows equivalent portions of Ice Stream B, which seems qualitatively similar in shape and structure to the 1997 data. Ice Stream A is almost undetectable in the Corona data, probably because of unfavorable sun illumination angles. Crevassed areas appear bright in the radar imagery because SAR is particularly sensitive to wavelength-scale variations in surface roughness. SAR can also penetrate several meters into snow, which may mask buried crevasses from view by optical sensors. Corresponding areas of open, chaotic crevassing appear dark in the optical imagery because of shadowing. Subtle changes in surface topography appear in the optical imagery because of slight changes in slope. For example, elongated hills stretch obliquely across the up-glacier part of Ice Stream B2 (lower left of the Corona image). Crevasse patches detectable in the radar correlate with the location of the hills which cause the rapidly flowing ice to stretch and fracture.
Comparison of Ice Stream B using 1997 RADARSAT microwave (right) and 1963 Corona visible (left) data. The regional setting of Ice Stream B is shown in Figure 3
Conclusions
AIC-1 demonstrated the technical capability to acquire nearly instantaneous high-resolution microwave imagery of the entire Antarctic continent. The technical achievement is being followed by an unfolding scientific examination that is revealing the glaciology and geology of Antarctica in unexpected detail. As importantly, the acquisitions provide an important benchmark for gauging future changes in the Antarctic. AIC-2, currently planned for the start of the new millennium, will be another benchmark for testing ideas about the influence of changing climate on the great ice sheet.
As this century comes to a close, it is interesting to reflect on the fact that we now possess the ability to regularly observe the entirety of our world in unprecedented detail and across a wide part of the electromagnetic spectrum. The RADARSAT program, building on a scientific, engineering and political heritage going back to the early days of the Corona missions, is a demonstration of that ability and of the international commitment necessary to achieve such a goal. In turn, that ability levies a responsibility on the science community to forcefully argue for regular acquisition of such information in a fashion that is accessible and understandable to anyone interested in the results and in pondering their implications.
Acknowledgements
This project is supported by NASA’s Pathfinder and Polar Oceans and Ice Sheets Programs. Partners on the project include the Canadian Space Agency, the Alaska SAR Facility, the Goddard Space Flight Center, Greenbelt, MD, the Jet Propulsion Laboratory and Vexcel Corporation. The Canadian Space Agency holds copyright to the imagery presented in this paper. I am grateful to H. Sohn, K. Noltimeir and B. Li for their help in preparing the figures.



