


States cooperate in order to remedy shared problems and achieve common goals (Abbott and Snidal Reference Abbott and Snidal2000). Yet, as Dai and Snidal (Reference Dai, Snidal and Denemark2010) parsimoniously observe, “cooperation is not easy.” Even when states hold similar preferences, cooperative efforts may fall victim to fears of noncompliance or disagreements over distribution of benefits (Stein Reference Stein1982). This article introduces a hitherto ignored explanation for how states achieve cooperation in the face of these coordination and collaboration dilemmas. I argue that efforts at cooperation depend, in part, on existing structures of cooperation in the international system. States do not bargain over agreements in a vacuum but are embedded within a larger context of cooperative relationships. This context conditions the costs and benefits of subsequent cooperative endeavors, such that the probability of cooperation for any given pair of states is endogenous to the third-party ties those states have already established. Put differently, international cooperation is governed by endogenous network influences; the creation of international agreements and institutions directly affects the cooperative efforts of others. Scholars of international relations (IR) have long recognized the role of endogeneity in international cooperation (e.g., Axelrod Reference Axelrod1984), and some have explicitly analogized the international system to a complex network (e.g., Deutsch et al. Reference Deutsch, Burrell, Kann, Lee, Lichterman, Lindgren, Loewenheim and Van Wagenen1957). Yet, these intuitions have rarely been given precise theoretical formulation or subjected to rigorous empirical analysis. This article conducts a formal analysis of the network determinants of international cooperation.
The analysis focuses on bilateral cooperation agreements—a vast body of international treaties covering such issue areas as trade, culture, security, and the environment. Bilateral agreements outnumber their multilateral counterparts by nearly ten to one (Rohn Reference Rohn1984). Yet, aside from a few high-profile issues, they receive scant scholarly attention.Footnote 1 This oversight is unfortunate; given their ubiquity, bilateral agreements promise valuable insights into the dynamics of international cooperation. In theorizing international cooperation, I adopt the rationalist assumption that states select bilateral partners so as to maximize the benefits of cooperation while minimizing risks (Dai and Snidal Reference Dai, Snidal and Denemark2010). When creating new agreements, prospective partners necessarily consider an array of exogenous political, economic, geographic, and other factors. But they must also consider one another's agreements with third parties. These third-party ties matter for two reasons. First, they provide information about states’ trustworthiness and reliability as cooperative partners, and about their preferences over different distributions of gains. Second, they affect the rewards of cooperation by generating issue-specific externalities and by allowing states to build durable reference groups or “clubs” of partners. In short, third-party ties reduce the risks and increase the gains of cooperation. Bilateral agreements endogenously influence the creation of new bilateral agreements precisely because states wish to avoid the coordination and collaboration problems that have historically plagued cooperative endeavors. A central implication of this argument is that endogenous influences are not merely statistical nuisances—as they are often treated—but are in fact substantively meaningful phenomena. Further, the analysis shows that the causal mechanisms driving this endogeneity are not limited to specific categories of agreement but are generalizable across issue areas, wherever coordination and collaboration problems persist.
Empirically, I treat bilateral agreements as an evolving social network that defines the strategic environment in which states interact (cf. Lake and Powell Reference Lake and Powell1999). The formation of new agreements creates new network ties and changes the structure of the network accordingly. This changing structure subsequently impacts state-level decisions to commit to new agreements. The microlevel actions of states and the macrolevel structure of the network are thus inextricably linked. Synthesizing network concepts and cooperation theory, I develop three testable hypotheses. States are most likely to form bilateral cooperation agreements with countries that (1) share agreements with their existing partners, (2) are more active overall in acceding to bilateral agreements, and/or (3) share political, economic, or geographic characteristics with their existing bilateral partners.
I employ network methodologies to model bilateral agreements across economic, military, cultural, and environmental issue areas. Bilateral agreements offer a valuable test of the argument because they are nominally limited to only two members and should, in principle, be self-contained. The empirical evidence shows not only that bilateral agreements exercise substantial influence beyond their member states, but that a common set of network dynamics drives bilateral cooperation in everything from commodities to cultural exchange to fisheries. The article proceeds in five sections. First, I discuss existing work on international cooperation and clarify the network aspects of bilateral agreements. Second, drawing on the logic of coordination and collaboration, I develop a network theory of bilateral cooperation. Third, I discuss data on bilateral agreements and outline the statistical model. Fourth, I present empirical results. The fifth section concludes. An extensive supporting information addendum (SI) provides in-depth discussion of data and methods.
INTERNATIONAL COOPERATION AND BILATERAL NETWORKS
According to international cooperation theory, states “use international institutions to further their own goals” (Koremenos, Lipson, and Snidal Reference Koremenos, Lipson and Snidal2001, 762) and “design treaties and other legal arrangements to solve specific substantive and political problems” (Abbott and Snidal Reference Abbott and Snidal2000, 421). In short, cooperation is a strategy for solving shared problems and achieving joint gains. The exogenous conditions that cultivate shared interests are diverse—economic ties, political similarities, cultural or historical connections, geographic proximity, and so on. Yet, even when these influences predispose states toward cooperation, states nonetheless often fail to cooperate. Cooperation failures take many forms,Footnote 2 but they are perhaps most fundamentally rooted in issues of distribution and enforcement, commonly known by the distinction between coordination problems and collaboration problems (Fearon Reference Fearon1998; Martin Reference Martin1992; Snidal Reference Snidal1985; Stein Reference Stein1982). In a coordination problem, states mutually prefer cooperative over noncooperative outcomes but disagree on the precise institutional form that cooperation should take, usually due to conflicts over how to distribute the resulting gains. In a collaboration problem, cooperation leads to efficient outcomes, but states have incentives to unilaterally defect and secure gains from cheating. If states cannot coordinate on a mutually agreeable institutional structure, or if they cannot overcome fears of noncompliance, cooperation fails. As Fearon (Reference Fearon1998) shows, coordination and collaboration problems are not mutually exclusive; rather, they characterize distinct but linked phases—bargaining and enforcement—of virtually all cooperative scenarios. For example, if prospects for ex-post compliance are low, states have little ex-ante incentive to coordinate on an agreement in the first place (cf. Downs, Rocke, and Barsoom Reference Downs, Rocke and Barsoom1996). Similarly, while a long shadow of the future increases compliance (Axelrod Reference Axelrod1984), it also encourages states to bargain harder and worsens the odds of successful coordination (Fearon Reference Fearon1998).
Scholars have proposed a variety of solutions to cooperation problems.Footnote 3 Recent scholarship especially emphasizes the palliative effects of institutional design, where enforcement—and, thus, bargaining—dilemmas can be ameliorated by careful selection of membership criteria, issue scope, and flexibility in renegotiation (e.g., Koremenos, Lipson, and Snidal Reference Koremenos, Lipson and Snidal2001). This literature directly links cooperation to endogenous influences. For example, Martin and Simmons observe that “institutions are simultaneously causes and effects. . .both the object of state choice and consequential” (Reference Martin and Simmons1998, 743, italics in original). Koremenos, Lipson, and Snidal confirm this notion: “states construct and shape institutions to advance their goals,” and, in turn, institutions “advance or impede state goals in the international economy, the environment, and national security” (Reference Koremenos, Lipson and Snidal2001, 762).
This widely acknowledged “duality” of institutions suggests that endogenous influences are fundamental to cooperation (Dai and Snidal Reference Dai, Snidal and Denemark2010). Yet, empirical studies of duality have thus far focused mainly on institutional design. The present analysis extends the notion of duality to consider network-oriented endogenous influences, where cooperation between a given pair of states—for example, in a bilateral trade institution or an environmental agreement—is endogenous not only to the interests of those prospective partners, but also to the bilateral institutions in place among politically relevant third parties. Indeed, empirical studies of institutions readily acknowledge these cross-national and cross-dyadic influences; standard models of treaty ratification, for example, control for the possibility that a state's probability of ratification increases as the ratification rate of its neighbors increases (e.g., Simmons and Danner Reference Simmons and Danner2010). Nonetheless, these studies tend to view endogeneity more as a methodological nuisance than as an object of inquiry itself, and they largely ignore the seemingly fundamental question of why endogeneity exists in the first place.Footnote 4 In contrast, I elevate endogeneity to the subject of inquiry and explore its provenance. I thus conceptualize endogeneity as a type of network influence, where existing bilateral agreements constitute the larger structural context within which states bargain over new cooperative endeavors.
Network approaches to IR are novel but growing in influence (Hafner-Burton, Kahler, and Montgomery Reference Hafner-Burton, Kahler and Montgomery2009). While IR scholars commonly disaggregate the system of states into discrete country-pair or dyad-year observations, the international system does not, in fact, consist of isolated pairs of states. Indeed, classic IR theories, unconstrained by methodological practicalities, attributed substantial import to “extra-dyadic” influences. Concepts like complex interdependence and system structure, for example, are deeply infused with nascent network insights.Footnote 5 Studies of international institutions often make these intuitions explicit. Martin and Simmons argue that interdependence generates a “dense network of relations” (Reference Martin and Simmons1998, 751), while Davis similarly asserts that a “dense network of international institutions” shapes interstate bargaining (Reference Davis2004, 154). If these network intuitions are correct, they should evince observable network influences.
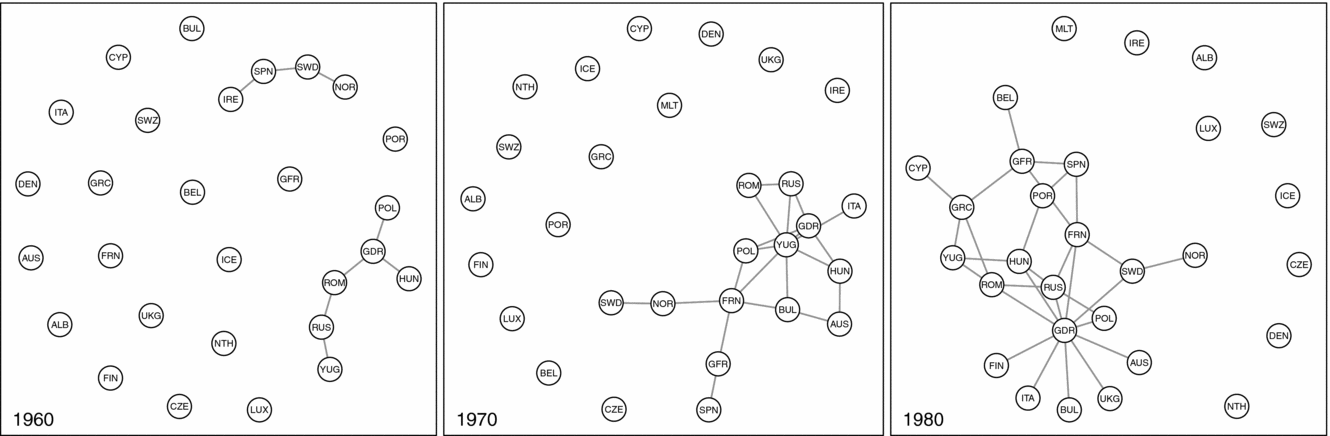
Formally, a network requires three elements: (1) a set of actors; (2) a set of relations or ties connecting the actors to one another; (3) interdependencies, such that the ties formed by some actors influence, and are in turn influenced by, the ties formed by others. Figure 1 uses agreements in science and technology to illustrate a network view of bilateral cooperation.Footnote 6 In 1960, at the height of the Cold War, these agreements were relatively few in number and clustered among exclusive sets of Eastern- and Western-bloc states. By 1970, agreements began to cut across blocs, with France (FRN) in particular occupying a “bridge” position between opposing sides. By 1980, scientific and technological agreements virtually engulfed the continent. At each observation moment, the agreements currently in place—i.e., the network ties—constitute the strategic environment in which states create new agreements. As new ties emerge, the network changes accordingly. This analysis explains the evolution of such networks by theorizing and modeling the influences that lead states, at the microlevel, to create bilateral ties. Naturally, exogenous influences like geography, trade, and power condition these ties; but so too does the structure of the network itself.
Evolution of Bilateral Scientific and Technological Agreements in Europe, 1960–1980
Note: Lines indicate agreements entered into force within past ten years (including year of observation). Node placement determined by Fruchterman-Reingold algorithm. See the SI for acronyms.

MECHANISMS OF NETWORK INFLUENCE IN BILATERAL COOPERATION
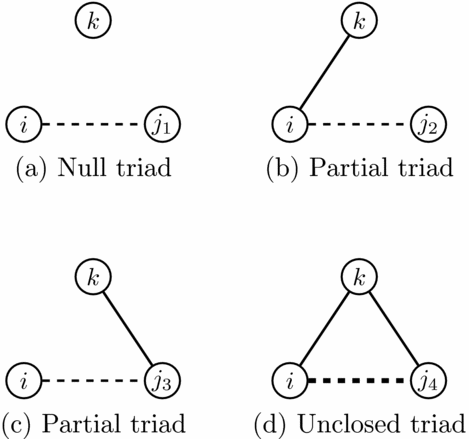
Because network influences can take numerous forms, they must be given precise theoretical formulation. For example, an actor with many network ties may attract additional ties, or actors who share ties to the same third parties may be more likely to form ties themselves. To simplify the exposition, I focus on one network influence, triadic closure, a fundamental network property (Granovetter Reference Granovetter1973; Watts Reference Watts1999). I later introduce additional effects. Consider the graphs in Figure 2, where i represents the “initiator” of a bilateral agreement; j represents a prospective partner; and k represents any number of relevant third parties. (I employ this notation for i, j, and k throughout the article.) Triadic closure implies that the probability of ij cooperation is highest in Figure 2(d), where both states share a tie with k and the creation of a direct ij 4 tie would “close the triad.”Footnote 7 This tendency toward closure—known colloquially by such idioms as “The friend of my friend is my friend” (cf. Maoz et al. Reference Maoz, Terris, Kuperman and Talmud2007)—indicates that actors pursue transitivity or structural balance in their social relations (Heider Reference Heider1958; Holland and Leinhardt Reference Holland and Leinhardt1971). In the context of bilateral cooperation agreements, a triadic closure effect means that, ceteris paribus, sharing agreements with common third parties increases a given i and j’s probability of direct cooperation.
Four Types of Triads
Note: Solid lines indicate bilateral cooperation agreements. Dashed lines indicate prospective agreements.
Why should triadic closure matter for bilateral cooperation? I argue that, via two distinct causal mechanisms, network ties alleviate the collaboration and coordination problems that imperil cooperation. Via information mechanisms, third-party ties reveal information about states’ capacities for institutional compliance and overall trustworthiness as partners, and about their preferences over different possible distributions of gains. Via externalities mechanisms, third-party ties incentivize triadic closure by generating issue-specific negative externalities and by helping states establish reference groups of partners that, over time, produce club goods and ingroup rewards.
Information Mechanisms
A long-standing assumption in international relations is that, due to systemic anarchy, states lack credible information about one another's preferences (Keohane Reference Keohane1984; Waltz Reference Waltz1979). Consequently, states cannot determine whether potential partners wish to cooperate for mutual gain or instead wish to secure gains through defection (Kydd Reference Kydd2005). States may also harbor more benign concerns about whether partners possess sufficient resources to maintain treaty commitments (Chayes and Chayes Reference Chayes and Chayes1996). Questions about trustworthiness and reliability are the driving force behind collaboration problems. States require information about both the willingness and the ability of potential partners to meet institutional obligations. Third-party ties provide this information by identifying targets that one's own partners have deemed trustworthy and capable.
In interpersonal networks, third-party ties encourage trust—and, thus, triadic closure—through i and j’s mutual affect toward k. In interstate networks, in contrast, trust emerges via the risks of cooperation. Kydd (Reference Kydd2005) shows that when states lack information about one another's preferences, incremental acts of cooperation function as costly signals. Sufficiently risky cooperative overtures reveal a state to be a cooperative type rather than an exploitative type, willing to accept some risk of defection for the sake of mutual benefit. Signaling arguments are usually dyadic, such that signals only matter to those actors directly involved in bargaining, but signals also have implications for external observers. Consider again Figure 2(d). For any i partner of k, the kj 4 tie indicates, first, that k has deemed j 4 sufficiently trustworthy to risk reciprocal cooperation, and, second, that in k’s determination, j 4 is capable of meeting its institutional obligations. Further, through its own relationship with k, state i has first-hand knowledge of k’s evaluative standards and risk propensity—information that, in null or partial triads, i would not likely possess. The kj 4 tie thus conveys nontrivial information about j 4 to k’s existing partners. In general, network ties provide a credible third-party assessment of a prospective partner's reliability and trustworthiness.
Concerns about trust and reliability plague numerous issue areas but are perhaps most apparent in military cooperation. Consider, for example, relations between Japan and South Korea, long characterized by mistrust. The United States, an integral k third party, has deliberately targeted trust dilemmas as a means of promoting greater Japan-Korea cooperation (Cha Reference Cha1999), such that “a failure of US commitment only increases insecurity and mutual mistrust” (Green Reference Green1999, 23). In this triadic context, Japan and Korea's respective ties to the US provide information about one another's cooperative intent and potential contributions to bilateral actions. In the mid-2000s, the US signed separate bilateral military agreements with both Japan and Korea, including agreements on general sharing of military intelligence (GSOMIA) and on mutual logistical support (MLSA). Shortly thereafter, supporters of bilateral cooperation began pushing for similar agreements between Korea and Japan. A prominent Korean academic referred to the absent Korea-Japan agreements as a “missing link,”Footnote 8 and Korean newspapers argued that closing the triad would allow more efficient use of Japanese satellite technology and logistical support.Footnote 9 In early 2011, in a historically unprecedented move, defense ministers from Japan and Korea met to discuss implementation of both a GSOMIA and MLSA,Footnote 10 thus initiating a dialogue that, arguably, would not have materialized without the pressures and incentives created by each state's respective ties to the US.
In addition to trust dilemmas, states may fail to cooperate if they disagree over distributions of gains. With complete information, such coordination problems are entirely distributional, but states often lack information about the precise distributional impact of different institutional arrangements and are thus unsure of one another's preferred outcomes. If states share private information and pool their technical knowledge, they may discover that they both prefer the same institutional design—in which case cooperation follows unproblematically. Yet, states have incentives to withhold private information. For example, a state may know that a particular set of institutional rules will disproportionately benefit itself, and revealing this information would lower the probability of that outcome being chosen by others (Morrow Reference Morrow1994). Incentives to withhold information can thus prevent cooperation even when mutually acceptable agreements exist.
Morrow (Reference Morrow1994) argues that international regimes diminish coordination problems by structuring communication and facilitating exchange of information (cf. Keohane Reference Keohane1984). Network ties function analogously. Specifically, a state's third-party ties indicate the types of agreements that are acceptable to that state. Thus, bilateral agreements between i and k partially reveal i’s preferences on design issues such as scope of agreement, monitoring and enforcement mechanisms, escape clauses, flexibility and renegotiation, and so on (cf. Koremenos, Lipson, and Snidal Reference Koremenos, Lipson and Snidal2001). Importantly, agreements between j and k reveal precisely the same information about j; the mutual {ik, jk} ties of an unclosed triad thus maximize information provision. Further, because i and j have both forged bilateral agreements with a common k third party, there likely exists a correspondence of interests between them, reflected by their mutual interest in cooperation with the same partner; consequently, their preferences are more likely to overlap, such that, when those preferences are revealed, rather than competing over divergent outcomes, both actors readily converge on a single mutually preferred outcome. Again, these mechanisms only obtain in the unclosed triad in Figure 2(d) and, all else constant, should be weak or nonexistent in null or partial triads.
Empirical evidence shows that third-party ties do indeed act as informal precedents. For example, early US trade agreements with Singapore and Chile served as “bellwether” treaties that “set the substantive parameters” and generated “precedent-setting effect[s]” for future agreements (Weintraub Reference Weintraub and Schott2004). The US-Singapore agreement—the first such agreement between the US and an Asian country—informed other Asian states of US standards on contentious issues like trade in services, government procurement, intellectual property, investment protection, labor standards, and environmental regulation (Weintraub Reference Weintraub and Schott2004, 89). The US-Chile agreement accomplished similar goals with respect to Latin American countries (Feinberg Reference Feinberg2003; Weintraub Reference Weintraub and Schott2004). The agreements appear to have been relatively successful in this regard, as they opened doors to trade talks between the US and additional partners in both regions (Feinberg Reference Feinberg2003). Thus far, the US has “closed the triad” with three of Chile's FTA partners—Colombia, Peru, and Panama.
Many bilateral agreements involve coordination and collaboration simultaneously (Fearon Reference Fearon1998). Consider the postwar emergence of cultural and scientific exchange between the US and the Soviet Union. Both states viewed such exchanges as inherently strategic endeavors (Bu Reference Bu1999; Gould-Davies Reference Gould-Davies2003). The US feared that Soviet visitors would engage in espionage and propagandizing, while the Soviets worried about the influence of American media. In 1955, at the four-power summit in Geneva, the adversaries discussed a variety of exchange agreements, but their strategy of rejecting concessions and pursuing “unilateral advantage” doomed the proceedings (Hixson Reference Hixson1997, 106). Not only did the US and USSR doubt one another's trustworthiness, but they also disagreed on how to structure the agreement itself, especially regarding the size, scope, and duration of exchanges. A Soviet cultural minister later discussed his country's bargaining position: “[f]or us, the most favorable forms of agreements on cultural cooperation with capitalist states are cultural agreements . . .[that] contain only general principles of cooperation (mutual understanding, friendship . . .cultural relations . . .) and do not fix any concrete measures on the two sides.”Footnote 11 The US, on the other hand, favored explicit assurances of “equality, reciprocity, and mutual benefit” (Richmond Reference Richmond2003, 17). The historic Zarubin-Lacy agreement was eventually signed in 1958, but not before the USSR had established bilateral exchange agreements with key US allies: Belgium and Norway in 1956, and France and the UK in 1957 (Richmond Reference Richmond2003). These agreements were landmarks for the USSR and the new Khruschev regime. Not only did they reveal Soviet obduracy on particular questions of institutional design, but they also signaled that, in the minds of US allies, Khruschev was acceptably trustworthy on matters of cultural exchange. Subsequently, consistent with the logic of triadic closure, Zarubin-Lacy prompted agreements between the US and other Eastern-bloc states, including Romania, Poland, and Yugoslavia (cf. Bu Reference Bu1999).
Externalities Mechanisms
Cooperation may provide access to otherwise unattainable gains, but these gains vary in size, and the “gap in gains” between exploitative and cooperative outcomes also conditions the probability of cooperation (Lipson Reference Lipson1984). If prospective gains are small, states will be less motivated to cooperate. Similarly, the lower a state's costs for noncooperation, the more likely it is to bargain hard, thus lowering the probability of successful coordination (Fearon Reference Fearon1998). Third-party ties influence cooperation by enlarging this gap in gains. Reconsider Figure 2. Holding all else constant (including trustworthiness), a given i should be more likely to cooperate with j 4 than with j 1,2,3 precisely because, relative to the noncooperative outcome, the ij 4 tie yields the highest payoff. This is so because unclosed triads generate negative externalities while simultaneously promising beneficial externalities.
First, unclosed triads generate negative externalities that materially deteriorate i and j’s status quo relationship, pressuring them to cooperate with one another directly due to an increasing gap in gains. The precise form of these externalities is issue specific, but they are widely apparent across issue areas. For example, preferential trade agreements (PTAs) create negative externalities insofar as reduced tariffs encourage trade diversion from more efficient nonmember producers to less efficient PTA members (Bagwell and Staiger Reference Bagwell and Staiger1997). When an unclosed PTA triad forms, importers in both i and j switch to k, who benefits disproportionately. Forming a PTA thus allows i and j to restore the more efficiently produced imports they previously received from one another (Manger, Pickup, and Snijders Reference Manger, Pickup and Snijders2012).Footnote 12 Similarly, unclosed security triads prevent efficient cooperation on military issues. For example, GSOMIAs explicitly restrict sharing of classified information with third parties; in an unclosed triad, i may have limited access to security information from k if that information was previously shared with or received from j.
These pressures are apparent even in areas such as environmental regulation. Consider the bilateral fisheries agreements negotiated among China, South Korea, and Japan following entry-into-force of the UN Law of the Sea Convention in 1994. The Japan-Korea agreement was implemented first, in January 1999, replacing a bilateral pact that had endured since 1965. Next came the China-Japan agreement, which entered into force in June 2000 and replaced a series of agreements dating to 1955. Korea-China cooperation proved less tractable. These two states lacked formal diplomatic relations until 1992, had no prior agreements to draw upon, and largely engaged in “free fishing activities” (Kim Reference Kim2003, 104). Yet, the Japan-Korea agreement delineated Korean fishing rights in areas also accessible to China, creating the potential for jurisdictional disputes (Kim Reference Kim2003). At the same time, the China-Japan agreement severely limited China's access to Japanese waters; China requested access for 4,000 vessels, but Japan allowed only 600.Footnote 13 These restrictions pushed Chinese fishermen into Korean waters, where they targeted the same fish as their Korean counterparts (Kang Reference Kang2003) and, indeed, quickly exceeded the catch of Korean ships.Footnote 14 As a direct consequence of these externalities, Korean officials demanded an acceleration of talks on fisheries regulation.Footnote 15 China, eager to clarify jurisdictional obligations, readily accommodated. A Korea-China agreement ultimately entered into force on June 30, 2001, closing the triad.
Second, bilateral agreements generate positive externalities by establishing reference groups of like-minded cooperators. States often use institutional affiliations to define specific ingroups and outgroups, as evidenced by such informal clusterings as the Soviet bloc, the nonaligned states, the developed world, the global south, and others (Hafner-Burton and Montgomery Reference Hafner-Burton and Montgomery2006). These reference groups consist of states that hold relatively similar preferences and tend to interact more with one another than with outsiders. Triadic closure is a small-scale form of group cohesion; when actors prefer ties to “friends of friends” over ties to unaffiliated others, they effectively favor ingroup over outgroup relations. Studies of group dynamics typically explain ingroup favoritism in terms of social-psychological mechanisms, but in international relations, favoritism is likely strategic. Group membership promises such beneficial externalities as deepened economic relations, security umbrellas, and multilateral organizations. By focusing their ties on the reference group, states increase the potential gains of cooperation beyond the immediate payoffs of bilateral agreements.
Cases of regional integration offer especially compelling examples. Consider the relationship between the Andean Community (CAN) and Mercosur. In 2004, in response to accumulating bilateral economic and other ties between members of the two organizations, Mercosur extended associate membership to all members of CAN. In 2005, CAN reciprocated. Bilateral ties thus initiated a series of long-term club goods: expanded institutional memberships, deepened economic integration, and the eventual development of a larger South American Union (UNASUR), which extends to such contentious issue areas as immigration, education, energy security, and even defense policy. Tellingly, Chile is a full member of neither Mercosur nor CAN (having left the latter in 1976) but, due to its extensive bilateral ties to other South American countries, is a founding member of UNASUR. Of course, Latin American states also share agreements with extra-regional actors. Triadic closure simply means that, ceteris paribus, the baseline probability of cooperation is generally highest among the ingroup, where long-term club goods are most likely to accrue.
Hypotheses and Additional Network Influences
Information and externality mechanisms are complementary. As the number of k third parties with whom i and j share agreements grows, information mechanisms reduce the risk of bilateral cooperation while externality mechanisms increase the relative benefits, generating third-party incentives for direct ij cooperation. Importantly, the generality of these mechanisms means they are broadly applicable to a wide variety of issue areas—an implication I empirically verify later in the article. The discussion of triadic closure thus yields the following hypothesis:
Hypothesis 1. States that share bilateral agreements with the same third parties are more likely to form bilateral agreements themselves (“triadic closure effect”).
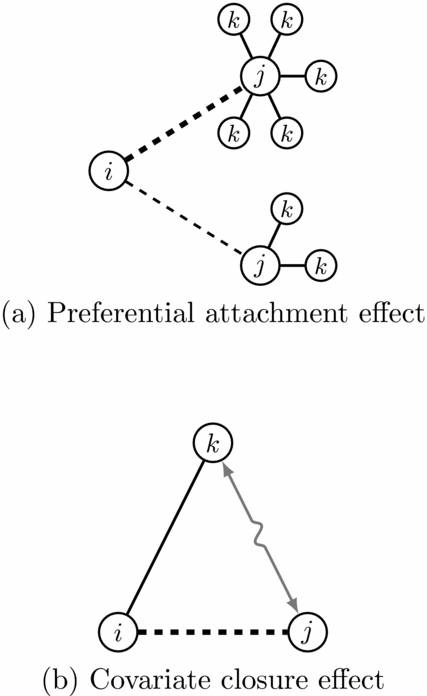
Though I focus primarily on triadic closure, other network influences may be apparent. In particular, states may prefer to cooperate with partners that simply form more bilateral agreements in general, irrespective of whether they share partners in common. Figure 3(a) illustrates preferential attachment, where i’s probability of creating a tie to any given j target depends on that target's “degree centrality,” or overall number of network ties (Barabási and Albert Reference Barabási and Albert1999). In terms of the proposed causal mechanisms, high-degree targets may convey trustworthiness and reliability more credibly than their low-degree counterparts. During the 1990s, for example, Japan increased security cooperation not only with the US but also with major European powers, which, to a third party like South Korea, may suggest a general interest in cooperation. As well, the more agreements a state enters, the more information it reveals about its preferences over institutional designs. When the USSR began signing exchange treaties in the 1950s, outside observers of all varieties, even those who lacked an explicit “friend of a friend” connection, gained insight into the types of agreements the Soviets found acceptable. In terms of externalities, partnerships with high-degree states promise greater rewards, as creating a tie to a high-degree j engenders indirect ties to—and thus improves prospects for direct cooperation with—j’s numerous k partners. For all these reasons, high-degree states should endogenously attract further cooperative ties.
Additional Network Influences
Note: Solid lines indicate bilateral cooperation agreements. Dashed lines indicate prospective agreements. Gray arrows indicate ties or similarities in exogenous covariates.
Closure and attachment are perhaps the most fundamental processes in complex networks (Newman Reference Newman2003b). I nonetheless expect the former to have a stronger substantive impact on cooperation than the latter. In anarchy, cooperation hinges crucially on credible information. Because triadic ties involve trusted intermediaries—specifically, i and j’s mutual k partners—they should generally be a more credible source of information than the myriad ties of high-degree states. During the Cold War, for example, the US and the USSR were both high-degree actors, but perceptions of their relative trustworthiness differed sharply. As well, the externalities generated by unclosed triads—particularly the negative externalities—should have a more immediate and salient impact than the more diffuse externalities generated by ties to high-degree states. And if i’s tie to a particular j hub leads, ipso facto, to unclosed {ij, jk} triads, then a triadic closure process, rather than an attachment process, will govern the subsequent formation of ik ties. Thus, while I expect both effects to be significant, the effect of closure should be substantively stronger.
Hypothesis 2. States are more likely to form bilateral agreements with partners who are more active in bilateral agreements (“preferential attachment effect”).
Finally, cooperation between i and j may also depend on similarities and connections between the prospective partner, j, and i’s existing k partners. Consider Figure 3(b). The solid line denotes a bilateral cooperation agreement, while the gray j ↔ k arrow indicates either that k and j share a tie on some other dimension—e.g., a military alliance or geographic border—or that they share a common attribute, such as regime type. Covariate closure effects involve interactions between network ties and exogenous covariates and, in network terms, represent an indirect form of homophily—commonly known by the idiom “birds of a feather flock together” (McPherson, Smith-Lovin, and Cook Reference McPherson, Smith-Lovin and Cook2001; Newman Reference Newman2003a). Homophily is typically conceptualized dyadically, where similarities between i and j increase their probability of direct cooperation (e.g., Maoz Reference Maoz2012). I extend the homophilic principle to third parties, such that similarities and connections between i’s current and potential partners condition i’s network activity.
Covariate closure effects provide an important control relative to the main network effects, particularly triadic closure. Contrary to Hypothesis 1, i may simply favor j partners who are connected to and/or share similarities with its existing k partners, irrespective of whether those j states share bilateral agreements with k. Thus, if the US-Chile trade agreement sets a precedent for Latin American countries, then the US-Chile tie should increase cooperation between the US and Chile's geographic neighbors. Although such a dynamic is distinct from triadic closure, it may be motivated by similar mechanisms. For example, i may view states who share important traits with its current partners as being equally trustworthy and/or equally capable of meeting their institutional obligations, or i may pursue ties to homogeneous clusters of states in order to establish stable reference groups of collaborators. The empirical analysis considers a variety of possible jk connections. In general, covariate closure yields the following expectation:
Hypothesis 3. States are more likely to form bilateral agreements with partners who are similar to and/or connected to their existing partners (“covariate closure effect”).
A possible counterargument to Hypothesis 1 is that because cooperation is risky, states may prefer to reap benefits from indirect ties rather than engaging in triadic closure (cf. Bala and Goyal Reference Bala and Goyal2000). Closure effects should prevail for at least three reasons. First, unlike multilateral agreements, bilateral agreements can be undone by just one state, which increases the risks of free riding; the prospect of negative externalities further increases that risk. Second, gains accrued via indirect ties are qualitatively different than the gains of a direct tie. A given i may benefit from, say, a trade deal between j and k, but any such benefits will differ starkly from the preferential market access of a direct agreement. Third, many agreements—such as those focused on security issues or scientific research—explicitly prohibit signatories from sharing the gains of cooperation with third parties. Overall, then, direct bilateral cooperation, backed by credible information on the preferences of one's partners, remains the most reliable source of gains.
Another potential counterargument is that the proposed network effects—preferential attachment and triadic closure—are contradictory rather than complementary. This possibility originates in the vast literature on network emergent properties, where the respective attachment and closure processes lead to divergent network topologies: in the former case, a “scale-free” network with numerous low-degree nodes and a few very high-degree nodes (Barabási and Albert Reference Barabási and Albert1999), and in the latter case, a highly clustered network (Watts Reference Watts1999; Watts and Strogatz Reference Watts and Strogatz1998). In practice, real-world networks are commonly both scale-free and highly clustered (Newman Reference Newman2003b; Ravasz and Barabási Reference Ravasz and Barabási2003). Indeed, attachment and closure lead to divergent topologies only when the dynamical rules of network growth incorporate one process to the exclusion of the other—as may be the case, for example, in synthetic networks, where network processes reflect fundamental nodal preferences (Klemm and Eguiluz Reference Klemm and Eguiluz2002). In the present analysis, attachment and closure are not preferences but strategies that states use to achieve a much more fundamental interest: maximizing the gains of cooperation while minimizing risks. As strategies directed toward a common goal, the two processes are complementary. The SI nonetheless thoroughly explores the topology of the cooperation network and shows that it is both scale free and nontrivially clustered.
DATA AND METHODOLOGY
Hypothesis testing presents unique problems of data and methodology. Bilateral cooperation agreements are ubiquitous, numbering in the tens of thousands (Rohn Reference Rohn1984). The sheer quantity of agreements, combined with a relative dearth of scholarly inquiry, necessitates careful attention to data collection. At the same time, if bilateral agreements are indeed interdependent, then applying traditional estimation techniques is inappropriate, and alternative methodologies must be employed. This section summarizes the approach to these two dilemmas. The SI contains in-depth discussion of data, coding, and estimation.
Data on Bilateral Cooperation Agreements
Cooperation agreements cover a wide array of issues. To ensure applicability of the analysis to the breadth of international cooperation, I employ Rohn's (Reference Rohn1984) topic codes to locate issue-specific clusters of agreements within broader economic, security, cultural, and environmental categories. Focusing on issues that are both politically salient and strategically relevant, I code agreements in four areas. First, agreements on trade in commodities (Commodity) involve import and export of raw materials, such as metals and agricultural products.Footnote 16 Second, nonalliance military agreements (Military) involve such issues as transfer of classified information, exchange of personnel, stationing of equipment, and collaboration in defense industries.Footnote 17 Third, agreements in the sciences (Sciences) promote research and cultural exchange in science and technology.Footnote 18 Finally, fisheries agreements (Fisheries) involve demarcation of fishing zones, catch quotas, industry regulation, and inspections.Footnote 19 Taken as a whole, these agreements cover cooperation problems across the major fields of international relations. Further, the categories are sufficiently narrow as to generate issue-specific externalities—whether negative or positive—for relevant third parties.
The key impediment to coding bilateral agreements is that, because such agreements are not as closely monitored as their multilateral counterparts, data collection depends largely on country reports. Many countries publish annual lists of agreements, but others wait years or even decades between publications. Network models are highly sensitive to missing data (Kossinets Reference Kossinets2006). To minimize missingness, I restrict the sample to the period from World War II to 1980, for which data on bilateral agreements are most reliable and complete.Footnote 20 This temporal span maximizes data coverage while also focusing the analysis on precisely the period in which bilateral agreements first proliferated. The data are drawn from the World Treaty Index (WTI)—initially published by Rohn (Reference Rohn1984) and later updated by Bommarito, Katz, and Poast (Reference Bommarito, Katz and Poast2012)—and cover all independent states in the international system.Footnote 21 In total, the sample includes 1,709 agreements: 413 in Commodity; 475 in Military; 486 in Sciences; and 335 in Fisheries.
The data must be coded such that empirical analysis can determine the effect of existing bilateral agreements on the creation of new agreements. While bilateral agreements often endure for many years, historical evidence suggests that network effects are strongest within the first few years of a tie's creation. Network pressures led to a Korea-China fisheries agreement in less than a year. Cultural cooperation between the US and USSR emerged within two years of the USSR's other agreements. Even in the case of long-term externalities, such as those generated by regional integration, states respond to the immediate promise of future gains; they need not wait for these gains to materialize. I therefore employ a flexible coding of agreements, yij, such that
 \begin{equation}
y_{ij}= \left\lbrace
\begin{array}{ll}
1 &\quad \mbox{if an agreement between $i$ and $j$ entered} \\
&\qquad \mbox{into force within the past $\tau $ years,} \\
0 &\quad \mbox{otherwise}, \end{array} \right.
\end{equation}
Modeling Network Influences
IR scholars have grown increasingly attuned to the methodological challenges posed by interdependencies in relational data.Footnote 24 The logit and probit models commonly used to analyze binary dyadic data assume that observations of the dependent variable are identically and independently distributed.Footnote 25 When dependencies exist, traditional estimation methods are misspecified and may produce biased estimates.Footnote 26 In response, IR scholars have begun exploring new models for dyadic data, including spatial regression techniques (Franzese and Hays Reference Franzese and Hays2007; Neumayer and Plümper Reference Neumayer and Plümper2010), latent space models (Hoff and Ward Reference Hoff and Ward2004), and strategic interaction specifications (Signorino Reference Signorino1999). By accounting for various dependencies, these approaches improve estimation of exogenous covariates. Because the theory treats dependencies themselves as substantively interesting, the analysis requires a model that allows for estimation of such precise endogenous effects as triadic closure, preferential attachment, and covariate closure. Exponential random graph models (ERGMs)—the workhorse of statistical inference in network analysis (Robins et al. Reference Robins, Pattison, Kalish and Lusher2007)—allow estimation of such effects but are generally limited to cross-sectional analysis.Footnote 27
Ultimately, methodological choices should be motivated by theory. I argue that bilateral agreements constitute a global network, where the structure of that network drives the creation of new agreements. To model this data generating process, I employ a stochastic actor-oriented model (SAOM) of network evolution, which treats the network itself as the dependent variable and models the influences, both endogenous and exogenous, that lead to changes in the network over time.Footnote 28 Those changes are assumed to result from the purposive, utility-maximizing decisions of individual actors, who evaluate their positions in the network and adjust their ties so as to maximize their utility (Snijders Reference Snijders2001, Reference Snijders, Carrington, Scott and Wasserman2005). The SAOM thus presumes individual initiative, which is consistent both with the theory and with strategic-choice approaches to international relations more generally (e.g., Lake and Powell Reference Lake and Powell1999). Because estimation relies upon repeated simulations of a specified model of network evolution, as described below, the approach is methodologically equivalent to employing an agent-based model for purposes of statistical inference (Snijders, van de Bunt, and Steglich Reference Snijders, van de Bunt and Steglich2010, 46). Here, I briefly describe the model.Footnote 29 The SI contains an in-depth discussion.
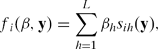
Let Y be an n×n matrix, where the yij elements of Y are defined according to Eq. (1), and i, j = 1, . . . , n. For a given year of data, Y represents the entire bilateral cooperation network, and each yij entry indicates a specific network tie. Since the network is dichotomous, these ties take on values of either zero or one. As well, since cooperation agreements are nondirected, yij = yji. Observing the network at m points in time (e.g., years) yields a time series of network observations, Y(tm). The model assumes that these observations are discrete moments in an unobserved continuous process of network evolution, where the evolution of the network follows a Markov process, such that the structure of the network at tm determines the structure of the network at t m + 1, subject to stochastic error and exogenous covariates (Snijders Reference Snijders, Carrington, Scott and Wasserman2005, 227).Footnote 30 Between moments, the network evolves one tie at a time, as a consequence of individual actors extending and retracting ties. The accumulation of these ties, measured at each observation moment, determines the extent of change or evolution in the network. Explaining change in network structure is thus a matter of identifying those factors that influence actors’ individual choices. The model assumes that, when selecting partners, i maximizes a so-called objective function, fi(β, y), represented as a linear combination of endogenous network influences and exogenous covariates (Snijders Reference Snijders2001, Reference Snijders, Carrington, Scott and Wasserman2005). Formally,
 \begin{equation}
f_i(\beta ,\mathbf {y})= \sum ^{L}_{h=1}\beta _h s_{ih}(\mathbf {y}),
\end{equation}
Because bilateral agreements require mutual consent, the creation of a new tie depends on the objective function as applied to both i and j. Specifically, i proposes a tie to whichever j maximizes fi(β, y), and the tie is created only if it also increases j’s utility.Footnote 31 In principle, actors may maximize the objective function through both creation and termination of ties. However, because the theory emphasizes creation of new agreements and is agnostic about termination, and because tie duration is defined exogenously (see Eq. (1)), the analysis focuses only on the creation of new ties.Footnote 32 Once i and j create a tie, the tie endures as defined by Eq. (1), and the structure of the network changes correspondingly—which in turn determines the probability distribution for creation of subsequent ties for all actors. In the SI, I vary these restrictions.
The model is too complex for direct calculation of probabilities. I instead obtain estimates using method of moments, which determines parameters by minimizing the difference between the observed and expected values of the sih(y) functions. Observed values are given by the data, while expected values—which are unknown ex ante—must be drawn from repeated Markov chain Monte Carlo simulations of the network using randomly sampled values of the β parameters (Snijders Reference Snijders2001). Parameter estimates are given by the vector  $\skew4\hat{\beta }$ that minimizes the absolute difference between the calculated values of the sih(y) statistics in the observed and simulated networks. Convergence is checked by assessing deviations in the simulated network statistics from their targeted or observed values (Ripley, Snijders, and Preciado Reference Ripley, Snijders and Preciado2012). The SI describes this simulation procedure in detail.
By modeling network evolution in continuous time, the SAOM allows inferences to be drawn even from network ties that appear to emerge simultaneously—such as a triad that is null at t 1 but fully closed at t 2. Further, the model treats network ties not as singular events but as indicative of a relatively stable “condition” or “state” with enduring structural effects (Snijders, van de Bunt, and Steglich Reference Snijders, van de Bunt and Steglich2010, 45), which allows us to determine how a given “state” of the network conditions the creation of new network ties—and how tie creation in turn affects the structure of the network. At the same time, because the model shares key characteristics with logistic regression, hypothesis testing is conducted similarly to traditional models, by calculating t-statistics from estimated coefficients and standard errors.
Network Effects and Covariates
Network influences are modeled as sih(y) components of the objective function, as defined in Eq. (2).Footnote 33 The first effect, TriadClosure, which tests Hypothesis 1, is defined for a given i as
 \begin{equation}
s_{i1}(\mathbf{y}) = \displaystyle \sum_{j\lt k}^{n} y_{ij} y_{ik} y_{jk},\quad i \ne j \ne k.
\end{equation}
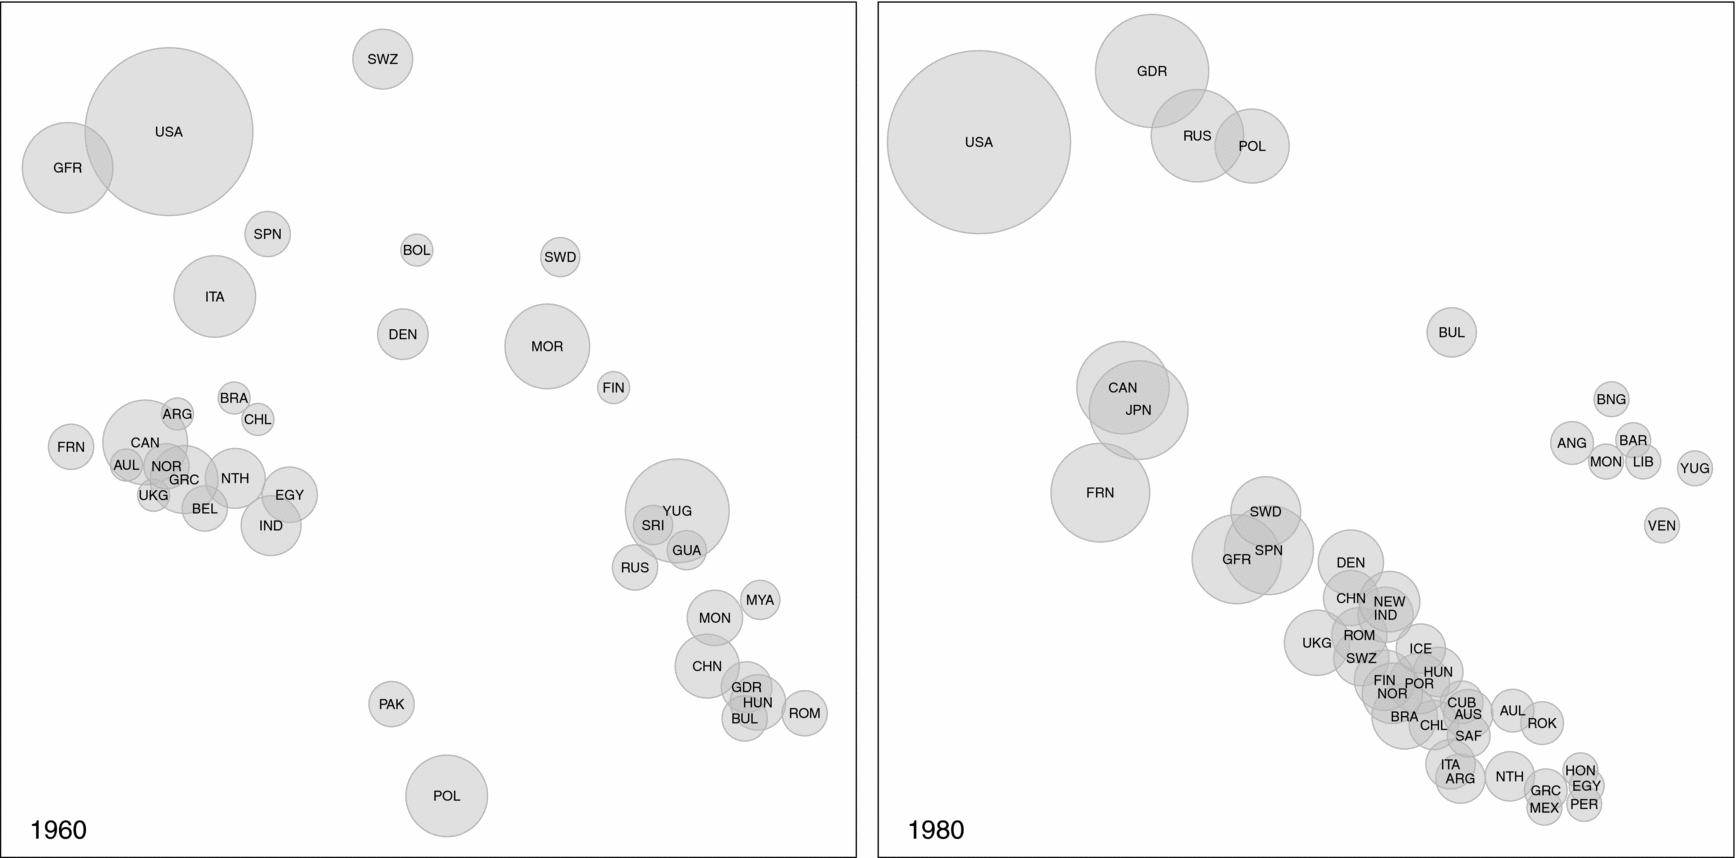
A positive β1 estimate indicates that, in evaluating the network and proposing new agreements, states favor ties that lead to closed triads. Figure 4 maps third-party ties or “2-paths” at two observation moments. For purposes of illustration, the figure shows both fully closed {ik, kj, ij} triads and potentially closable {ik, kj} triads (i.e., where only the direct ij tie is missing). More proximate nodes share more third-party ties with one another than with other nodes (and thus share more “friends of friends” in common), while larger nodes have more third-party ties in general. Bilateral cooperation should be most likely between large, proximate nodes. The graphs reveal an interesting trend. In 1960, bilateral agreements largely reflected Cold War factions, with Western and NATO-bloc states clustered in the upper-left of the graph, and Eastern bloc states clustered on the opposite side. By 1980, the landscape shifted substantially, with the US sharing extensive indirect ties to such ideological adversaries as East Germany (GDR), Poland (POL), and the Soviet Union (RUS). Such a shift should, in turn, improve the odds of direct East-West cooperation.
Third-Party Ties in Bilateral Cooperation Agreements, 1960 and 1980
Note: Based on Agreement coding, τ = 3. Proximity of nodes indicates number of shared 2-paths. Node size indicates each node's total number of 2-paths. Node positions determined by multidimensional scaling with slight jittering to increase readability. Only states with a nodal degree of 2 or greater are shown.
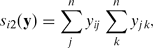
The PrefAttachment effect, defined in terms of j’s degree centrality, is
 \begin{equation}
s_{i2}(\textbf {y}) = \displaystyle \sum _{j}^{n}y_{ij}\sum _{k}^{n}y_{jk},
\end{equation}
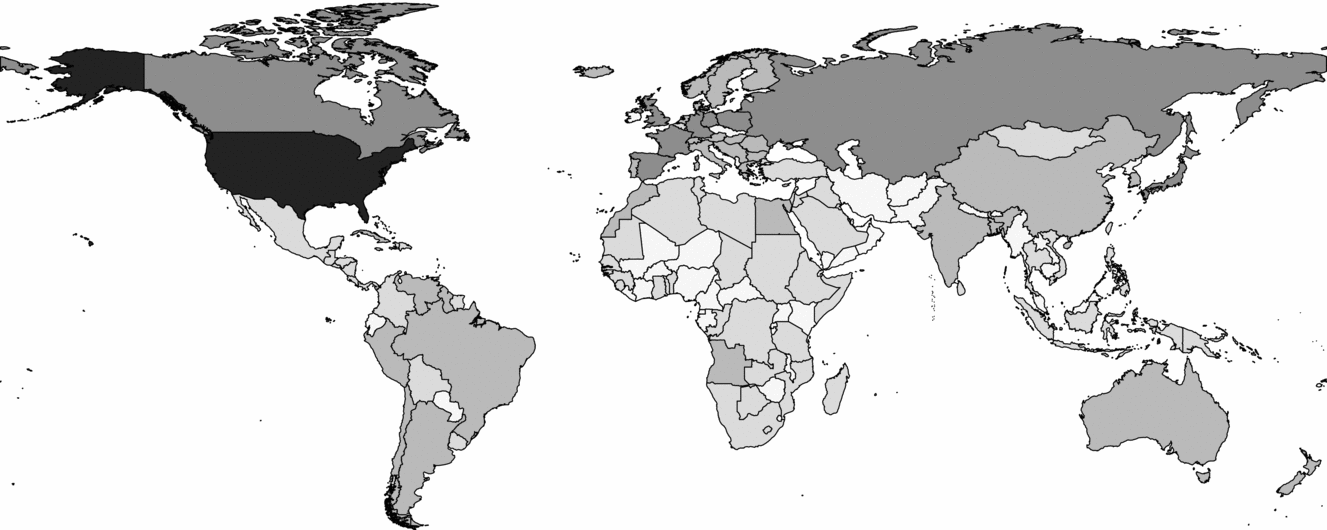
Degree Centrality in Bilateral Cooperation Agreements, 1980
Note: Based on Agreement coding, τ = 3. Darker shading indicates greater degree centrality.
Finally, to test Hypothesis 3, let zjk = zkj represent a bilateral connection or shared characteristic between some prospective partner, j, and some third party, k. Then, the statistic
 \begin{equation}
s_{i3}(\textbf {y}) = \displaystyle \sum_{j\ne k}^{n}y_{ij}y_{ik}z_{jk}
\end{equation}
The model incorporates a standard battery of controls as additional sih(y) components of the objective function. At the dyadic level, I include distance (Gleditsch and Ward Reference Gleditsch and Ward2001), contiguity (Correlates of War Project 2006), shared IGO membership (Pevehouse, Nordstrom, and Warnke Reference Pevehouse, Nordstrom and Warnke2004), trade dependence (Barbieri and Keshk Reference Barbieri and Keshk2012), and military alliances (Leeds et al. Reference Leeds, Ritter, Mitchell and Long2002). I also include three monadic covariates—democracy (Marshall and Jaggers Reference Marshall and Jaggers2002), military capabilities (Singer Reference Singer1987), and per-capita GDP (Gleditsch Reference Gleditsch2002)—and their ij interactions.Footnote 34
EMPIRICAL RESULTS
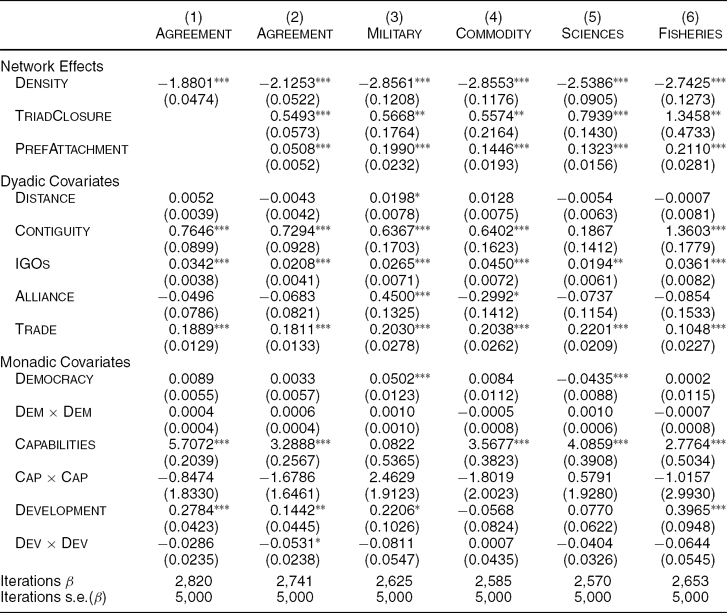
The first network model (see Table 1) uses the aggregate Agreement operationalization and includes only exogenous covariates (as well as a Density effect, which is analogous to a constant).Footnote 35 Similar to multinomial logistic regression, the estimate for a given covariate is the log odds ratio of the respective probabilities that i will choose one particular ij tie over another, given that the only difference between the two ties is a one-unit change in the covariate of interest (Ripley, Snijders, and Preciado Reference Ripley, Snijders and Preciado2012). Exponentiating the estimates yields odds ratios. For example, e 0.7646 = 2.148 indicates that, ceteris paribus, a one-unit increase in Contiguity—indicating a pair of geographically contiguous countries—increases the probability of an ij bilateral agreement by a factor of 2.148, or about 115%. In addition to contiguity, both shared IGO membership and trade dependence encourage bilateral cooperation; increasing the former from the 25th to 75th centile increases the probability of network tie creation by about 40%, while increasing the latter by the same amount increases the probability of tie creation by over 500%. Of the monadic covariates, both military capabilities and economic development unilaterally encourage initiation and confirmation of bilateral agreements; increasing the former from the 25th to 75th centile increases the ceteris paribus probability of cooperation by about 10%, while increasing the latter by the same amount increases the probability by about 60%. Conversely, distance, alliances, democracy, and the monadic interactions have no significant effect.
Network Effects and Creation of Bilateral Cooperation Agreements, 1950–1980
*p < 0.05; **p < 0.01; ***p < 0.001. Standard errors in parentheses. N 1950 = 75; N 1980 = 150. Estimates indicate effect on network tie creation, based on stochastic actor-oriented model of network evolution. Estimation method is simulated method of moments. All t-ratios for deviations from targeted values <0.1 (excellent convergence).
Model 2 incorporates the network effects. Note, first, how the network effects impact the estimates for the covariates; though all remain significant, their magnitude is diminished, dramatically in some cases. This result suggests that the oft-cited influence of power, wealth, and organizations on interstate cooperation is at least partially explained by network dynamics. The network effects themselves are positive and highly significant, confirming Hypotheses 1 and 2. When forming new agreements, states prefer partners who are tied to their current partners and/or tied to more states in general. The substantive impact of these effects can be calculated similarly to the exogenous covariates. For triadic closure, if a prospective ij tie closes one more triad than an alternative tie, then, ceteris paribus, the probability of the former tie being created is greater by e 0.5493 = 1.732. The substantive interpretation of Figure 2, then, is that i is about 73% more likely to propose an agreement with j 4 than with any other j. And because ties are symmetric, j 4’s probability of confirming that proposition is also 73% greater. In practice, states may share 5, 10, or even 20 partners in common. Ceteris paribus, sharing ties to just five k third parties increases a given ij dyad's probability of cooperation nearly 15 times over. The estimates also show that a one-unit increase in PrefAttachment increases the probability of an agreement by e 0.0508 = 1.052, or a little over 5%. As expected, this effect is smaller than for triadic closure. Consider a hypothetical scenario where some potential target, j, increases its network ties by one. If that new tie extends to a k state that does not have a tie to i, then the relative increase in the probability of an ij tie is only 5%. If, however, that k third party also has a tie to i, then the probability of an ij tie increases by an additional 73%. Nonetheless, for high-degree states the impact of preferential attachment can be powerful. In Figure 5, Japan has a degree score of 16, while China has a degree score of only 5; ceteris paribus, a state with an 11-point advantage in degree centrality is about 75% more likely to initiate and/or confirm new ties. Importantly, these closure and attachment effects are due entirely to countries’ respective positions within the network. They are not artifacts of wealth, power, regime type, geographic location, trade dependence, or any other exogenous covariate.
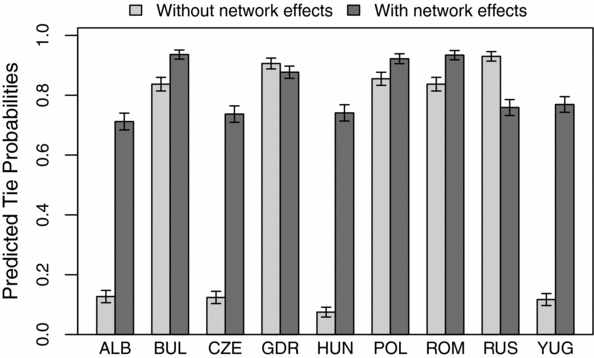
To explore the substantive importance of these results, I employ out-of-sample prediction.Footnote 36 First, in order to concretely connect network influences to prevailing expectations of who is most likely to cooperate with whom, I examine the specific case of US relations with Eastern-bloc states in the waning days of the Cold War. Using parameter estimates from Models 1 and 2, I repeatedly simulate the evolution of the 1980 network and, based on the frequency with which specific yij ties appear in the simulated networks, derive predicted tied probabilities for subsequent, unobserved years. As shown in Figure 6, when the model includes only exogenous covariates (light gray bars), the predicted probabilities of cooperation between the US and specific targets vary substantially; the model anticipates cooperation between the US and large targets like East Germany and the USSR but severely underestimates the cooperative potential of smaller states like Albania, Czechoslovakia, Hungary, and Yugoslavia. Incorporating network influences (dark gray bars) increases the predicted probability of cooperation for all targets to at least 70%. Though we lack sufficient data to formally validate these predictions, the model nonetheless accurately forecasts an improvement in relations between the US and the Eastern Bloc over the course of the 1980s.
Predicted Bilateral Cooperation between US and Eastern Bloc, 1980
Note: Bars show predicted probability of US proposing a bilateral cooperation agreement with specific targets. Based on 1,000 simulations of 1980 network, using parameter estimates from Models 1 and 2. Intervals are 95% confidence intervals.
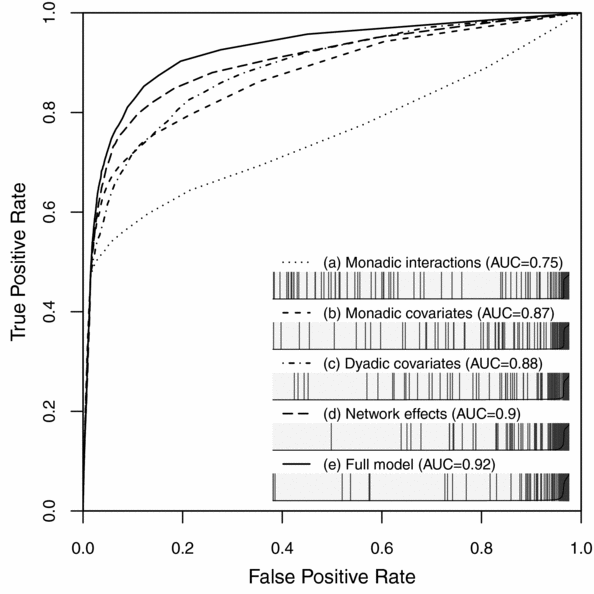
Next, to gauge the explanatory power of the network effects relative to exogenous covariates, I conduct rolling out-of-sample prediction for the full 1950–1980 period. This analysis involves, first, estimating a model on a five-year moving window of network observations (i.e., the training set); second, using the derived parameter estimates to predict agreements in the subsequent unmodeled observation moment (i.e., the validation set); and third, comparing these predictions to the observed creation of network ties.Footnote 37Figure 7 illustrates the results using receiver operating characteristic (ROC) curves, which assess a predictor's performance by comparing false positive and true positive rates across various predicted probability thresholds.Footnote 38 A larger area under the curve (AUC) indicates greater accuracy. Specifying separate models for network effects and the various categories of covariates allows direct comparisons of the predictive power of each. The goal is to determine whether network influences are better able to predict creation of new agreements than are traditional exogenous influences. Model (d) is the model of interest. This specification includes only the TriadClosure and PrefAttachment effects and excludes all monadic and dyadic covariates. In short, this model attempts to predict new ties purely on the basis of endogenous network dynamics. Impressively, it yields a larger AUC (0.9) than any specification other than the full model. Network dynamics offer greater predictive power than any given combination of covariates. The embedded separation plots confirm this result. In a separation plot, vertical lines represent observed network ties, and the plotted area itself represents a probability spectrum, with the predicted probability of a tie being lowest on the left of the plot and highest on the right (Greenhill, Ward, and Sacks Reference Greenhill, Ward and Sacks2011). Compared to other specifications, Model (d) locates a greater proportion of observed ties to the right of the plot, where their predicted probability is highest. This result is especially impressive considering that the network specification adds only two additional terms to the model (in addition to Density), while the monadic models add three each and the dyadic model adds five. The network specification is both more parsimonious and more accurate.
Prediction of Newly Created Ties, 1950–1980
Note: ROC plot shows true/false positive rates across various predicted probability thresholds. AUCs closer to 1 indicate better performance. Embedded separation plots show observed newly created agreements as vertical lines and predicted probabilities as a continuum from left (lowest) to right (highest). For clarity, separation plots based on 25,000 randomly sampled predictions.
Models 3–6 disaggregate the Agreement coding into the four constituent categories. While the network effects vary in strength across issue areas, they are always positive and highly significant. Exponentiating the parameter estimates for TriadClosure reveals that, ceteris paribus, adding just one additional third-party tie increases the probability of cooperation in military agreements by 76%; in commodity agreements by 75%; in science agreements by 121%; and in fisheries agreements by nearly 300%. Similarly, a one-unit increase in PrefAttachment increases the probability of cooperation in military agreements by 22%; in commodity agreements by 16%; in science agreements by 14%; and in fisheries agreements by 23%. The exogenous covariates, on the other hand, are volatile. Geographic contiguity has no effect on cooperation in science agreements but is significantly positive in the remaining three categories. Alliances increase cooperation in military agreements but have little effect elsewhere. Democracy also encourages military cooperation, but discourages creation of science agreements. Military capabilities encourage cooperation in all areas except, interestingly, military agreements. And economic development increases cooperation in fisheries agreements, weakly increases cooperation in military agreements, and is insignificant elsewhere. Only two covariates, trade dependence and shared IGO membership, are significantly positive across all areas. While these four issue areas represent key areas of bilateral cooperation, they are by no means exhaustive. Rohn (Reference Rohn1984) identified over 90 distinct categories. Many of these contain too few agreements to obtain reliable network estimates, and others involve issues, such as humanitarian aid, that are highly asymmetric or do not exhibit traditional cooperation problems. Nonetheless, the SI shows that the influence of triadic closure and preferential attachment extends to agreements on taxation and fiscal evasion, patents and copyrights, air and water transport, mass media, postal services, telecommunications, cultural and artistic exchange, and numerous others.
Finally, Hypothesis 3 argues for an interaction between third-party agreements and exogenous covariates. To measure this effect, illustrated in Figure 3(b) and formally defined in Eq. (5), I incorporate the dyadic covariates as zjk = zkj third-party ties. For the monadic covariates, I calculate dyadic similarity scores for k and j’s regime type, military capabilities, and per-capita GDP.Footnote 39 I then specify seven separate covariate closure models for each of the four issue areas, plus the Agreement coding, for a total of 35 separate estimations. In order to focus on the quantities of interest and avoid multicollinearity, each model includes only network effects, the covariate closure effect, and a dyadic control for the relevant covariate. The goal is to determine whether having connections to i’s current k partners (e.g., via military alliances or trade ties) and/or sharing similarities with those k partners (e.g., in regime type or military power) makes a potential j partner more likely to be targeted by i for cooperation.
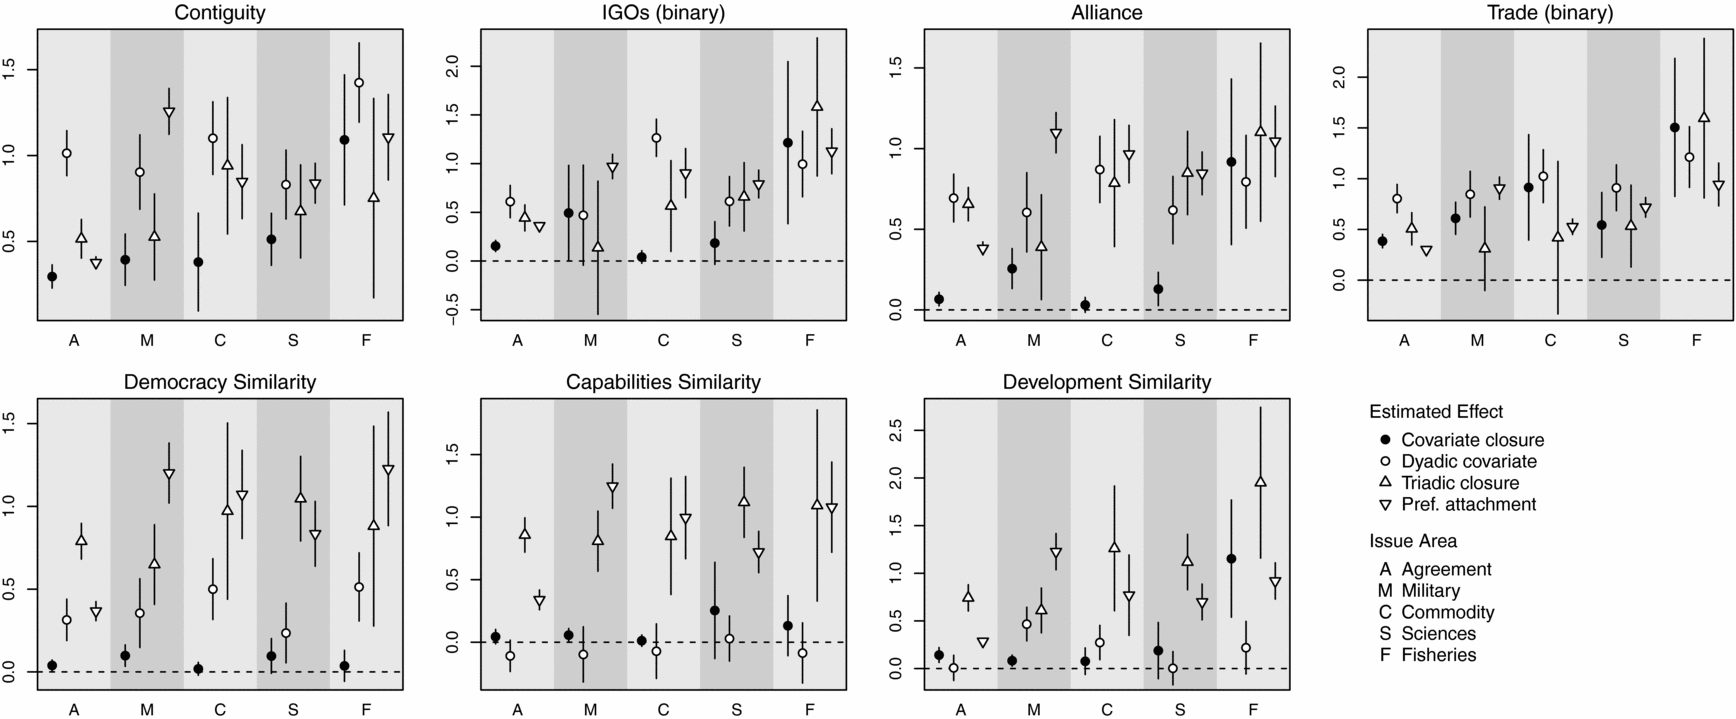
Figure 8 lists estimates from the 35 covariate closure models. Unsurprisingly, the effect of covariate closure (shown by the solid circles) is generally substantively weaker than the direct dyadic effect of the covariate (the hollow circles). Nonetheless, covariate closure can be powerful. In particular, closure in geographic contiguity and trade dependence are both significantly positive across all issue areas. Ceteris paribus, states are more likely to select j partners who are geographically proximate to their existing k partners, by anywhere from 46% (in commodity agreements) to 197% (in fisheries agreements). The effect of closure in trade dependence is even stronger, increasing the probability of dyadic cooperation by anywhere from 70% to 350%. Of the remaining dyadic covariates, closure in alliances is significant in all but commodity agreements, while closure in IGOs is significant only in fisheries. Importantly, these effects depend entirely on connections between i’s current k partners and the prospective j partner, not on connections between i and j directly. Effects for closure in monadic similarity are weaker. Similarity in economic development encourages ij closure only in military and fisheries agreements, while similarity in either regime type or military capabilities encourages closure only in military agreements. Overall, then, the data reveal strong evidence of closure in geography and trade, but mixed results for the remaining covariates. Just as importantly, the primary network effects are extremely robust across model specifications. With only a few exceptions—e.g., in military and commodity agreements, closure in trade dependence overwhelms triadic closure—the estimates for both TriadClosure and PrefAttachment are consistently positive and significant, confirming that network effects are indeed substantively influential and not epiphenomenal to other types of third-party ties.
Effect of Covariate Closure across Issue Areas, 1950–1980
Note: Each panel shows results for a specific covariate. Each shaded area represents a separate model in a specific issue area. Symbols are point estimates. Lines are 95% confidence intervals. To improve readability, estimates for TriadClosure are rescaled by a factor of 0.5 in fisheries agreements, and estimates for PrefAttachment are rescaled by a factor of 10 in all issue areas.
DISCUSSION
IR scholars have long viewed international cooperation as an endogenously fueled process. This analysis puts endogenous influences in the spotlight, treating them not as methodological nuisances but as phenomena of substantive importance. Interdependencies do not emerge ex nihilo but are the result of distinct social processes. They warrant theoretical and empirical inquiry. The logics of information and externalities mechanisms provide a basic framework for understanding bilateral interdependencies. While these mechanisms may vary in intensity from one issue area to the next—and in some cases, they may be overshadowed by other, more issue-specific mechanisms—their theoretical breadth ensures applicability to a broad spectrum of cooperation problems. Across issue areas, network influences are among the most consistent and powerful determinants of bilateral cooperation. Ignoring network influences may even lead to erroneous inferences. The differences between Models 1 and 2, for example, indicate that such oft-cited influences as IGOs, military power, and economic development diminish in substantive significance once network influences enter the equation. Similarly, the example of US relations with Eastern-bloc states reveals that, even for very specific contexts, omitting network effects dramatically changes our expectations of when, where, and with whom cooperation is most likely to occur. Indeed, out-of-sample prediction suggests that if analysts wish to assess prospects for international cooperation, they will likely glean more insight—and more predictive power—from the structure of the network itself than from exogenous covariates.
More generally, the analysis provides insights into three enduring, interrelated puzzles. The first and most fundamental puzzle centers on the question of how states overcome collaboration and coordination dilemmas and engage in meaningful cooperation. I propose a hitherto ignored possibility: cooperation agreements endogenously affect coordination and collaboration by conveying strategic information and generating externalities. The argument is probabilistic; network ties increase the probability of certain forms of bilateral cooperation, but by no means do they fully eradicate cooperation problems. Rather, states that might otherwise lack credible information or material incentives can utilize extra-dyadic agreements as stepping stones to their own cooperative endeavors. This proposition is consistent with the long tradition in IR theory of treating international relations as a complex system of interdependent actors; indeed, it is controversial only if we make the highly unrealistic assumption that states—and the leaders within them—are perpetually oblivious to one another's activities.
The analysis also addresses the puzzle of why cooperation varies so dramatically across states. Naturally, due to exogenous conditions, some states converge more in their preferences than others, which in turn affects their opportunities for mutual gains and willingness to achieve gains through cooperation. Yet, the model shows that geography, IGOs, trade, power, and other exogenous conditions only partially explain variations in cooperation. A more enduring explanation is that some states simply share more bilateral agreements with politically relevant third parties. They cooperate more because their partners cooperate more, and their partners’ ties endogenously affect their own costs and benefits for cooperation. These influences have largely been ignored in IR scholarship, but they promise new avenues for exploration of regional integration, regime complexes, global governance, and a host of other phenomena.
A third puzzle concerns the recent macrolevel trend toward greater bilateralism. A key benefit of network models is that they explicitly and inextricably connect microlevel actions to macrolevel outcomes (and vice versa). The structure of international cooperation is both a cause and consequence of individual decision-making. Much like contagion and diffusion processes in democratization, investment, and elsewhere (e.g., Elkins, Guzman, and Simmons Reference Elkins, Guzman and Simmons2006; Gleditsch and Ward Reference Gleditsch and Ward2006), the growth of bilateralism is endogenously spurred by the increased presence of bilateral agreements. As bilateral ties increase, the potential for network influences also increases. By providing states with greater avenues for addressing informational asymmetries and gaps in gains, each additional network tie incentivizes further ties. The microlevel implication of this trend is that any random ij dyad should find more opportunities for cooperation as the number of system-wide ties increases. And at the macrolevel, as individual dyads draw upon existing ties to forge new cooperative endeavors, the overall density of ties in the international system increases correspondingly—as evidenced by the post-World War II growth in bilateralism.
Interdependence is the natural condition of world politics. Network analysis offers an especially valuable means of theoretically specifying and empirically measuring these interdependencies. It is by no means the only approach, but it has the great benefit of comporting well with long-standing intuitions about the structure of the international system. The conclusion that network influences reverberate throughout processes of international cooperation complements growing evidence of network effects in international conflict (Ward, Siverson, and Cao Reference Ward, Siverson and Cao2007), military alliances (Cranmer, Desmarais, and Menninga Reference Cranmer, Desmarais and Menninga2012; Warren Reference Warren2010), economic policies (Cao Reference Cao2009), diplomatic representation (Kinne Reference Kinne2014), and elsewhere. The question, then, is not whether networks matter in international politics, but how and why they matter.
Supplementary materials
To view supplementary material for this article, please visit http://dx.doi.org/10.1017/S0003055413000440




Comments
No Comments have been published for this article.