Introduction
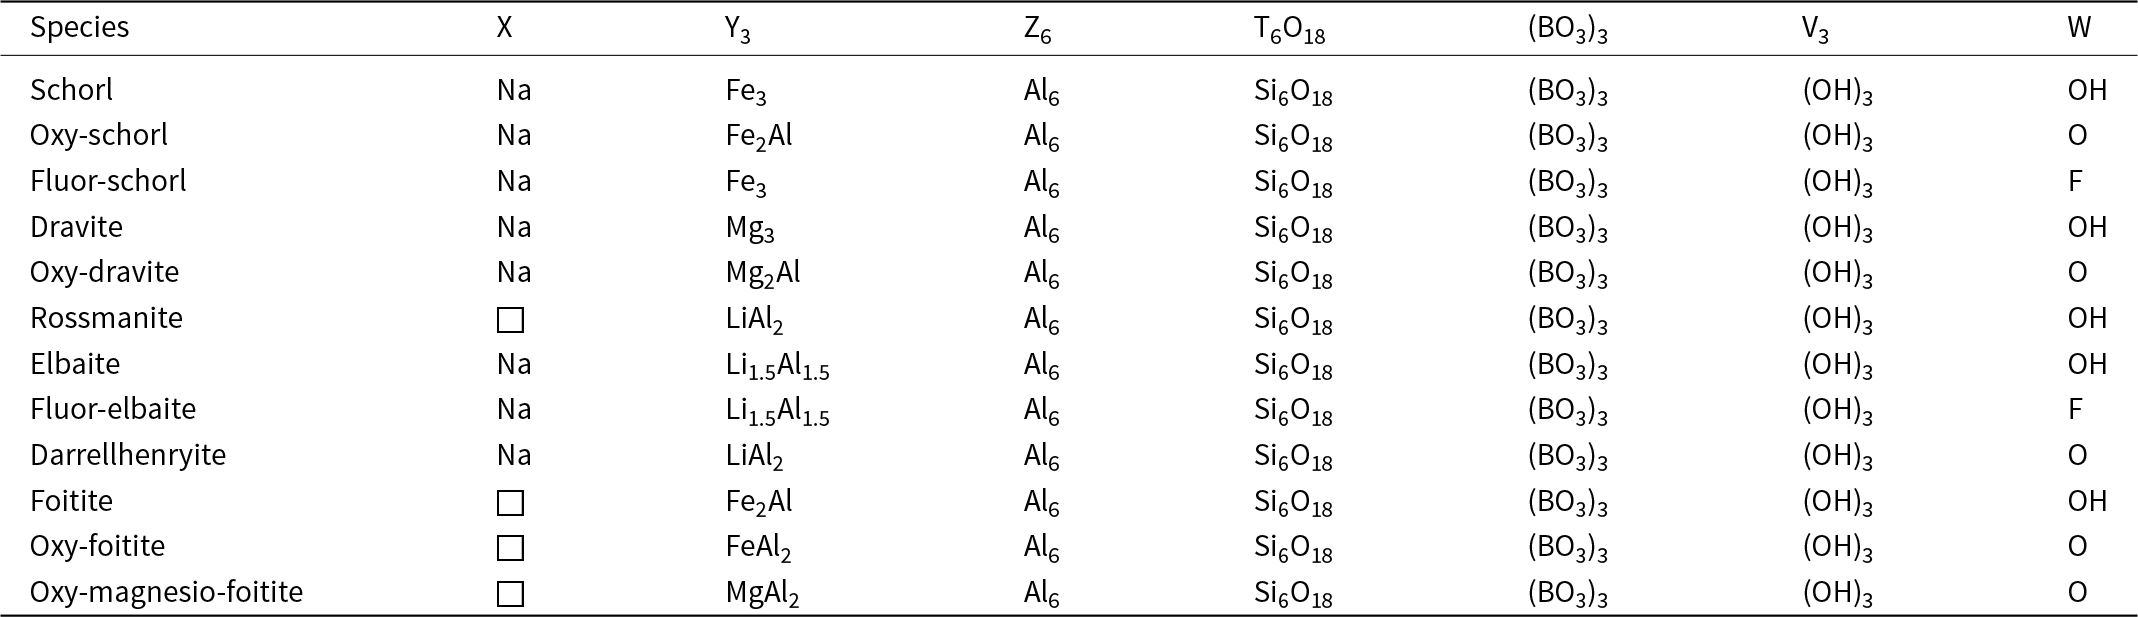
The complex chemical and structural properties of tourmaline allow it to record the changing geochemical signatures of its host environment. (Henry and Dutrow, Reference Henry and Dutrow1996; van Hinsberg et al., Reference van Hinsberg, Schumacher, Kearns, Mason and Franz2006, Reference van Hinsberg, Henry and Dutrow2011a, Reference van Hinsberg, Henry and Marschall2011b; Hawthorne and Dirlam, Reference Hawthorne and Dirlam2011; Dutrow and Henry, Reference Dutrow and Henry2011; Bačík et al., Reference Bačík, Š and Uher2011). The tourmaline supergroup has a generalised structural formula of XY3Z6(T6O18)(BO3)3V3W where X = Na+, Ca2+, K+, vacancy (□); Y = Fe2+, Mg2+, Mn2+, Al3+, Li+, Fe3+, Cr3+; Z = Al3+, Fe3+, Mg2+, Cr3+; T = Si4+, Al3+, B3+; B = B3+; V = OH–, O2– and W = OH–, F–, O2– (Henry et al., Reference Henry, Novák, Hawthorne, Ertl, Dutrow, Uher and Pezzotta2011). X, Y, Z, T and B represent groups of cations present at the [9]X, [6]Y, [6]Z, [4]T and [3]B sites, or anions at the V and W sites, respectively. Tourmaline primary groups are classified on the basis of the dominant occupancy at the X-site as alkali, calcic, or vacancy group. A general series of tourmaline species is classified on the basis of the dominant occupancy at the W-site i.e. hydroxy-, fluor- or oxy-tourmalines.
Tourmaline has a wide pressure, temperature and compositional stability range, permitting its growth over a range of crustal environments (Marschall et al., Reference Marschall, Korsakov, Luvizotto, Nasdala and Ludwig2009; van Hinsberg et al., Reference van Hinsberg, Henry and Marschall2011b; Dutrow and Henry, Reference Dutrow and Henry2011; Bačík et al., Reference Bačík, Ozdín, Uher and Chovan2022; Henry et al., Reference Henry, Zappettini and Dutrow2022). Due to limited volume diffusion, tourmaline retains the chemical signatures of its formation environment through weathering, transport, burial, uplift and (re)metamorphism (Henry and Guidotti, Reference Henry and Guidotti1985; van Hinsberg et al., Reference van Hinsberg, Henry and Dutrow2011a, Reference van Hinsberg, Henry and Marschall2011b).
Tourmaline is sensitive to fluid-phase interactions, making it a useful tool for tracking the evolution of fluid-chemical systems. Tourmaline stability depends on the composition of the coexisting fluid and is particularly pH dependent (von Goerne et al., Reference von Goerne, Franz and Robert1999; Dutrow et al., Reference Dutrow, Foster and Henry1999; van Hinsberg et al., Reference van Hinsberg, Henry and Marschall2011b; Dutrow and Henry, Reference Dutrow and Henry2016). Boron is a fluid-mobile element essential for tourmaline formation. In aqueous fluids, boron is coordinated triangularly in neutral-to-acidic fluids, equivalent to the 3-coordinated B-site in tourmaline; and is predominantly 4-coordinated in alkaline aqueous fluids (Henry and Dutrow, Reference Henry and Dutrow1996). In alkaline fluids, the boron tetrahedral coordination inhibits tourmaline nucleation such that fluids can cause dissolution of pre-existing tourmaline (e.g. von Goerne et al., Reference von Goerne, Franz and Robert1999; Dutrow and Henry, Reference Dutrow and Henry2000, Reference Dutrow and Henry2018). When tourmaline encounters a fluid of differing chemistry, sourced externally or internally, re-equilibration reactions can occur (Dutrow et al., Reference Dutrow, Foster and Henry1999; Dutrow and Henry, Reference Dutrow and Henry2000; Putnis, Reference Putnis2009). These reactions consist of: (1) the dissolution of the pre-existing solid phase which is out of equilibrium with the fluid; and (2) subsequent reprecipitation of a new stable solid phase, in equilibrium with, and reflective of, the evolving fluid composition (Dutrow and Henry, Reference Dutrow and Henry2000; Ruiz-Agudo et al., Reference Ruiz-Agudo, Putnis and Putnis2014). Tourmaline can record multiple generations of growth and dissolution of compositionally distinct domains, even in a single fibre (Dutrow and Henry, Reference Dutrow and Henry2000). Therefore, tourmaline can be used as a valuable indicator and chemical monitor of fluid-phase interactions. This study investigates the growth, dissolution and replacement of multiple generations of tourmaline from the Dorothy China Clay Pit in Cornwall, UK to provide insights on the fluid–mineral reactions associated with the extensive hydrothermal alteration and kaolinisation of its host environment. In addition, this work contributes to the study of the geological history of Cornwall and the formation of the St. Austell granite-hosted kaolinite deposits.
Previous work
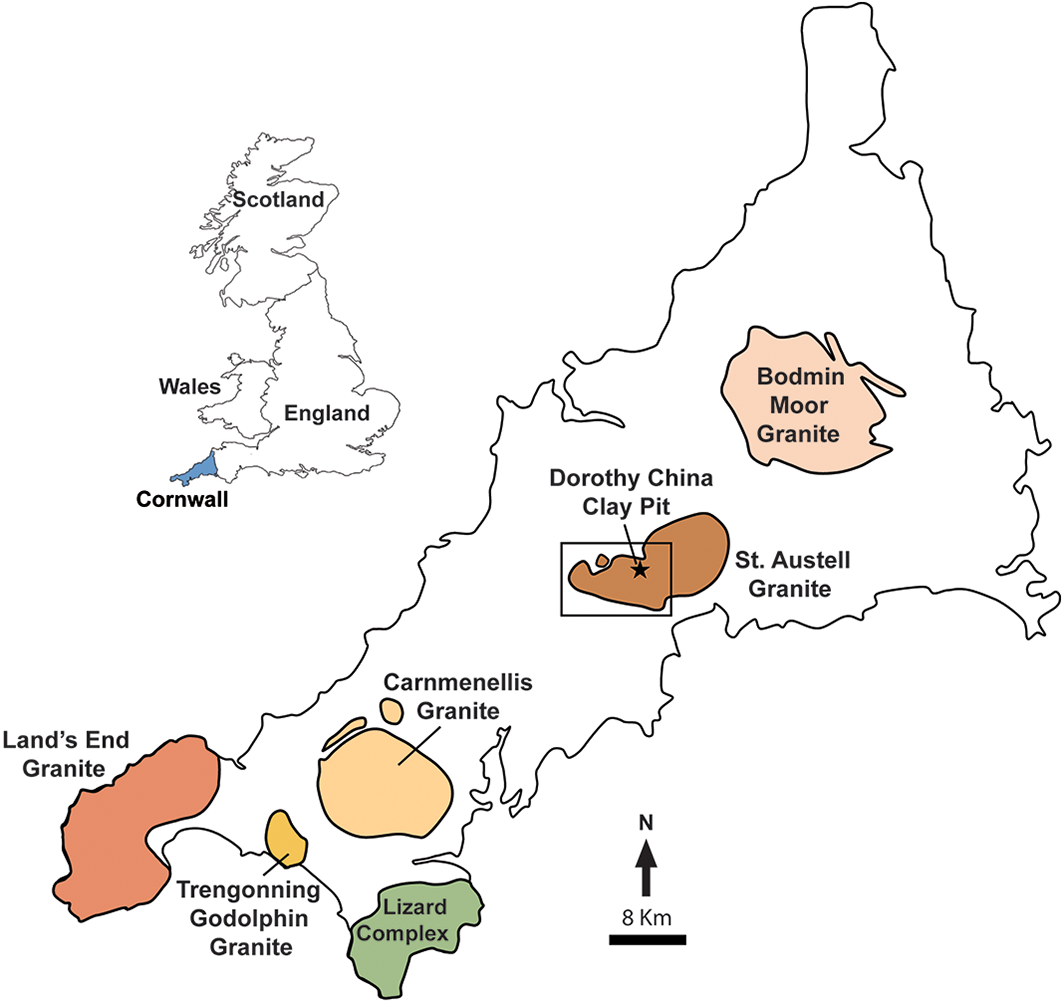
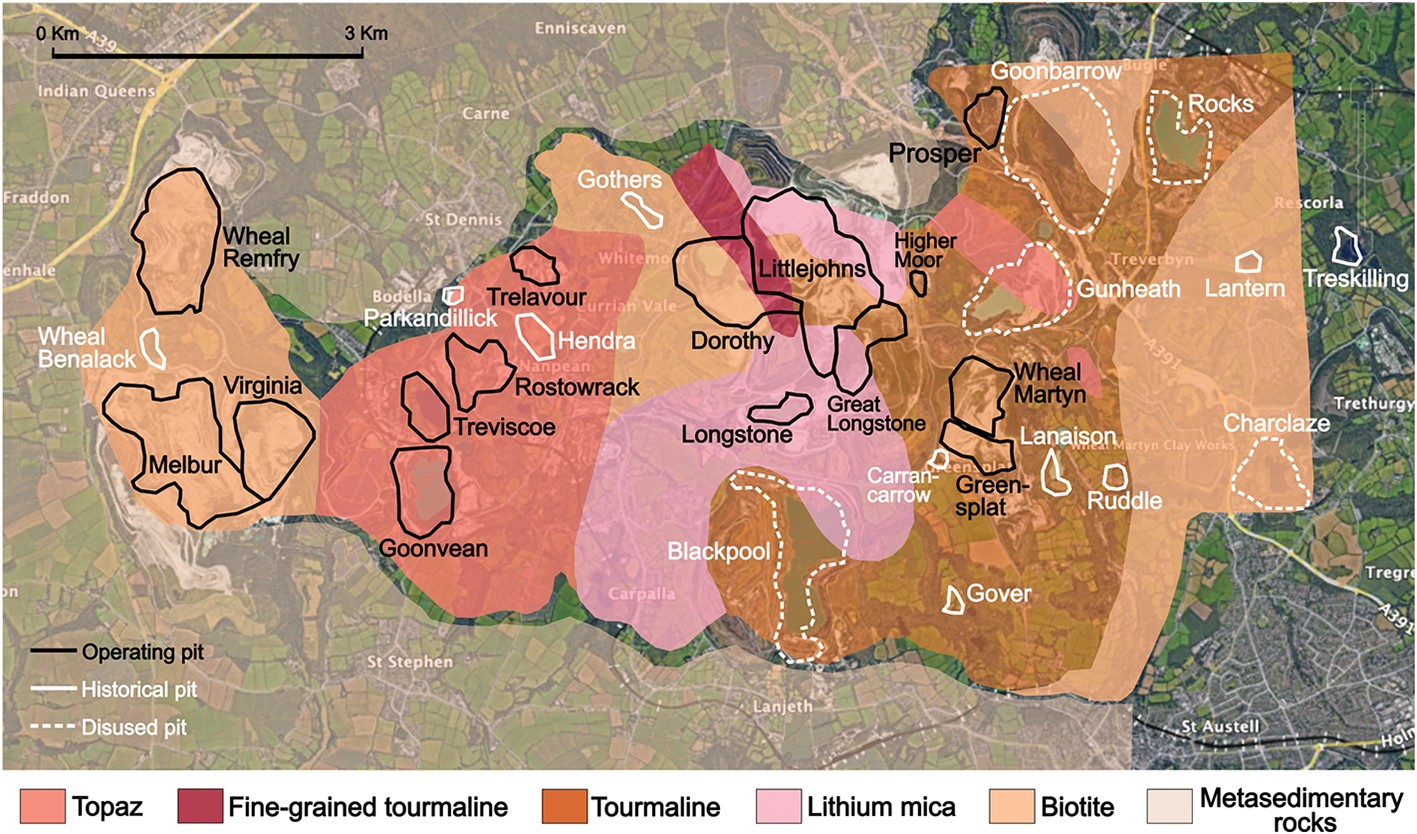
The St. Austell Granite, located on the peninsula of Cornwall, UK, is one of the five main outcrops of granitic rocks (Fig. 1) connected to the well-studied Late Carboniferous Cornubian batholith (London and Manning, Reference London and Manning1995). Much of the St. Austell Granite is completely kaolinised. Thus, it has served as a major resource for the United Kingdom’s China Clay (kaolinite) mining and production since its discovery in 1746, with peak production occurring in 1988 (Bray and Spooner, Reference Bray and Spooner1983; Wilson, Reference Wilson2003). Psyrillos et al. (Reference Psyrillos, Manning and Burley1998) described four distinct episodes of mineralisation which occurred after the consolidation of the St. Austell pluton. The youngest of these events is the extensive kaolinisation of host granites, resulting in large-scale alteration of feldspar and mica to kaolinite (Psyrillos et al., Reference Psyrillos, Manning and Burley1998) with a significant decrease in concentration of major elements such as Na (98% loss), Fe (59% loss), F (56% loss) and Mg (27% loss) from the kaolinised granites compared to their unaltered equivalents (Bray and Spooner, Reference Bray and Spooner1983). These altered granites are abundant throughout the St. Austell pluton and serve as the locations for Cornwall’s many China Clay pits (Fig. 2).
Schematic map of the peninsula of Cornwall, and its location within the UK. Major granite outcrops of the Cornubian batholith are labelled, in addition to the Lizard Complex, an exposed ophiolite. The star marks the approximate location of the Dorothy China Clay Pit within the St. Austell Granite. The box marks the area represented in Fig. 2. Cornwall map modified after London and Manning (Reference London and Manning1995). UK map modified after original (Natural England Open Access).

Schematic map of the St. Austell granite outcrop, Cornwall, UK. Coloured shading shows the distribution of different granitic lithologies and the outlines show existing, historical and disused China Clay pits. Base layer map data: Google, ©2022–2024 Airbus. Map overlay modified from the original, R. Shail (2023, pers. comm.).

Although the relative timing is known, the direct cause and geochemical conditions of the St. Austell Granite’s kaolinisation are debated. The two main hypotheses for the formation of the St. Austell kaolin deposits are: (1) weathering of the host granite under a sub tropical climate; and (2) hydrothermal alteration by late-stage magmatic fluids associated with mineralisation (Psyrillos et al., Reference Psyrillos, Manning and Burley1998). Generally, the dissolution of feldspar occurs in hydrous, acidic conditions, leaching the alkalis and producing silica and kaolinite (Henderson, Reference Henderson1982). A third, combined model argues that the kaolinite deposits formed from both late-stage hydrothermal alteration and weathering (Alderton and Rankin, Reference Alderton and Rankin1983; Psyrillos et al., Reference Psyrillos, Howe, Manning and Burley1999). The presence of tourmaline in these deposits presents a complementary method to evaluate the hydrothermal alteration hypothesis.
Tourmaline within the St. Austell Granite
The St. Austell Granite hosts a variety of tourmaline contained within veins, granitic pegmatites, and surrounding metamorphosed country rock (e.g. London and Manning, Reference London and Manning1995; Manning et al., Reference Manning, Hill and Howe1996; Duchoslav et al., Reference Duchoslav, Marks, Drost, McCammon, Marschall, Wenzel and Markl2017). All major granite lithologies (Fig. 2) contain tourmaline as either a major or minor phase, and its composition, habit and modal abundance varies with its host granite mineralogy and alteration history (Manning et al., Reference Manning, Hill and Howe1996). A general increase in both Al and Fe/(Fe+Mg) in tourmaline occurs through the sequence of biotite granite, tourmaline granite facies, lithium mica granite and topaz granite (see Fig. 2 for locations; Manning et al., Reference Manning, Hill and Howe1996). Tourmaline from the St. Austell Granite and surrounding country rock commonly displays fine-scale oscillatory zoning and a variety of habits, ranging from granular to acicular (London and Manning, Reference London and Manning1995; Duchoslav et al., Reference Duchoslav, Marks, Drost, McCammon, Marschall, Wenzel and Markl2017). Tourmaline found in the biotite and tourmaline granites is rich in the alkali component (0.6–0.75 atoms per formula unit Na+K), low in Ca (<0.07 apfu) and shows little to no zoning (Duchoslav et al., Reference Duchoslav, Marks, Drost, McCammon, Marschall, Wenzel and Markl2017). In hydrothermally altered granites and pegmatites, the tourmaline observed are Li-poor, Fe-rich, rich in the alkali component (0.4–0.9 apfu), Ca-poor (0.05 apfu), display oscillatory zoning and span the fluor-, oxy- and hydroxy-subgroups (Duchoslav et al., Reference Duchoslav, Marks, Drost, McCammon, Marschall, Wenzel and Markl2017). In most granitic rocks, magmatic tourmaline displays little to no compositional zonation and is rich in Y-site Al (0.6–1 apfu) across all lithologies (London and Manning, Reference London and Manning1995). In contrast, hydrothermal tourmaline in veins and breccias is characterised by extensive compositional variation and complex zoning patterns (London and Manning, Reference London and Manning1995; Duchoslav et al., Reference Duchoslav, Marks, Drost, McCammon, Marschall, Wenzel and Markl2017). The varied compositions and textures observed in tourmaline reflect growth in closed-system magmatic, open-system hydrothermal, and transitional environments.
Tourmaline is commonly found in kaolinite deposits (London and Manning, Reference London and Manning1995; Mueller et al., Reference Mueller, Scott and Evans1999). Extensive kaolinisation produces granites with tourmaline as the dominant Fe–Mg-bearing phase instead of biotite (Manning et al., Reference Manning, Hill and Howe1996), in part because tourmaline is chemically resistant and stable in acidic fluids. Due to its ability to record multiple fluid events, tourmaline from the St. Austell Granite can be used to reconstruct the evolving geochemical conditions present at the time of growth to subsequent modification by periods of fluid interactions.
Analytical methods
To acquire textural and chemical information on the investigated material, imaging and in situ compositional data were obtained. The Keyence VHX-7100 Digital Microscope was employed to produce a full thin section scan used to geolocate individual minerals and analytical data points. Modal percentages of phases present were estimated visually. Back-scattered electron (BSE) images characterise textural features and provide basemaps for precise locations of analytical points. Additional minerals in the sample were identified using energy-dispersive X-ray spectrometry (EDS) on the Electron Probe Microanalyser (EPMA). Compositional analyses of tourmaline were carried out using the JEOL JXA-8230 EPMA in the Chevron Geomaterials Characterization Laboratory at Louisiana State University, USA. Conditions for analyses were a 15 kV accelerating potential and a 20 nA beam current with a 1–2 μm beam diameter. Tourmaline was analysed quantitatively for F, Na, Mg, Al, Si, K, Ca, Ti, V, Mn, Fe, Cu, Zn, Sr, Nb, Sn, W and Pb, with Na counted first. Counting times for major elements were 20 seconds on the peak and 10 seconds on the background. For minor and trace elements (Ti, Zn, Mn, Nb, Sr, W, Sn, K and F), counting times were 30–80 seconds on the peak and 15–40 seconds on the background. Well-characterised synthetic and natural mineral samples were used as primary standards, including fluorite (F), albite (Na), olivine (Mg), andalusite (Al), diopside (Si, Ca), sanidine (K), rutile (Ti), V-diopside glass (V), rhodonite (Mn), almandine (Fe), chalcopyrite (Cu), willemite (Zn), celestine (Sr), synthetic SrBaNb4O10 (Nb), cassiterite (Sn), ferberite (W) and galena (Pb). Secondary standards of well-characterised tourmaline samples were used to monitor machine drift and ensure quality of analytical data. On the basis of replicate analyses of several secondary standards, analytical precision associated with counting statistics for selected oxides is estimated to be ± 0.21% for SiO2, ± 0.13% for Al2O3, ± 0.06% for FeO, ± 0.11% for MgO, ± 0.03% for MnO, ± 0.02% for CaO, ± 0.03% for Na2O, ± 0.03% for K2O, ± 0.03% for ZnO, ± 0.03% for TiO2 and ± 0.02% for F. Minimum detection limits in wt.% are considered to be 0.022 for F, 0.014 for Na2O, 0.027 for MgO, 0.041 for Al2O3, 0.026 for SiO2, 0.013 for K2O, 0.016 for CaO, 0.02 for TiO2, 0.014 for MnO and FeO, 0.0077 for ZnO, 0.012 for Nb2O5, 0.011 for SrO and V2O3 and 0.015 for SnO2.
Five grains of tourmaline were analysed in a single thin section (BM-1980.169); 27 analytical points were taken on grain one, 47 points on grain two, 23 points on grain three, 17 points on grain four and a 275-point traverse along grain five. Tourmaline structural formulae were normalised on the basis of 15 (YZT) cations (Henry et al., Reference Henry, Novák, Hawthorne, Ertl, Dutrow, Uher and Pezzotta2011) with B calculated iteratively to equal 3 B apfu. Y-site lithium was estimated using the empirical procedure outlined by Pesquera et al. (Reference Pesquera, Gil-Crespo, Torres-Ruiz, Torres-Ruiz and Roda-Robles2016). The concentration of Nafluid (mol/L) is based on data from Von Goerne et al. (Reference von Goerne, Franz and Heinrich2001) by extrapolating to temperatures lower than experimental conditions (Dutrow and Henry, Reference Dutrow and Henry2016, Reference Dutrow and Henry2018). The concentration of Lifluid (ppmw) is based on fluid–mineral partitioning data from van Hinsberg et al. (Reference van Hinsberg, Franz and Wood2017); although these data are for pressure–temperature conditions higher than those in this study, these data serve as a reference for changes in fluid concentrations.
Results
Sample description
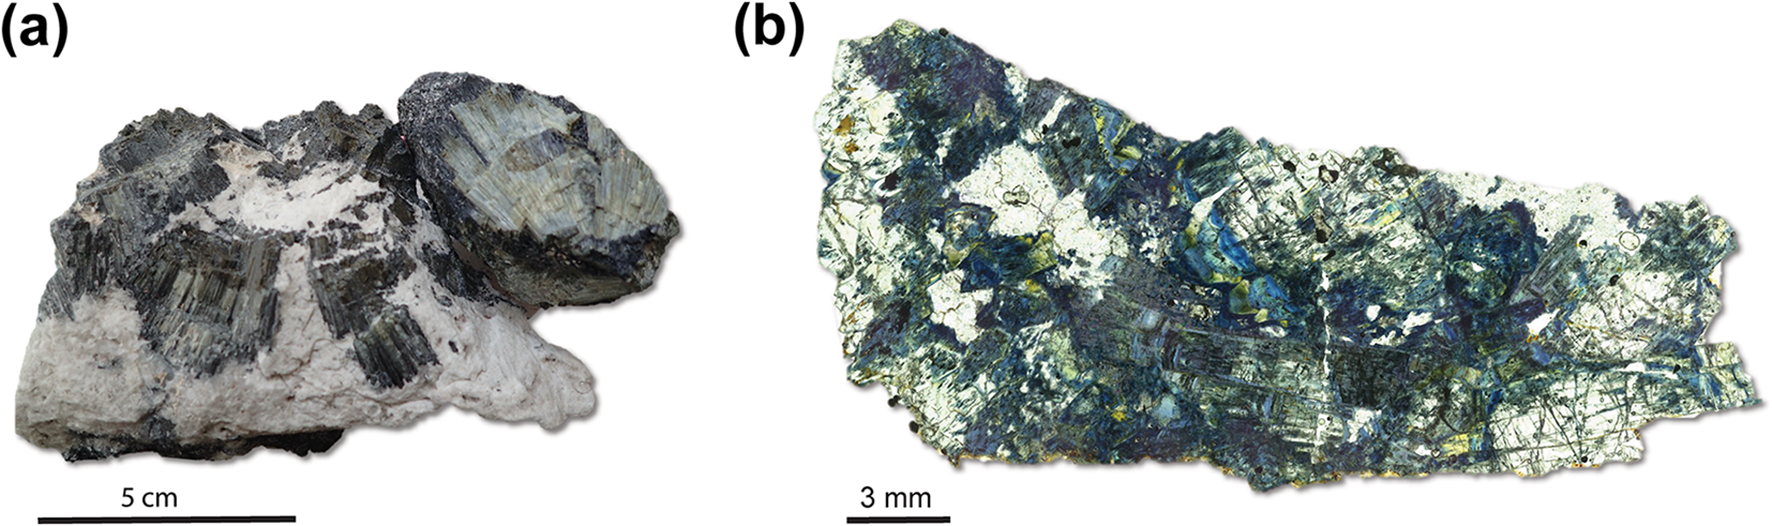
The study sample, BM-1980.169, collected from the Dorothy China Clay Pit in 1980, was made from a small offcut taken from a larger specimen (Fig. 3), donated by the Natural History Museum, London. The offcut sample is composed of blue–grey tourmaline (85%) within a fine-grained grey quartz (15%) matrix. Tourmaline crystal size ranges from 1 mm to 2 cm. Grains express variable pleochroism, from colourless to light blue, blue grey to ochre and light to dark blue. Individual crystal habit ranges from blocky to acicular, orientated both parallel and perpendicular to the apparent c axis. Trace minerals identified using EDS analysis include cassiterite [SnO2], goyazite [SrAl3(PO4)(PO3OH)(OH)6], columbite–tantalite-(Fe) [(Fe,Mn)Nb2O6–(Fe,Mn)Ta2O6] and partially altered muscovite. Accessory minerals are consistent with those reported previously (Manning et al., Reference Manning, Hill and Howe1996).
Sample BM-1980.169: (a) original hand sample from which an off-cut was made displaying tourmaline (large, dark crystals) in a fine-grained matrix; and (b) full thin section optical scan in plane-polarised light (PPL).

Tourmaline textures
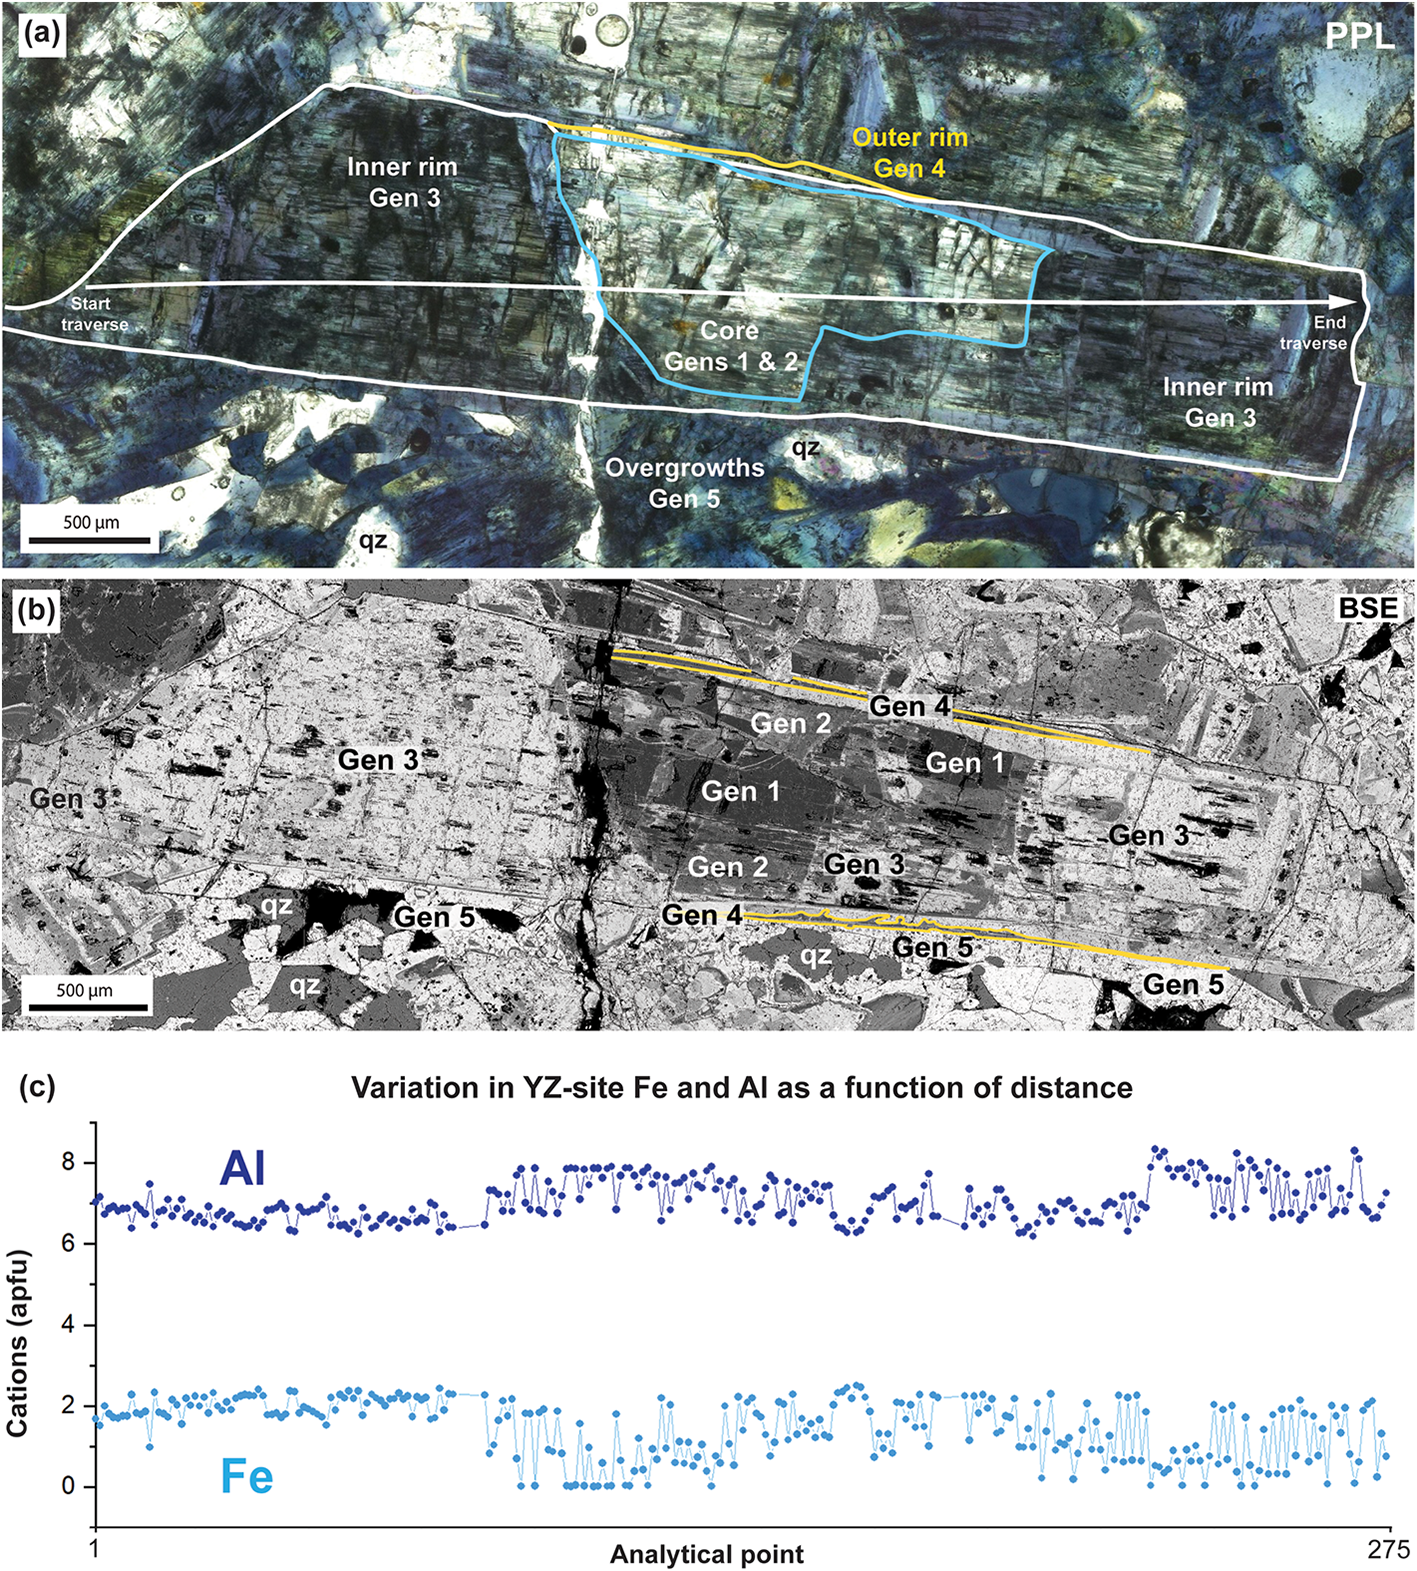
The sample investigated contains a 6.1 mm long tourmaline crystal orientated with the apparent c axis in the plane of the thin section (Fig. 4). Optically (Fig. 4a), the grain displays irregular but distinct colour zoning from core to rim. At maximum absorption, the core is pale blue to nearly colourless, the inner rim surrounding the core is blue grey and the thin outermost rim is pale blue to yellow. The grain boundaries of the large crystal are adjacent to growths of anhedral dark blue to ochre tourmaline in the quartz matrix.
A 6.1 mm long single tourmaline crystal within sample BM-1980.169: (a) In PPL Generations (Gen) are outlined and labelled: the core in blue; the inner rim in white; and the thin outermost rim in yellow. The analytical traverse is marked by the white line. (b) BSE-image, with differences in grey scale highlighting the generations of tourmaline and the replacement of the quartz (qz) matrix. Generation 4 is outlined in yellow showing partial replacement of generation 3. (c) Analytical traverse showing variation in total Fe (Fe2+and Fe3+) and Al as a function of distance across the grain. The partial inverse relationship indicates that some of the Fe is Fe3+.

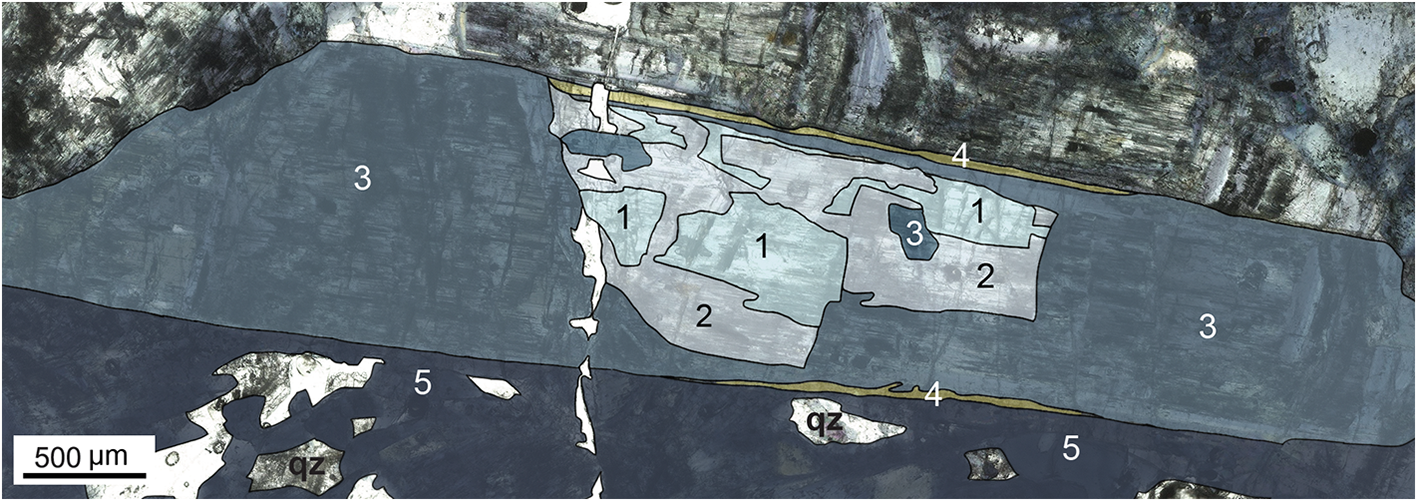
In the BSE image, at least five distinct generations of tourmaline are identified within the single grain, based primarily on textural relationships with irregular boundaries marked by dissolution (or replacement) features. These data are combined with compositional data to establish the different generations of the tourmaline (Fig. 4b). In BSE images, the core is the darkest grey generation 1, which is partially replaced by the lighter grey generation 2 tourmaline. The light grey generation 3 tourmaline partially replaces generations 1 and 2, composing the inner rim of the grain. Generation 4 tourmaline forms the thin, dark grey outer rim partially replacing generation 3. The lightest grey generation 5 tourmaline surrounds the grain, partially replacing generation 4 and the quartz matrix.
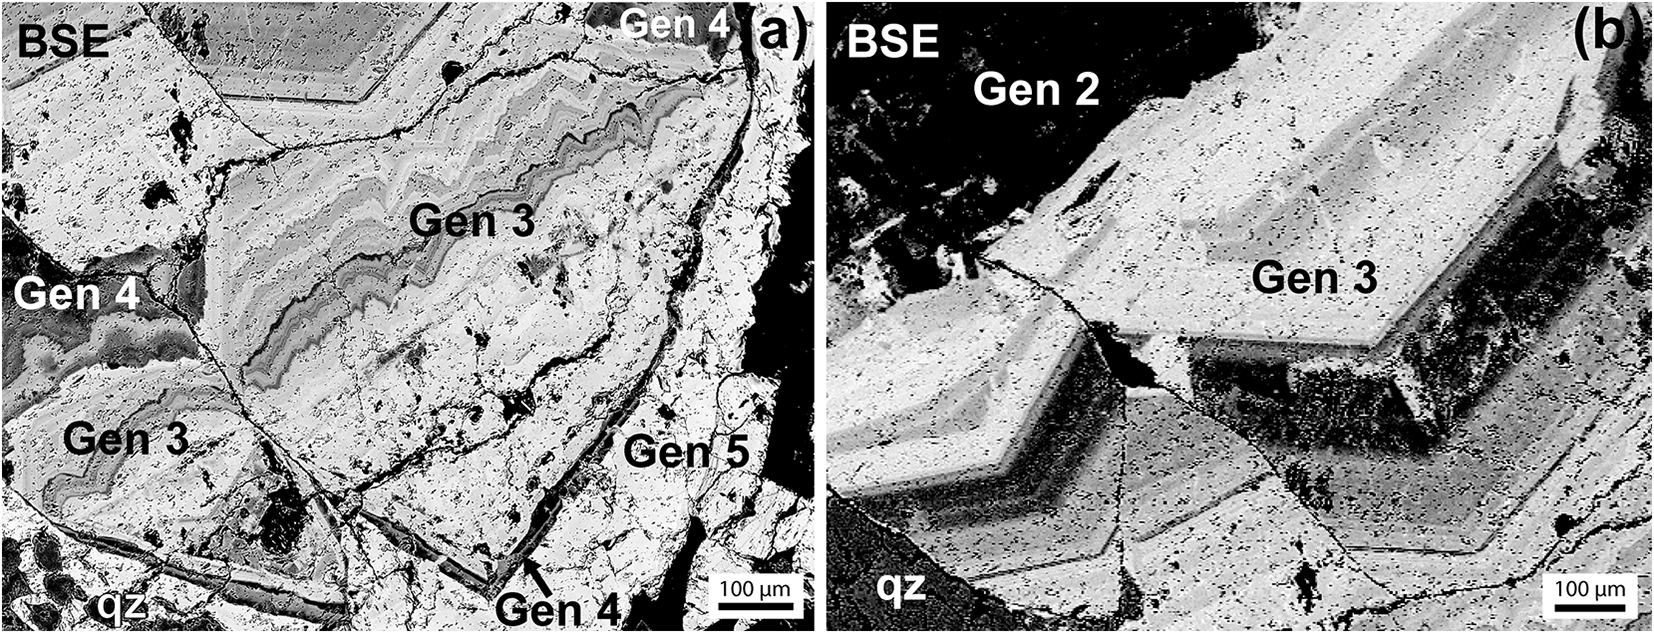
These complex zoning patterns, non-uniform grain boundaries and replacement textures defining each generation of tourmaline are observed in grains throughout the sample. Generation 3 tourmaline is the most texturally complex, displaying ‘scalloped’ (Fig. 5a) and oscillatory (Fig. 5b) zoning patterns. The top left portion of the grain (Fig. 5a) displays oscillatory zoning, but transitions to a ‘scalloped’ pattern characterised by non-linear fine-scale growth bands. Grains with distinct oscillatory zoning also contain areas of small overgrowths (Fig. 5b). Generation 4 can be seen as the thin rim surrounding generation 3, and generation 5 is observed partially replacing both generation 4 and the quartz matrix resulting in non-uniform grain boundaries (Fig. 5a).
BSE images of sample BM-1980.169 highlighting the complex textures and zoning patterns of generations 2, 3, 4 and 5. (a) Fine-scale oscillatory and ‘scalloped’ zoning patterns present in generation 3 fluor-schorl. Generation 3 is bounded and partially replaced by the darker generation 4. Generation 5 surrounds the grain and partially replaces generation 4 and the quartz matrix. (b) Oscillatory zoning and patchy overgrowths observed in generation 3 fluor-schorl. Generation 3 partially replaces generation 2. The variations in BSE-brightness of the zones in generation 3 fluor-schorl is due to small variations in Ti (0.003–0.04 apfu) and large variations in iron reported as Fe2+ (1.13–2.12 apfu).

Tourmaline composition
The BSE-image (Fig. 4b) highlights compositional changes and textural features in the single grain from rim-to-rim. To characterise such compositional heterogeneity, a traverse of 275 analytical points was taken lengthwise across the grain (Fig. 4a). Each texturally distinguished generation has a distinct compositional range. The core of the grain (generations 1 and 2) is composed of tourmaline richer in Li and Al, and poorer in Na, consistent with the darkest BSE signature. This core is surrounded by overgrowths of tourmaline (generation 3) richer in Fe and Na, and poorer in Al. The thin outermost rim of the grain (generation 4) is richer in Mg and poorer in Fe. The overgrowths surrounding the grain (generation 5) are richer in Fe and Na. The analytical results show a pronounced correlation in total Fe and Al at the Y- and Z-sites when plotted as a function of distance along the grain (Fig. 4c; see also Supplementary data).
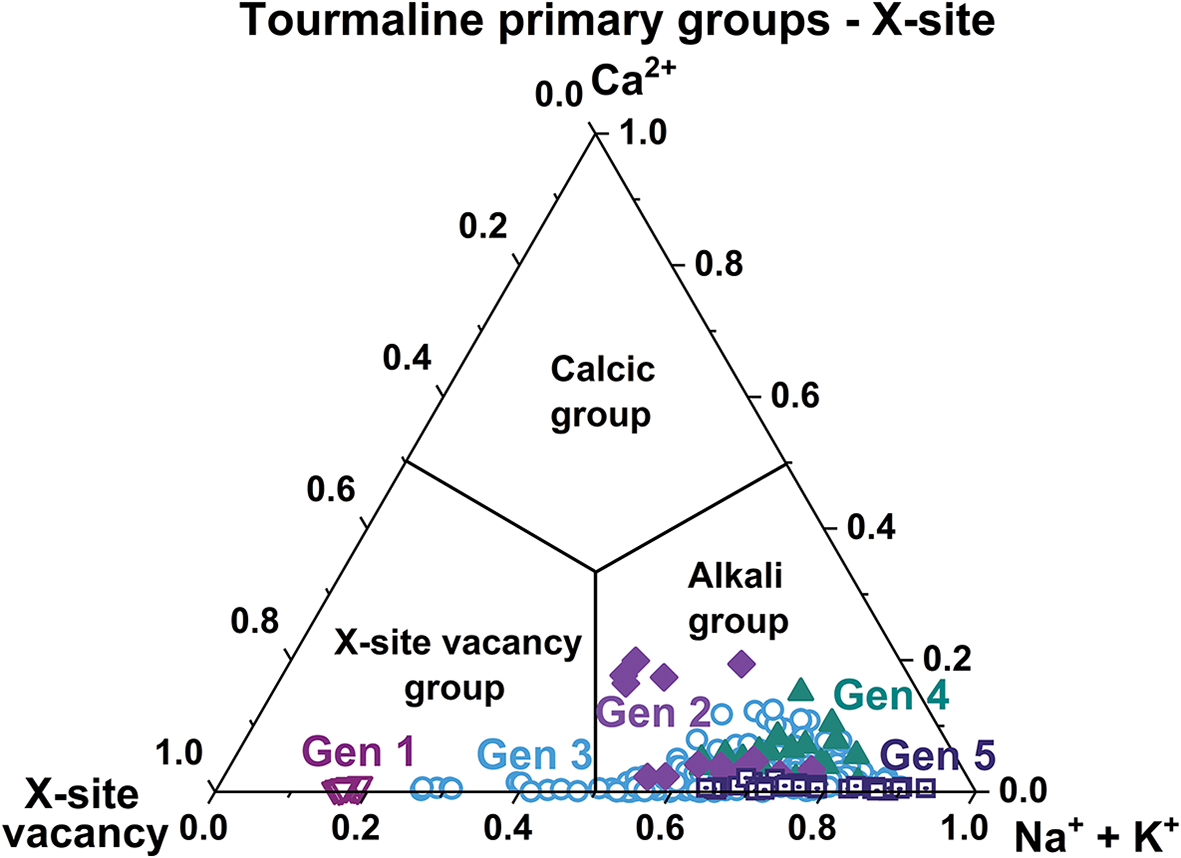
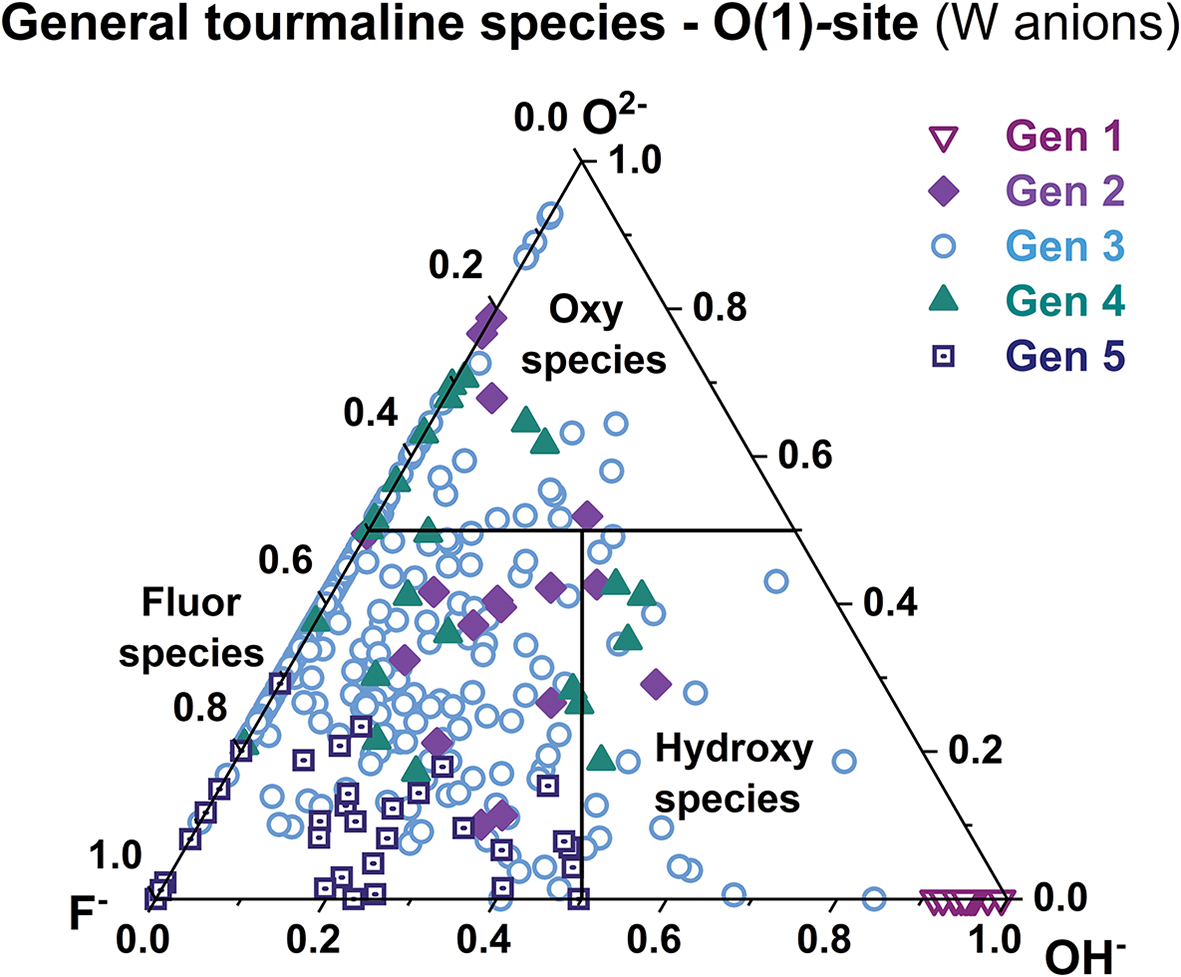
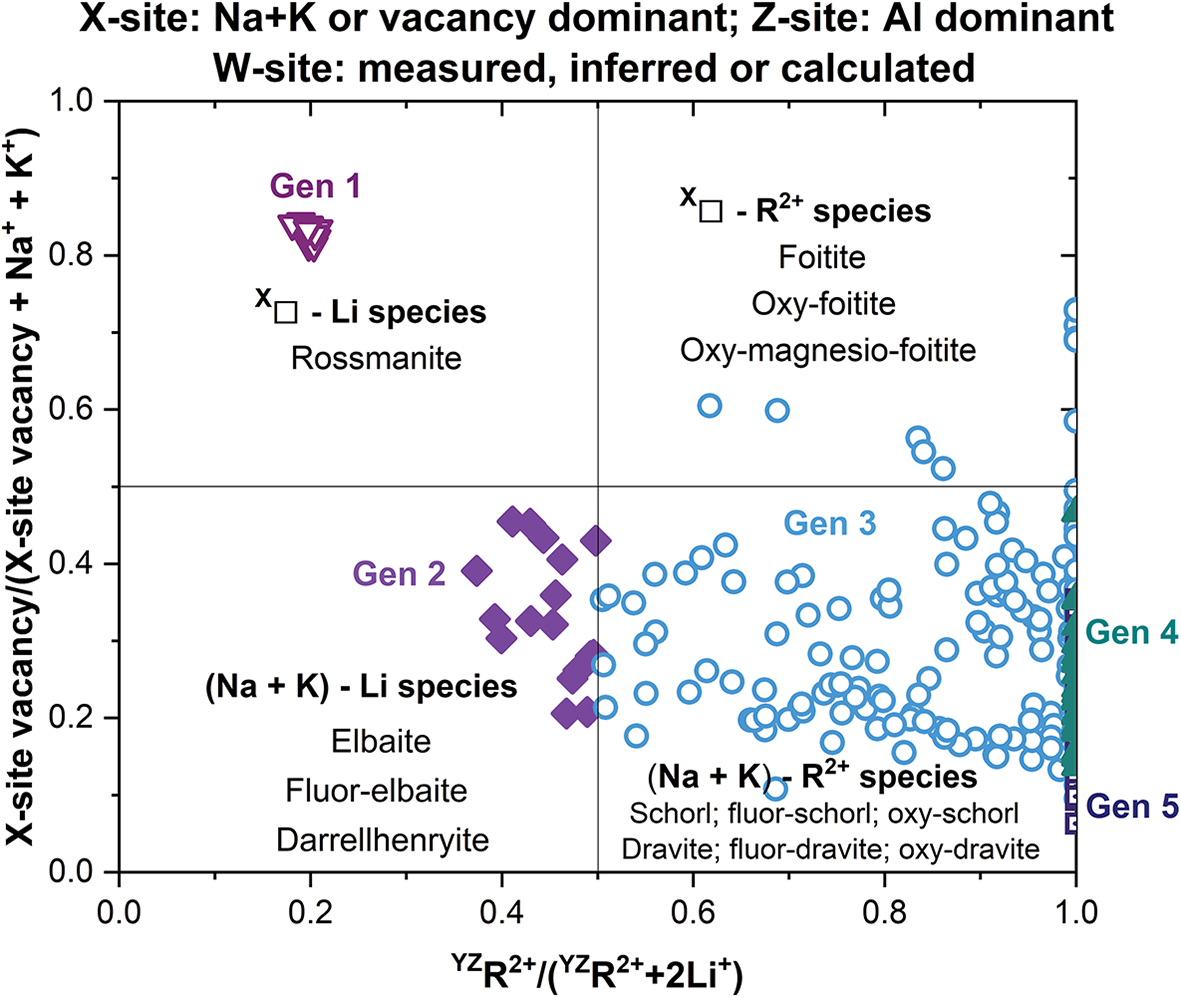
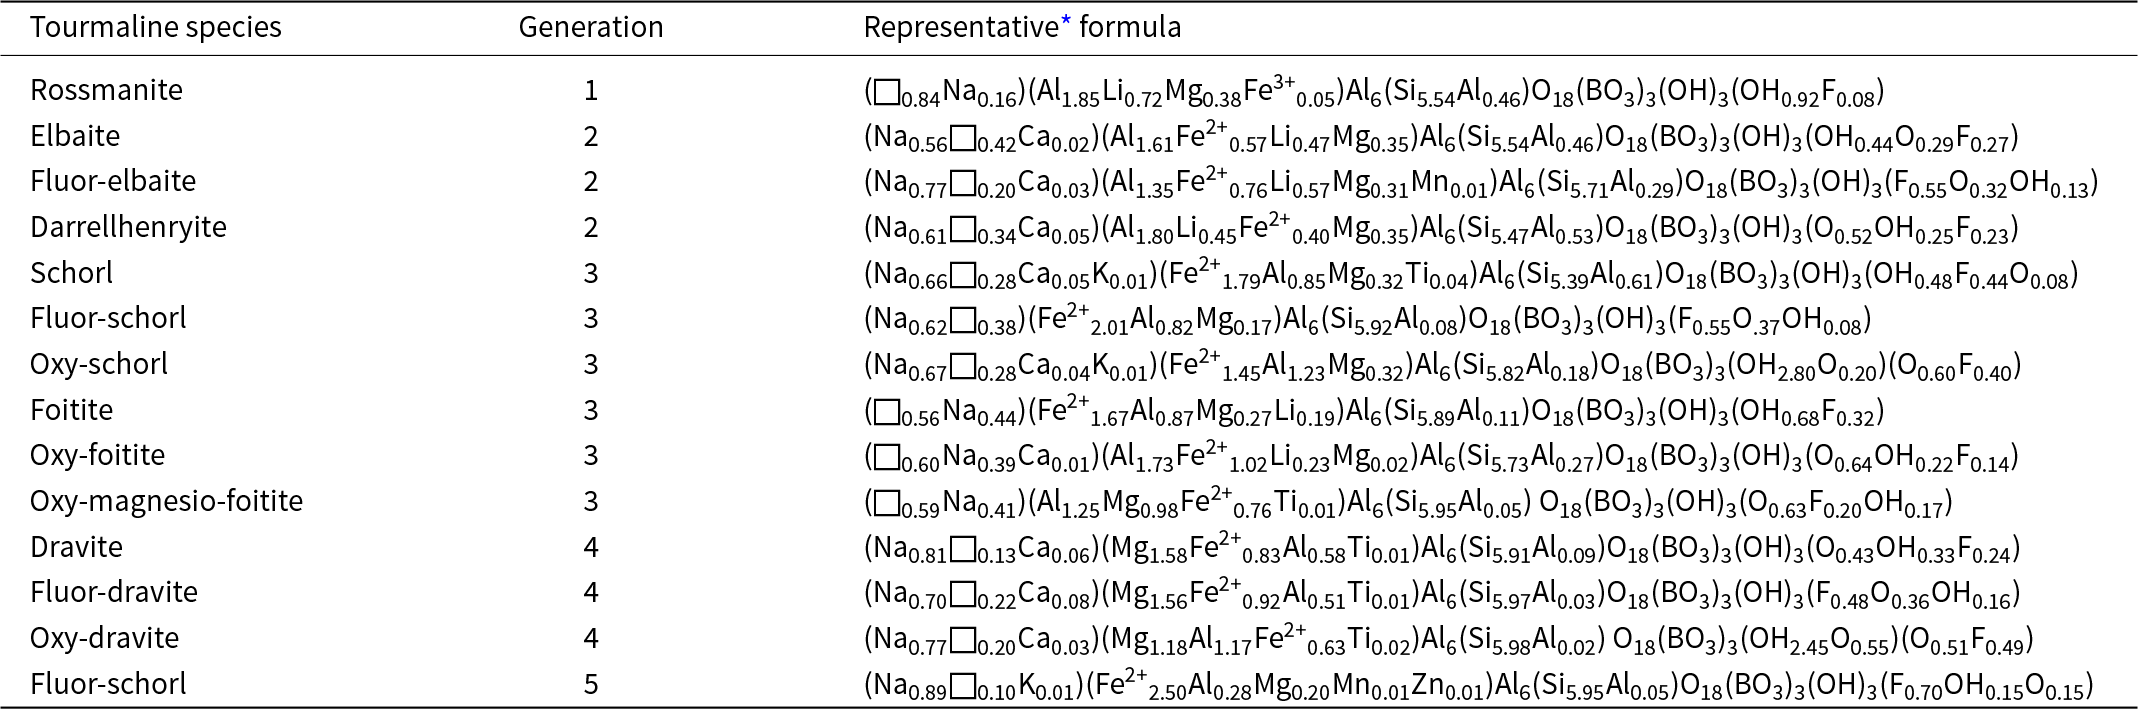
Compositional data collected from five tourmaline grains were grouped by generation using textures, compositional comparison and individual point locations in BSE-imagery. The composition of each generation can be classified into primary groups and species on the basis of dominant cation and anion occupancy at the X- and W-sites, respectively (Henry et al., Reference Henry, Novák, Hawthorne, Ertl, Dutrow, Uher and Pezzotta2011). All tourmaline analysed cluster at low Ca and belong to either the alkali or X-site vacancy dominant group; no Ca dominant tourmaline is present (Fig. 6). The anion site is varied, spanning fluor-, oxy- and hydroxy-dominant species (Fig. 7). Compositional data exhibit a wide range resulting in recognition of a variety of tourmaline species present within this sample (Fig. 8; Tables 1, 2; see also Supplementary data and Supplementary Figure S1). Thirteen individual species are identified with the idealised and representative compositions given in Tables 1 and 2, respectively.
Three primary groups of tourmaline on the basis of dominant occupancy at the [9]X site. Data for each generation of tourmaline are labelled and distinguished by colour and point symbol. Tourmaline compositions are confined to the alkali (Gen 2, 3, 4 and 5) and X-site vacancy groups (Gen 1 and 3), with most data clustered in the alkali-group field. No calcic group species were identified. Data are plotted on the diagram of Henry et al. (Reference Henry, Novák, Hawthorne, Ertl, Dutrow, Uher and Pezzotta2011).

Three general series of tourmaline species on the basis of primary occupancy at the W site. Data for each generation of tourmaline are labelled and distinguished by colour and point symbol. Tourmaline compositions are distributed across the fluor-, oxy-, and hydroxy-species fields. Most data plot within in the fluor-species field. The compositions along the F–O binary suggest no OH– present. Similarly, the W-site occupancy of generation 1 is nearly all OH–. Data are plotted on the diagram of Henry et al. (Reference Henry, Novák, Hawthorne, Ertl, Dutrow, Uher and Pezzotta2011).

Generalised diagram for low-Ca (<0.1 apfu Ca) tourmaline species belonging to the alkali and X-site vacancy groups. Names in each field show the range of possible tourmaline species. YZR2+ is the total amount (in apfu) of divalent cations (Mg2+ + Fe2+ + Mn2+ + Zn2+) at the Y- and Z-sites. Data for each generation of tourmaline are labelled and distinguished by colour and point symbol. Compositions fall in four fields; the majority of data belong to the (Na + K)-R2+ species. Tight clustering of generation 1 data is seen in the X□–Li species field. Diagram is based on Henry et al. (Reference Henry, Novák, Hawthorne, Ertl, Dutrow, Uher and Pezzotta2011).

Generalised formulae for tourmaline species identified in sample BM-1980.169

Generation 1 compositions are tightly clustered (Figs 6, 7). Data (n = 19 data points) are confined to the X-site vacancy-dominant group, containing ∼0.2 apfu (Na+K) and minimal Ca. Tourmalines belong to the hydroxy-dominant species, containing nearly all OH– at the W site (Figs 6, 7). Generation 1 is rossmanite, an X-site vacant, Li–Al tourmaline species (Tables 1, 2), and is found primarily in the core of grains. All analyses of rossmanite grains show minor compositional variation (Fig. 8), with an average formula of (□0.83Na0.17)(Al1.87Li0.74Mg0.36Fe3+0.03)Al6(Si5.56Al0.44)O18(BO3)3(OH)3(OH0.95F0.05).
Representative compositions of tourmaline species identified in sample BM-1980.169

* Chemical formula most representative of the composition of each species from all analyses.
Generation 1 is the most distinctive and the most compositionally homogeneous of all five generations, with only 0.03 apfu variation in both Na and X-site vacancy.
Generation 2 (n = 17) compositions cluster within the alkali-dominant group and vary among the fluor-, oxy- and hydroxy-dominant species, with the majority being fluor-dominant (Figs 6, 7). With up to 0.24 apfu Ca, it is the most calcic of the generations. Generation 2 tourmaline is richer in Li and Al (i.e. elbaite, fluor-elbaite and darrellhenryite species; Tables 1, 2) but with increased Na and Fe contents. Generation 2 partially replaces generation 1 tourmaline and shows more compositional heterogeneity than generation 1 (Fig. 8). Compositional ranges (in apfu) are Al = 7.49–8.64, Fe2+ = 0.32–0.81, Li = 0.37–0.63, Na = 0.45–0.77, O2– = 0.10–0.78 and F– = 0.23–0.57.
Generation 3 tourmaline has the highest number of analyses (n = 240) and displays the greatest compositional heterogeneity. The compositions cluster in the alkali-dominant group with a few in the X-site vacancy-dominant group (Fig. 6). Generation 3 tourmaline is predominantly fluor-dominant but oxy- and hydroxy-dominant species are present (Fig. 7). These alkali-group members are higher in Fe (i.e. schorl, oxy-schorl and fluor-schorl species; Tables 1, 2), and X-site vacancy members (i.e. foitite, oxy-foitite and oxy-magnesio-foitite species; Tables 1, 2) are found in the oscillatory zoned inner rim, richer in Fe and surrounding and partially replacing generations 1 and 2. These X-site vacancy members are grouped with generation 3 because of the absence of textures showing partial replacement of alkali-dominant tourmaline by X-site vacancy-dominant tourmaline. The compositional ranges (in apfu) are Mg = 0.01–0.98, Fe2+ = 0.24–2.26, Na = 0.27–0.89, X-site vacancy = 0.10–0.73, O2– = 0.00–0.93 and F– = 0.06–0.90.
Generation 4 (n = 23) tourmaline belong to the alkali-dominant group and show variations across the fluor-, oxy- and hydroxy-dominant species (Figs 6, 7). Generation 4 is composed of Mg-rich tourmaline species (i.e. oxy-dravite, fluor-dravite and dravite; Tables 1, 2) forming the thin rim surrounding the grains and partially replacing generation 3 tourmaline. Compositional ranges (in apfu) are Al = 6.22–8.26, Fe2+ = 0.19–0.99, Mg = 0.37–2.09, O2– = 1.72–0.71 and F– = 0.24–0.79. It contains the most Mg of the generations.
Generation 5 (n = 34) tourmaline is alkali-dominant and contains minor Ca (Fig. 6); it is fluor-dominant at the W site, with some compositions occurring along the F–O binary suggesting negligible OH– (Fig. 7). The final generation 5 is composed of fluor-schorl (Tables 1, 2) found partially replacing generation 4 and the quartz matrix. Minor compositional variability is present (Fig. 8). This generation contains higher amounts of Fe relative to generation 3 fluor-schorl. It is represented by the average formula (Na0.78□0.20Ca0.01K0.01)(Fe2+2.34Al0.43Mg0.23)Al6(Si5.93Al0.07)O18(BO3)3(OH2.96O0.04)(F0.73O0.15OH0.12). These compositional data allow additional components to be characterised.
Fluid composition
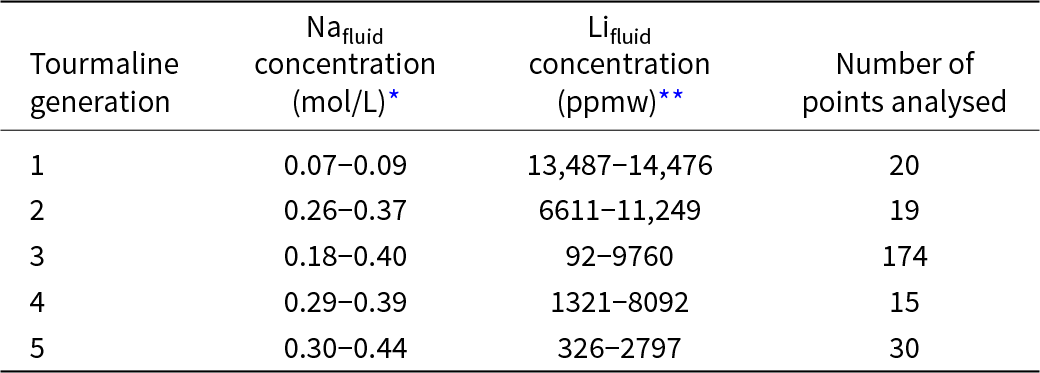
Selected fluid-phase components in equilibrium with tourmaline can be determined on the basis of composition of the coexisting tourmaline (e.g. Von Goerne et al., Reference von Goerne, Franz and Heinrich2001; van Hinsberg and Schumacher, Reference van Hinsberg and Schumacher2011; van Hinsberg et al., Reference van Hinsberg, Franz and Wood2017). On the basis of experimental data, the concentration of Na at the X-site is correlated linearly with Na concentration in aqueous fluids of the growth environment (von Goerne et al., Reference von Goerne, Franz and Heinrich2001; Dutrow and Henry, Reference Dutrow and Henry2016). For low-Ca tourmaline (<0.1 apfu Ca) formed in a primary mineral assemblage of tourmaline–albite–chlorite at temperatures reflecting a late-stage pegmatitic growth environment (T of ∼400°C; Li et al., Reference Li, P, Wu, He, Bachmann and Li2023; McCaffrey and Jowitt, Reference McCaffrey and Jowitt2023) most closely related to this sample, the Na in fluid concentration in mol/L coexisting with tourmaline can be expressed as Nafluid (mol/L) = XNa (T + 6.231)/ 845.873, where XNa is in apfu (e.g. von Goerne et al., Reference von Goerne, Franz and Heinrich2001; van Hinsberg and Schumacher, Reference van Hinsberg and Schumacher2011; Dutrow and Henry, Reference Dutrow and Henry2016). Assuming a temperature of 400°C, the Na concentration (in mol/L) of aqueous fluids in equilibrium with each generation of tourmaline on the basis of compositional ranges is given in Table 3. Although overlap is shown in the ranges, a general increase in the Nafluid is indicated with progressive generations, and differences are apparent.
Concentration of Na and Li in fluids coexisting with each generation of tourmaline

* Na in fluid (mol/L) coexisting with tourmaline–albite–chlorite at 400°C;
** Li partitioning data between tourmaline and metamorphic fluid using assumed partition coefficients from van Hinsberg et al. (Reference van Hinsberg, Franz and Wood2017).
Similarly, the mineral–fluid partition coefficients for minor and trace elements can be used to estimate the composition of the fluid in equilibrium with tourmaline. The Li concentration in the fluid (Lifluid) can be calculated from the partitioning of Li between tourmaline and the metamorphic fluid (see van Hinsberg et al., Reference van Hinsberg, Franz and Wood2017). Uncertainty in these calculations arises from the temperature and pressure dependence on partition coefficients; the reconstructed fluid compositions are estimated to be precise and accurate to within one order of magnitude of the calculated value (van Hinsberg et al., Reference van Hinsberg, Franz and Wood2017) assuming a temperature and pressure of 600°C and 1.2 GPa. Although these pressure–temperature values far exceed conditions for these rocks, these data provide the relative changes in Lifluid associated with each generation of tourmaline. The Li concentration (in ppmw) of fluids in equilibrium with each generation of tourmaline on the basis of compositional ranges is given in Table 3. These reconstructed Lifluid concentrations show a general decrease in Lifluid with each successive generation.
Tourmaline provenance analysis
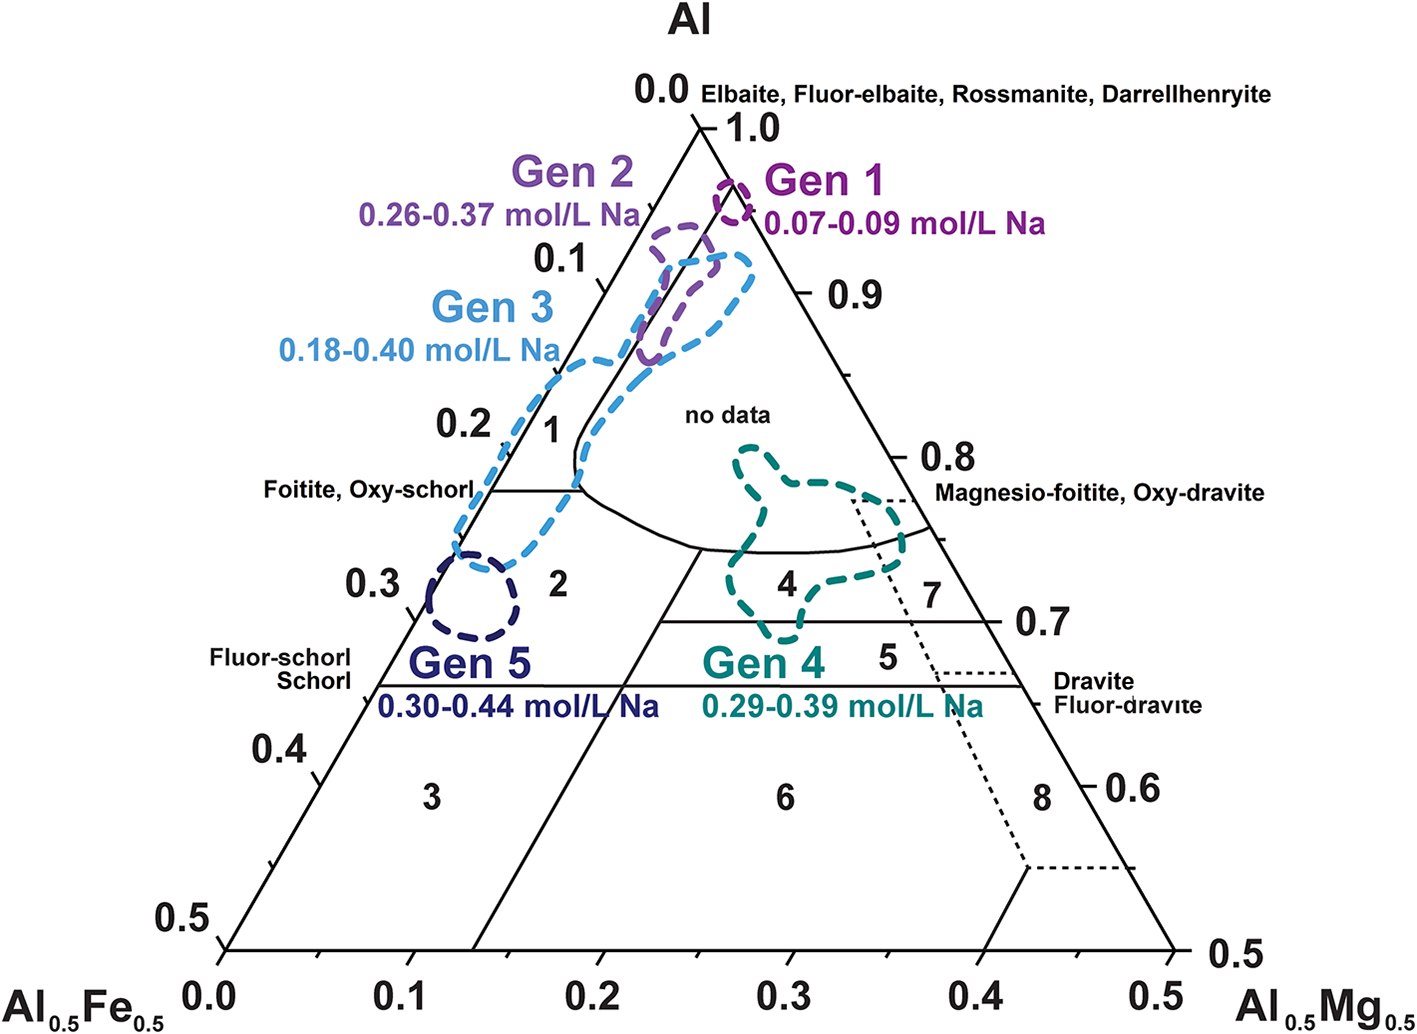
The ability of tourmaline to record and preserve geochemical signatures of its growth environment makes it a highly sensitive petrogenetic indicator mineral (Henry and Guidotti, Reference Henry and Guidotti1985). A provenance diagram (Fig. 9), in which distinct petrogenetic host-rock fields are defined, can be used to constrain the possible geochemical environments (Henry and Guidotti, Reference Henry and Guidotti1985; Henry and Dutrow, Reference Henry and Dutrow2018). This diagram can be used to establish changing environments in equilibrium with each generation of tourmaline in this sample and assist in interpretation of the various generations. Tourmaline data display a wide distribution across multiple host-rock fields, but each generation plots in distinct and separate clusters with the exception of generation 3 on the basis of the Al–Fe–Mg diagram (Fig. 9). Generation 1 tourmaline data are tightly clustered near the Li-rich granitic field. Generation 2 tourmaline data, although richer in Fe, also plot within and near the Li-rich granitic rock field but do not overlap Generation 1 compositions. Generation 3 tourmaline data plot within and near the Li-rich and Li-poor granitic rock fields. Generation 4 tourmaline compositions, with the highest Mg contents, suggest influence from Al-rich metapelites/metapsammites and probably reflect host-rock influence. Generation 5 tourmaline data fall within the Li-poor granitic rock field. Some analyses fall within the ‘no data’ field and mirror the curved boundary between the ‘no data’ and Li-rich granitic rock fields. The more extensive dataset in this study relative to the limited data in the original Henry and Guidotti (Reference Henry and Guidotti1985) suggests that the Li-rich granitic rock field should be expanded.
Variations in tourmaline Fe–Al–Mg composition and Nafluid concentration (mol/L) for each generation shown with reference to the rock type. The Na in-fluid concentration associated with each generation of tourmaline reflects the progressively changing environment and the distinct composition of generation 4. Fluids increase in Na while decreasing in Al with most successive generations. Tourmaline provenance diagram modified from the original ternary plot (Henry and Guidotti, Reference Henry and Guidotti1985). Rock types are: (1) Li-rich granitic rocks; (2) Li-poor granitic rocks; (3) Fe3+-rich granitic rocks; (4) Al-rich metapelites and metapsammites; (5) Al-poor metapelites and metapsammites; (6) Fe3+-rich quartz–tourmaline rocks, calc-silicates and metapelites; (7) low-Ca ultramafic rocks and Cr-, V-rich metasediments; and (8) metacarbonates and metapyroxenites. Coloured dashed lines designate fields for each generation. Selected species present in sample BM-1980.169 are shown as a reference.

Discussion
The observed compositional heterogeneity and zoning patterns reflect the local fluid–rock interactions, fluid composition, availability of elements and pressure–temperature conditions at the time of formation. Each generation reflects the availability of boron, either sourced by the influx of external B-bearing fluids and/or internally from the fluid or from the breakdown of B-bearing phases within the system (e.g. Dutrow and Henry, Reference Dutrow and Henry2000; Henry and Dutrow, Reference Henry and Dutrow2001; Duchoslav et al., Reference Duchoslav, Marks, Drost, McCammon, Marschall, Wenzel and Markl2017; Bačík et al., Reference Bačík, Ozdín, Uher and Chovan2022). At least five distinct generations of tourmaline are identified in the sample investigated by cross-cutting relations, discrete compositional differences and the presence of replacement textures at the boundary between generations reflecting episodic growth and dissolution formed by coupled dissolution-and-reprecipitation reactions. Dissolution of pre-existing tourmaline, marked by irregular boundaries and compositional differences formed prior to the next generation of growth, suggests that each generation might have provided some components for the succeeding tourmaline generation. As such, the tourmalines were ‘self-cannibalising’. Dissolution results from interactions with a fluid composition out-of-equilibrium with the existing tourmaline. Additional evidence for external fluid infiltration includes distinct growth patterns characteristic of open-system behaviour, such as oscillatory zoning, irregular grain boundaries and overgrowths. Pre-existing tourmaline will dissolve and reprecipitate to maintain equilibrium with each episode of infiltrating fluids (Dutrow and Henry Reference Dutrow and Henry2000; Dutrow and Henry, Reference Dutrow and Henry2018). New growth reflects the composition of the externally derived fluid after re-equilibration, accumulating a detailed chemical record of episodic fluid-influx events and environmental fluctuations.
The original host rock, preserved as generation 1 tourmaline, is interpreted to have been Li-rich and granitic (Fig. 9). Fluids in equilibrium with this generation have the lowest Na composition calculated for all tourmaline generations (Fig. 9; Table 3). This coexisting fluid suggests interactions between a Na-poor, B-bearing, neutral-to-acidic hydrothermal fluid and a Li-rich host rock. The compositional and textural homogeneity displayed by generation 1 suggests primary magmatic growth. In addition to the absence of compositional zonation, the elevated Y-site Al observed in generation 1 is consistent with granitic tourmaline from the St. Austell Granite and Cornubian batholith (London and Manning, Reference London and Manning1995). Dissolution textures bound generation 1 tourmaline, suggesting the original tourmaline was destabilised and dissolved (Figs 10–12). Once equilibrium was achieved, new growth of a compositionally distinct generation 2 tourmaline occurred with a mixture of components from generation 1 tourmaline and the aqueous fluid. Aqueous fluids coexisting with generation 2 are poorer in Li and richer in Na, Fe, Mg, F– and Ca, producing a more Na-rich species than that of generation 1 (Fig. 9; Tables 2–3). The transition from generation 1 to generation 2 relates to the substitutions X□ + YFe2+ = XNa + YLi and WOH– = WF–. One scenario involves the growth of generation 2 from late Na-rich magmatic fluids during the early subsolidus phase of the pluton. An alternate hypothesis involves the growth of generation 2 from externally derived hydrothermal fluids in an open system, where the increase in Nafluid could be correlated to the breakdown of feldspars releasing alkalis during the initial phase of kaolinisation.
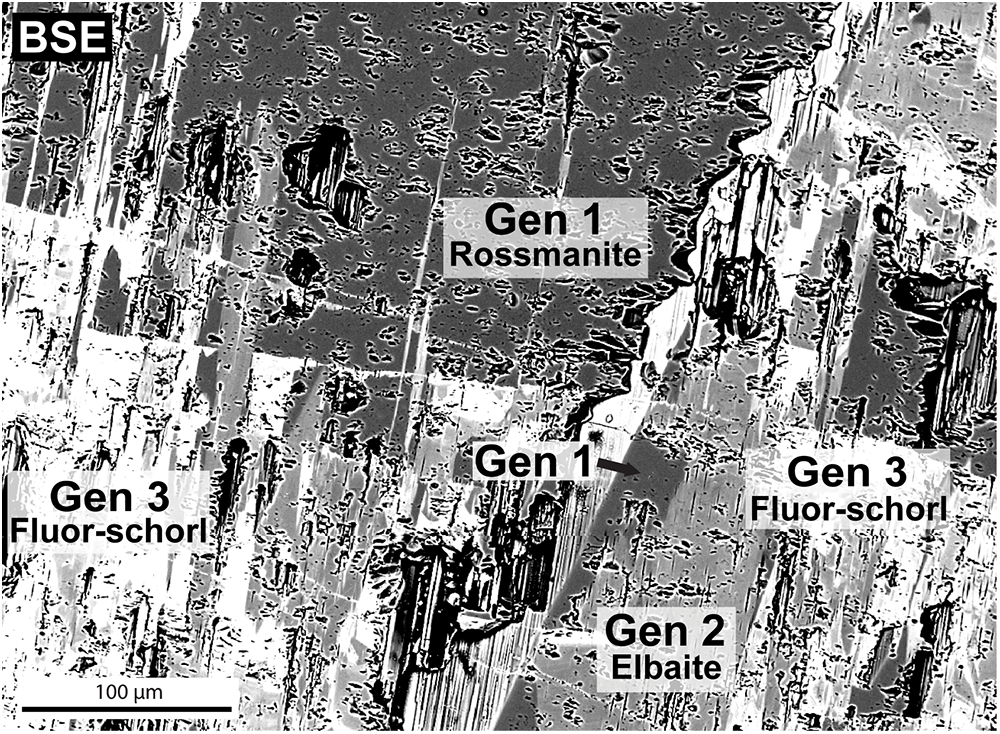
BSE image of sample BM-1980.169 highlighting complex overgrowths, scalloped boundaries and dissolution and reprecipitation textures. Generation 1 tourmaline (darkest grey) is partially replaced by the lighter grey generation 2 tourmaline. Generation 3 tourmaline (lightest grey) replaces both generations 1 and 2 and appears as fibrous to acicular growths within the plane of the thin section.

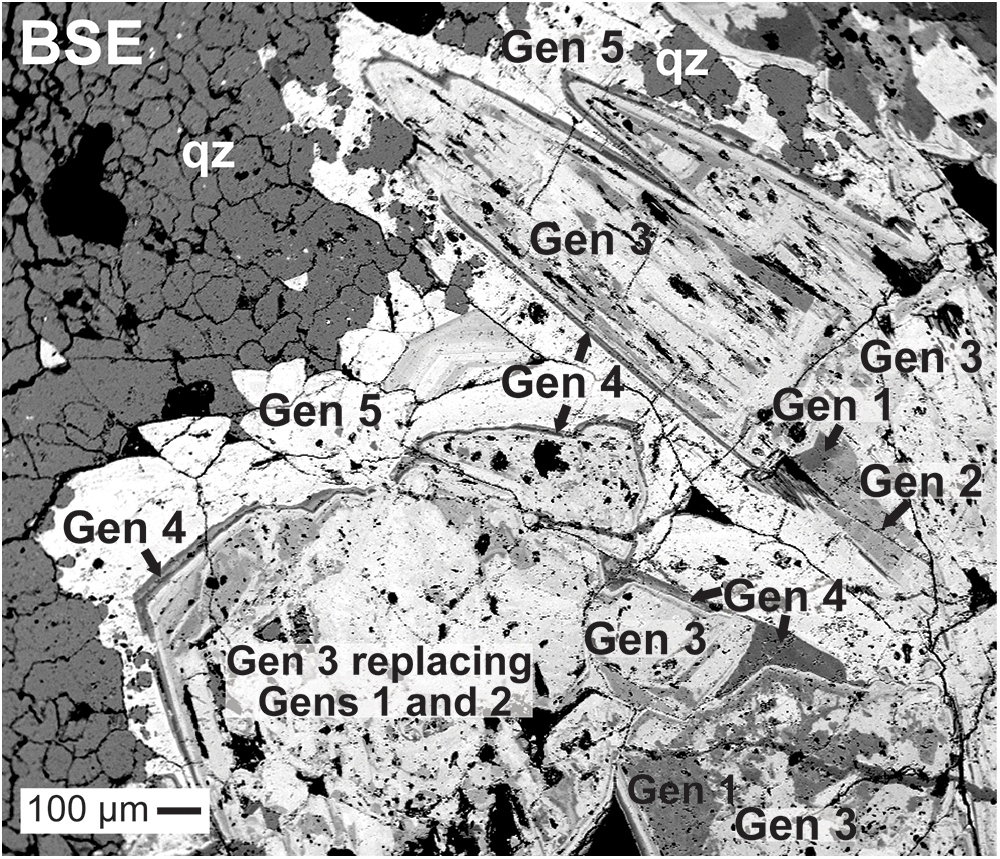
Replacement features observed in BSE in sample BM-1980.169 showing the five generations of tourmaline identified within the sample. Generations 1 and 2 are the darkest grey cores of the grain and are partially replaced by the lighter grey generation 3 tourmaline. Generation 4 tourmaline is observed as the thin, dark rim surrounding the grains. Generation 5 tourmaline is the lightest grey; it surrounds all previous generations and overgrows the quartz matrix.

Schematic outline showing the locations of each generation of tourmaline, on a colour overlay (on a PPL image) coded and labelled (1–5) by generation. The boundaries between generations and the quartz matrix were determined using BSE and PPL.

Dissolution of generations 1 and 2 and precipitation of generation 3 are observed (Figs 10–12). Both previous generations of tourmaline are partially replaced by the compositionally differing generation 3. Replacement textures, fine-scale zoning patterns and the continued increase in Na and Fe associated with generation 3 suggest that this generation was formed by a third, chemically distinct fluid event in an open system. Fluids in equilibrium with generation 3 are richer in Fe, Na and F– and poorer in Li, precipitating a more Fe- and Na-rich tourmaline (Fig. 9; Tables 2–3). These complex zoning patterns observed in generation 3 (Fig. 5) are consistent with hydrothermal tourmaline from the St. Austell granite and Cornubian batholith (London and Manning, Reference London and Manning1995; Duchoslav et al., Reference Duchoslav, Marks, Drost, McCammon, Marschall, Wenzel and Markl2017). One scenario involves the continued influx of acidic fluids that carried alkalis from the feldspar and Fe from the biotite. The influx of F reflected in the generation 3 tourmaline could have been sourced externally from the hydrothermal fluid or from the internal breakdown of biotite and muscovite within the granite. The transition from generation 2 to generation 3 results from the substitutions YLi+ + YAl3+ = 2YFe2+, XNa + YLi = X□ + YFe2+ and WOH– = WF–. Alternatively, generations 1–3 could represent evolving magmatic/hydrothermal fluids.
Generation 4, the thin rim surrounding and partially replacing grains composed of generations 1–3 (Figs 11, 12), reflects a limited growth environment. It is the most Mg-rich of all identified tourmaline generations and crystallised from fluids richer in Mg and poorer in Na than those in equilibrium with generation 3 (Fig. 9; Tables 2, 3). These fluid compositions result in tourmaline compositions consistent with those in equilibrium with Al-rich metapelites (Fig. 9). They probably correspond to interactions with the host rock, providing an external fluid richer in Mg and poorer in Fe. The transition from generation 3 to generation 4 relates to the substitutions YFe2+ = YMg2+, XNa+ + YMg2+ = X□ + YAl3+ and WOH– = WF–.
Generation 5, the final stages of tourmaline formation, is observed throughout the sample partially replacing generations 1–4. Additionally, generation 5 appears to replace and overgrow the quartz matrix while preserving its texture (Figs 11, 12). Tourmaline replacing quartz is also observed in other granitic hydrothermal systems such as the Tusaquillas Granitic batholith in NW Argentina (Henry et al., Reference Henry, Zappettini and Dutrow2022). These replacement textures indicate that generation 5 formed from an additional external fluid-circulation event after the growth of generations 1–4 and the quartz matrix. These late-stage fluids are richer in Fe, Na and F– and have the highest Na and F– concentration of all identified generations of tourmaline (Fig. 9; Table 3). The transition from generation 4 to generation 5 relates to the substitutions YMg2+ = YFe2+ and WOH– = WF–.
The complex growth history of the tourmaline records multiple episodes of fluid–mineral interactions within the original Li-rich host granite. Fluids in equilibrium with each generation of tourmaline become progressively more sodic and poorer in Li (Fig. 9; Table 3). This generational increase in Na probably reflects the episodic infiltration of fluids and/or internal breakdown of Na-bearing phases such as albite during the kaolinisation of host granites. Acidic fluids, required to alter feldspar to kaolinite, are consistent with stabilisation of tourmaline. Interactions with the host rock and with the pre-existing tourmaline create a Na-rich, boron-bearing, neutral-to-acidic fluid that promotes tourmaline growth. The extensive kaolinisation observed in the Dorothy China Clay Pit is also associated with alteration of biotite and muscovite, which releases Fe, Mg, and potentially B and F into the surrounding environment (Bray and Spooner, Reference Bray and Spooner1983; Mueller et al., Reference Mueller, Scott and Evans1999). These fluid-mobile elements are thus readily available to be incorporated into tourmaline. The significant increase in Fe, Mg and F, and decrease in Al observed in the late-stage tourmaline growth could reflect the progressive breakdown of biotite and muscovite leading to its complete consumption within the host granites. Another scenario involves the generational increase in Na and F resulting from the fractionation of magmatic/hydrothermal fluids (e.g. Dutrow and Henry Reference Dutrow and Henry2000). However, the distinct compositions and textural discontinuities observed in each tourmaline generation suggests discrete fluid pulses rather than a continuous transition.
Conclusions
Compositional and textural characterisation of sample BM-1980.169 provides an account of multiple fluid interactions reflecting hydrothermal activity in an open system as recorded by at least five distinct generations of ‘self-cannibalising’ tourmaline. Tourmaline grains dissolved and reprecipitated with each episode of infiltrating fluids, chemically recording the progressive alteration of its host environment. Generation 1, with less Na, and more Li and Al (rossmanite core) suggests original tourmaline formation in a Li-rich granitic host rock. Generation 2, poorer in Li and richer in Na and Fe, fluor-elbaite suggests formation in either (1) a closed system from interactions with late-magmatic fluids or (2) an open system during the early stages of kaolinisation where the initial breakdown of albite, muscovite and biotite occurred in the host granites to provide the Na and Fe. Generation 3 species fluor-schorl with less Li and Al, and more Na and Fe, suggests formation during the intermediate stages of kaolinisation where more extensive alteration of albite, muscovite and biotite occurred. The most compositionally distinctive generation 4 dravite, richest in Mg, reflects formation associated with the influx of distinct chemical components originating externally to the host granites. Generation 5, the richest in Na, Fe and F, fluor-schorl suggests formation associated with the late stages of alteration where the host granites have been extensively kaolinised and depleted in alkalis and Si. The fluids associated with the formation of the St. Austell Granite kaolinite deposits were acidic, promoting the growth of tourmaline. The complex fluid–mineral interactions recorded by each generation of tourmaline suggest a history of hydrothermal activity within the Dorothy China Clay Pit, providing support for the hydrothermal origin hypothesis of the kaolinite deposits in the granite.
Supplementary material
The supplementary material for this article can be found at https://doi.org/10.1180/mgm.2025.10113.
Acknowledgements
Dr. Edward Grew has made profound and lasting contributions to the study of boron and light elements in crustal environments and to borosilicate (and many other) minerals, including tourmaline. This paper is dedicated to him in honour of his long commitment to the mineral sciences. His generosity of time extends from serving as editor for volumes and journals, to being a meticulous reviewer of papers and to his service for professional societies. No task is too large or too small for Ed. Over our many decades of interactions in various countries around the world, we are grateful for sharing his expertise, his friendship and his support. The authors thank the Natural History Museum, London, England and Robin Hansen for providing the sample. Robin Shail is thanked for kindly providing the map of the St. Austell Granite. Dr. Matthew Loocke is thanked for assistance with acquisition of analytical data. Detailed and insightful reviews from guest Associate Editor Robert Martin, Milan Novák, Jan Cempírek and an anonymous reviewer improved the paper and are greatly appreciated.
Competing interests
The authors declare none.
Financial statement
Support for this study derived from the National Science Foundation (IF grant #1551434; BLD & DJH) and from Chevron for analytical funds for student research to MER (LSU Chevron Student Analytical Research Fund).