INTRODUCTION
Nonverbal behaviors accompanying second language (L2) speech, including a speaker’s facial cues (e.g., eyebrow raises, blinks), head movements, and hand gestures, have been shown to enhance speech perception (e.g., Li et al., Reference Li, Baills and Prieto2020; Zheng & Samuel, Reference Zheng and Samuel2019) and improve listening comprehension (e.g., Batty, Reference Batty2014; Sueyoshi & Hardison, Reference Sueyoshi and Hardison2005) for the listener. Considering their sensitivity to visual information, listeners with access to a speaker’s visual cues may also evaluate the speaker more favorably. However, prior research has primarily relied on audio recordings of speaker performance, and no work to date has focused on how visual cues can contribute to such global listener-based measures of L2 speech as comprehensibility, accentedness, and fluency, which is the goal of this study.
When listeners evaluate comprehensibility (i.e., how easily listeners understand a speaker), they primarily rely on various linguistic dimensions in L2 speech, including phonology, lexis, grammar, fluency, and discourse (e.g., Isaacs & Trofimovich, Reference Isaacs and Trofimovich2012). Listener perceptions of accentedness, which captures how closely a speaker approximates the expected language variety (Munro & Derwing, Reference Munro and Derwing1995), are narrower in scope and are mostly determined by a speaker’s segmental and suprasegmental accuracy (Hayes-Harb & Hacking, Reference Hayes-Harb and Hacking2015; Saito et al., Reference Saito, Trofimovich and Isaacs2017). In turn, a listener-rated measure of fluency, which typically captures various aspects of utterance flow, can be largely explained through temporal characteristics of speech, including pausing and articulation speed (Bosker et al., Reference Bosker, Pinget, Quené, Sanders and de Jong2013; Kahng, Reference Kahng2018). In research settings, these global dimensions of speech have typically been operationalized in terms of listeners’ intuitive judgements, through Likert-type scales (e.g., Munro & Derwing, Reference Munro and Derwing1995) or continuous sliding scales (e.g., Saito et al., Reference Saito, Trofimovich and Isaacs2017).
Although listener-based global dimensions of L2 speech, such as comprehensibility, accentedness, and fluency, are popular measures of L2 performance in research and assessment settings (Saito & Plonsky, Reference Saito and Plonsky2019), most previous research has focused on these dimensions through evaluation of audio recordings. However, there are certainly situations in which L2 speakers are judged when a rater (listener or interlocutor) has access not only to aural but also visual information. For instance, a speaker’s appearance (e.g., in images) or various dynamic visual cues (e.g., in video clips or face-to-face interaction) can impact how accented or comprehensible the speaker sounds to a listener (Kang & Rubin, Reference Kang and Rubin2009; Kutlu, Reference Kutlu2020). Moreover, in high-stakes assessments, such as the International English Language Testing System (IELTS), test-takers’ performance is often evaluated when the rater not only observes L2 speakers but also interacts with them in real time (Nakatsuhara et al., Reference Nakatsuhara, Inoue and Taylor2021). In fact, outside laboratory settings or language tests, L2 speakers most often interact with their interlocutors in person as part of daily communication. However, to date, very little is known about how listeners’ evaluations of L2 speech vary based on their access to a speaker’s visual cues.
Because visual and verbal information are intertwined in human communication, they make a joint contribution to listeners’ perception, interpretation, and comprehension of speech (Gullberg, Reference Gullberg2006; Kelly et al., Reference Kelly, Manning and Rodak2008). Neurocognitive evidence suggests that people integrate verbal and visual information while processing speech (Bates & Dick, Reference Bates and Dick2002) and that visual information enhances speech processing for listeners (Beattie & Shovelton, Reference Beattie and Shovelton1999). Seeing a speaker’s facial expressions (e.g., sadness, happiness, confusion), for example, may help a listener anticipate what kind of information will be shared (Wagner, Reference Wagner2008). Similarly, a speaker may gesture toward an object to clarify a referent, which can help listeners understand the speaker’s intended message (Kendon, Reference Kendon1994).
Paying attention to a speaker’s facial expressions (especially articulatory configurations involving lip and jaw movement) can help listeners process speech, such that listeners perceive segmental and suprasegmental information more accurately when they can lipread (Swerts & Krahmer, Reference Swerts and Krahmer2008) or when a speaker’s head movement is aligned with prominence markers, such as when a head nod co-occurs with a stressed word (Pelachaud et al., Reference Pelachaud, Badler and Steedman1996). For example, when speech was masked in noise to make perception more challenging, listeners identified verbs significantly better when they saw a speaker’s lip movements and hand gestures, compared to when only auditory information was available (Drijvers & Özyürek, Reference Drijvers and Özyürek2017, Reference Drijvers and Özyürek2020). Listeners have been shown to identify words more accurately when they saw a speaker closely, as opposed to from a distance (which made lip-reading difficult), especially if the speaker had a stronger foreign accent (Zheng & Samuel, Reference Zheng and Samuel2019).
In addition to facial cues, hand gestures may impact how listeners perceive L2 speech (Gullberg & McCafferty, Reference Gullberg and McCafferty2008). For instance, when raters observed a speaker using gestures in face-to-face assessment, they more positively evaluated the speaker in terms of fluency, lexis, grammar, pronunciation, accuracy, range, and effectiveness compared to evaluating the speaker from audio recordings (Nakatsuhara et al., Reference Nakatsuhara, Inoue and Taylor2021; Nambiar & Goon, Reference Nambiar and Goon1993; Neu, Reference Neu, Scarcella, Andersen and Krashen1990). Similarly, when listeners transcribed monosyllabic action verbs (with and without vowel errors) while watching video clips, their transcription accuracy was highest when they observed a speaker use iconic gestures illustrating the actions (Wheeler, Reference Wheeler2019). Besides the presence or absence of gestures, their frequency of occurrence may be important, such that L2 speakers were evaluated higher in oral proficiency when they used more hand gestures, compared to peers who used fewer gestures (Gullberg, Reference Gullberg1998; Jenkins & Parra, Reference Jenkins and Parra2003; McCafferty, Reference McCafferty2002).
Although facial expression and gestures can aid listeners in various ways, some cues or their combinations can be more beneficial than others. Focusing on visual cues in L2 listening comprehension, Sueyoshi and Hardison (Reference Sueyoshi and Hardison2005) presented L2 English learners with an academic lecture in one of three conditions: audio only, audio plus face, and full video. Those who had access to the full video showed greater comprehension than those exposed to audio only, but there was no difference between the face only and the full video conditions, implying that various facial cues rather than gestures benefited listener comprehension, although gestures may have been useful for lower-proficiency learners. In a detailed analysis of video-recorded university lectures, Hardison (Reference Hardison2018) found that instructors used various combinations of cues (e.g., moving head, raising eyebrows, blinking) when emphasizing words that they felt important to highlight, in which beat gestures (hand or finger movements co-occurring with a rhythmic pulse) were particularly salient for listeners as carrying significance.
Even if a speaker’s facial expressions and hand gestures are useful for listeners or raters evaluating L2 performance, the incidence of these cues might depend on individual differences in speaker proficiency (Gregersen et al., Reference Gregersen, Olivares-Cuhat and Storm2009) or cultural background (Gullberg, Reference Gullberg2006; Kita, Reference Kita2009), which might moderate the extent to which visual cues are useful for speech assessment. For instance, when engaged in dyadic conversations, advanced L2 speakers used gestures more frequently than lower-proficiency speakers (Gregersen et al., Reference Gregersen, Olivares-Cuhat and Storm2009). Similarly, in comparisons of gesture use across speakers from different linguistic and cultural backgrounds, English–Spanish bilinguals produced more gestures than English monolinguals (Pika et al., Reference Pika, Nicoladis and Marentette2006), native English speakers gestured more frequently than Chinese speakers (So, Reference So2010), and gesture use was more prevalent for L2 English speakers from Romance backgrounds than speakers from Asian backgrounds (Nicoladis et al., Reference Nicoladis, Nagpal, Marentette and Hauer2018). Thus, to determine if visual cues are relevant to listener-based evaluations of L2 speakers’ performance, it would be important to account for speakers’ language proficiency and their language background.
Finally, although prior research has generally found positive effects for visual cues, visual information can have few or even negative effects on listeners. For example, when listeners identified L2 phonemes, they were generally more accurate in the audiovisual than the audio condition (Kawase et al., Reference Kawase, Hannah and Wang2014). However, this benefit decreased when listeners had access to nontarget articulatory configurations, such as English /ɹ/ produced without lip rounding. Inceoglu (Reference Inceoglu2019) found no difference between the audio and audiovisual conditions for the accuracy of L2 learners’ vowel identification, which implied that having access to a speaker’s visual cues did not aid learners in a phoneme-focused task. At a global level, Ockey (Reference Ockey2007) examined test-takers’ engagement with visual materials in a listening comprehension test. Whereas more proficient test-takers found access to videos useful, less proficient test-takers reported videos to be distracting, suggesting that processing visual and verbal information simultaneously might increase listeners’ processing load (Mayer & Moreno, Reference Mayer and Moreno2003; Wagner, Reference Wagner2008). In light of these conflicting findings, it remains unclear whether listeners’ evaluations of such global dimensions of L2 speech as comprehensibility, accentedness, and fluency differ as a function of their access to a speaker’s visual cues.
THE CURRENT STUDY
Although prior research has revealed potential links between a speaker’s visual cues and listener perception, these findings remain tentative because the impact of visual cues has been examined for specific segmental and suprasegmental targets (Inceoglu, Reference Inceoglu2019; Li et al., Reference Li, Baills and Prieto2020; Scarborough et al., Reference Scarborough, Keating, Mattys, Cho and Alwan2009) rather than listener-assessed measures of L2 speaking, including comprehensibility, accentedness, and fluency. Furthermore, the role of visual cues has often been examined through rehearsed output, such as speakers reading words aloud (Li et al., Reference Li, Baills and Prieto2020; Wheeler, Reference Wheeler2019), and in monologic performances (Sueyoshi & Hardison, Reference Sueyoshi and Hardison2005), as opposed to spontaneous conversations where an interlocutor’s presence may make visual cues more prevalent (Alibali et al., Reference Alibali, Kita and Young2000; Bavelas et al., Reference Bavelas, Coates and Johnson2002). When extemporaneous speech was targeted (e.g., in university lectures), such research primarily focused on listeners’ comprehension (Sueyoshi & Hardison, Reference Sueyoshi and Hardison2005) instead of their global assessments of speakers’ performance. Gesture use also appears to vary across culture (Gullberg, Reference Gullberg2006; Iverson et al., Reference Iverson, Capirci, Volterra and Goldin-Meadow2008; Kita, Reference Kita2009) and across speaker proficiency (Gregersen et al., Reference Gregersen, Olivares-Cuhat and Storm2009). Therefore, it is important to explore the role of visual cues in the evaluation of L2 speech from speakers while controlling for their language proficiency and language background.
To shed light on how rater assessments differ based on access to a speaker’s visual information, we elicited evaluations of comprehensibility, accentedness, and fluency while manipulating the type of visual cues (facial expressions, hand gestures) available to raters. Because raters may evaluate L2 speech more positively (Nakatsuhara et al., Reference Nakatsuhara, Inoue and Taylor2021; Nambiar & Goon, Reference Nambiar and Goon1993; Neu, Reference Neu, Scarcella, Andersen and Krashen1990), show greater comprehension (Sueyoshi & Hardison, Reference Sueyoshi and Hardison2005), and process speech more easily when given access to facial expressions (Zheng & Samuel, Reference Zheng and Samuel2019) or hand gestures (Drijvers & Özyürek, Reference Drijvers and Özyürek2017, Reference Drijvers and Özyürek2020; Wheeler, Reference Wheeler2019), videos were manipulated to provide varying access to visual cues while keeping audio consistent. To explore potential cultural differences in visual cue use (Gullberg et al., Reference Gullberg, De Bot and Volterra2008; Nicoladis et al., Reference Nicoladis, Nagpal, Marentette and Hauer2018), we evaluated speaking performances by L2 speakers from Chinese- and Spanish-language backgrounds, as speakers from these backgrounds tend to vary greatly in their gesture use (Nicoladis et al., Reference Nicoladis, Nagpal, Marentette and Hauer2018). To account for possible variation in the use of visual cues across individual speakers varying in their L2 skills, we used several measures of L2 speakers’ proficiency and use as control covariates. This study was guided by the following research questions:
-
1. Do raters evaluate the comprehensibility, accentedness, and fluency of L2 English speakers from Chinese and Spanish backgrounds differently based on access to visual cues?
-
2. Which visual cues are associated with rater assessments of the speakers’ comprehensibility, accentedness, and fluency?
Based on prior work, we hypothesized that access to facial expressions would influence ratings positively because raters can rely on lip-reading to identify segment- and prosody-specific information in speech. We also reasoned that having access to a speaker’s hand gestures may have an added benefit because raters may receive complementary information through gesture. We anticipated that these potential benefits would vary for the two speaker groups, as L2 speakers from Spanish-language backgrounds may use visual cues more frequently than those from Chinese backgrounds (Nicoladis et al., Reference Nicoladis, Nagpal, Marentette and Hauer2018). Based on the lack of systematic investigation of various visual cues in relation to global dimensions of L2 speech, we had no expectation regarding which specific visual cues might be associated with listener-based ratings of comprehensibility, accentedness, and fluency.
METHOD
SPEECH SAMPLES
L2 speech samples were drawn from the Corpus of English as a Lingua Franca Interaction (CELFI), in which L2 English speakers from Canadian English-medium universities in Montreal carried out three, 10-minute communicative tasks in pairs (McDonough & Trofimovich, Reference McDonough and Trofimovich2019). For this study, the close-call narrative task in which L2 speakers described a personal story about a narrow escape from trouble or danger was used (see Appendix A). The task was particularly suitable because L2 speakers interacted with their interlocutors for 10 minutes to exchange stories, and thus had the opportunity to engage in natural communicative behaviors (Alibali et al., Reference Alibali, Kita and Young2000).
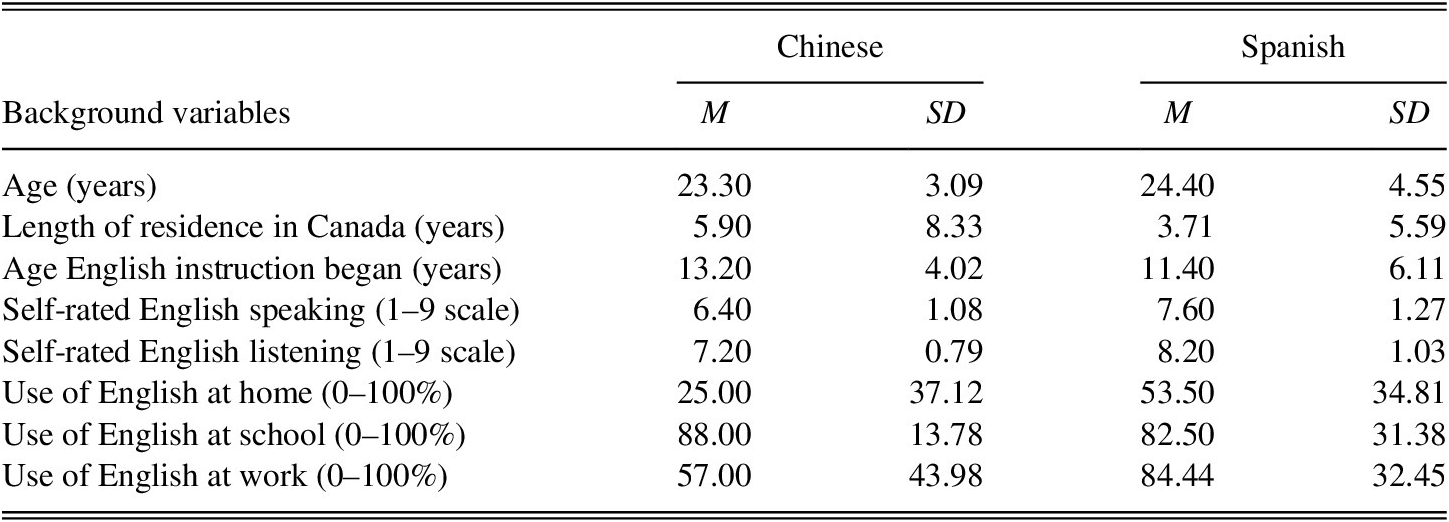
An equal number of first language (L1) Spanish and Chinese (both Mandarin and Cantonese) speakers were sampled from the corpus based on the following inclusion criteria: (a) minimal hand movement crossing the face (so that facial expressions would not be obscured and the conditions with and without access to facial expressions and gestures could be kept separate), (b) speech sample of 1.5–2.0 minutes in length, and (c) minimal interruption by their partner (see Table 1 for a summary of background information). The 20 speakers were all Canadian university students (Mage = 23.90 years, SD = 3.83) enrolled in either undergraduate (15) or graduate (5) degree programs from different disciplines (e.g., business, psychology, marketing, computer science, studio art). As degree-seeking students, they had met the universities’ minimum English language requirement for admission, which was a TOEFL iBT score of 75 (or equivalent). Between the two L1 groups, there were no differences for any of the background variables, t(18) < –1.53, p > .144, d < 0.69, except self-rated English proficiency in speaking, t(18) = –2.29, p = .035, d = 1.02, and in listening, t(18) = –2.43, p = .026, d = 1.09, with Chinese speakers evaluating their L2 oral proficiency lower than Spanish speakers.
Speaker background characteristics by language group

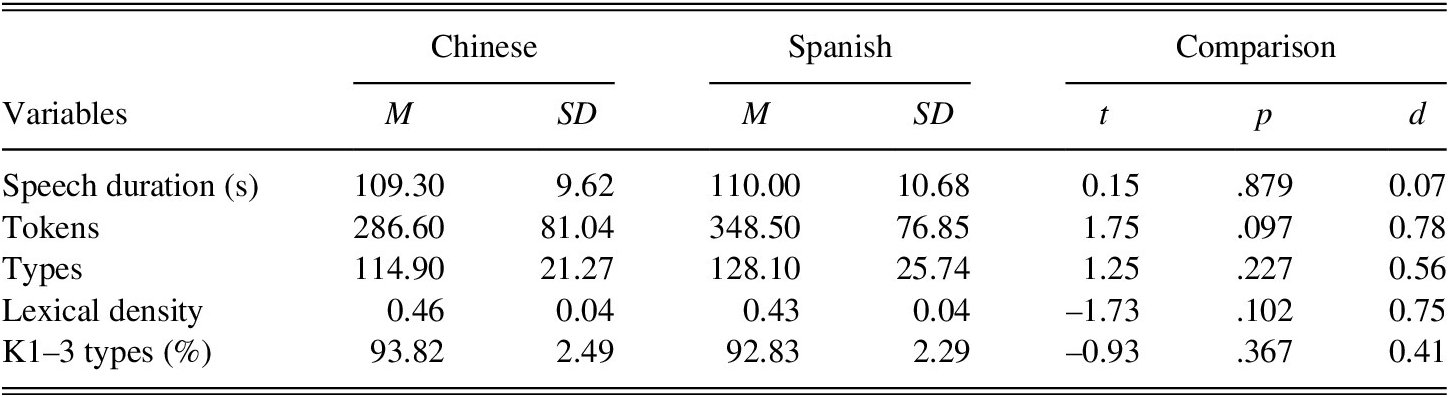
To ensure that the speech samples did not differ dramatically in the information provided to raters, they were checked for length and compared through lexical profiling (Cobb, Reference Cobb2019). As summarized in Table 2, although the mean length of the narratives was highly comparable, Spanish speakers produced longer stories than Chinese speakers (by an average of 62 tokens); however, no between-group differences reached statistical significance.
Narrative characteristics by speaker group

RATING STIMULI
After selecting the speech samples, short clips from the videos (M = 110 seconds, SD = 9.90) were extracted to show only the speaker’s upper body (face, arms, and torso) while communicating with their interlocutor. The video clips were then manipulated to present audio paired with three different visual conditions (Figure 1) using photo and video editing software (VideoPad, PhotoPad): (a) audio only (a static image of the speaker’s face and torso), (b) audio with expressions (dynamic face with a static torso image), and (c) full video (full video containing dynamic face and torso).
Screenshots of the three visual conditions.

RATERS
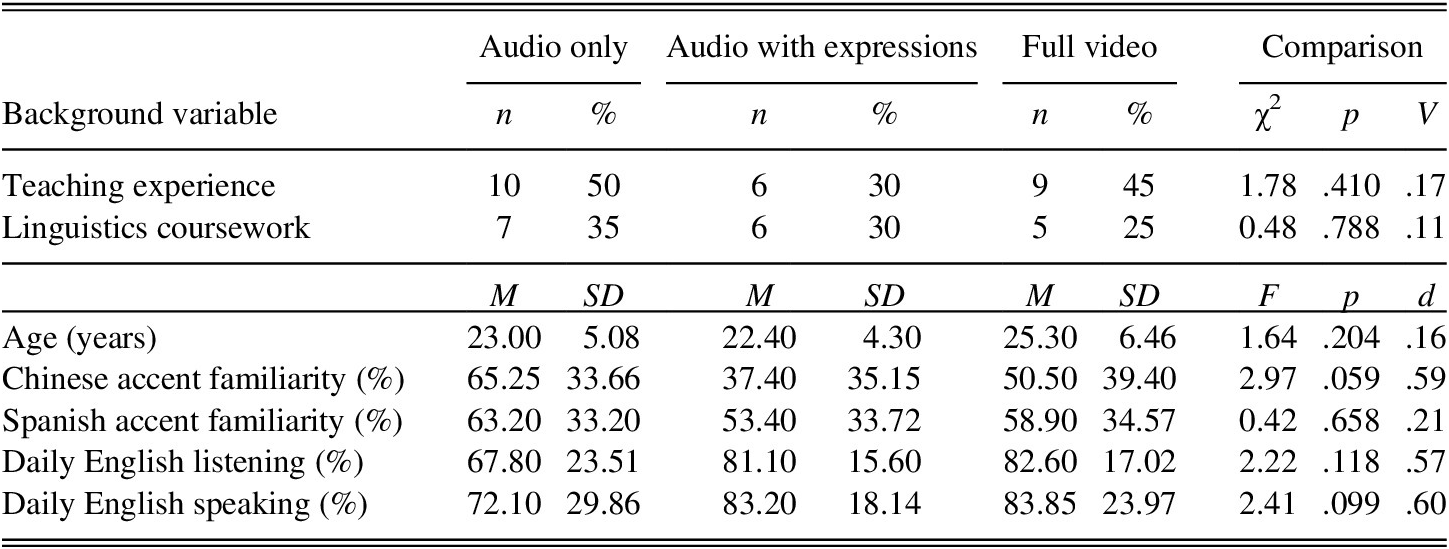
The raters were 60 university students (Mage = 23.57 years, SD = 5.41) enrolled in undergraduate (47) or graduate (13) programs at the same English-medium Canadian universities as the L2 speakers. The raters were recruited from the same speech community as the speakers on the assumption that they would represent their potential interlocutors (e.g., as classmates). They came from diverse language backgrounds, with 62% reporting English or French as their L1s. They all reported having normal hearing, and eight raters had previously taken a phonetics or phonology course. Twenty-five raters (42%) had English teaching experience of varying lengths (Myears = 1.32, SD = 1.93). Using a percentage scale (0 = not at all, 100 = very familiar), they self-reported being moderately familiar with Chinese-accented English (M = 51.05%, SD = 37.34) and Spanish-accented English (M = 58.50%, SD = 33.50). Raters were randomly assigned to one of the three visual conditions (20 per condition). As shown in Table 3, there were no statistically significant differences for any of the rater background variables. This implied that the raters were comparable in their characteristics, which minimized the possibility that differences in ratings across the conditions could be attributable to rater profiles.
Raters’ background characteristics by condition (20 raters per condition)

PROCEDURE
The raters participated in small-group sessions (1–3 people) with a researcher in a laboratory setting (1.5 hours), using a laptop computer to access an online interface through LimeSurvey (https://www.limesurvey.org). The interface contained embedded videos presented with three 1,000-point sliding scales (Saito et al., Reference Saito, Trofimovich and Isaacs2017) for each speech dimension (comprehensibility, accentedness, fluency), all available below each video (see Appendix B for a screenshot of the interface). To maintain comparability of findings across studies, comprehensibility, accentedness, and fluency were defined to the raters through established definitions, as used in previous work targeting these dimensions in audio recordings only (Derwing & Munro, Reference Derwing and Munro2015), although the raters in this study had access to both aural and visual information across the three rating conditions. Comprehensibility was introduced as the degree of effort required by the listener to understand the speaker. Accentedness was described as the extent to which the speech differed from a production pattern expected of a native English speaker, with “heavy accent” describing speech that departs heavily from a native speaker’s production and “no accent” referring to nativelike production. Fluency concerned the pace of speech, with fluent performance characterized by few pauses and hesitations and an optimal speaking rate (not too slow and not too fast). The scales contained no numerical markings to capture the raters’ impressionistic judgments, but the endpoints were clearly labeled with a negative anchor point (on the left) and a positive anchor point (on the right). For comprehensibility, the endpoints were hard to understand and easy to understand; for accentedness, they were heavily accented and no accent at all; and for fluency, they were not fluent at all and very fluent. The initial slider position was always in the middle.
The raters first received a paper-based training manual that introduced the three target constructs along with several other dimensions that are not discussed here (e.g., emotionality, story richness, interest in story). After resolving any questions, the raters independently assessed two practice videos. After rating the practice videos and confirming that they understood the rating task, they proceeded to assess the 20 target videos. All videos were automatically played only once, and the raters assigned ratings after the entire video was played. The videos were presented to each rater in a unique random order. After completing the session, the raters answered debrief questions about their ratings and filled out background questionnaires.
DATA ANALYSIS
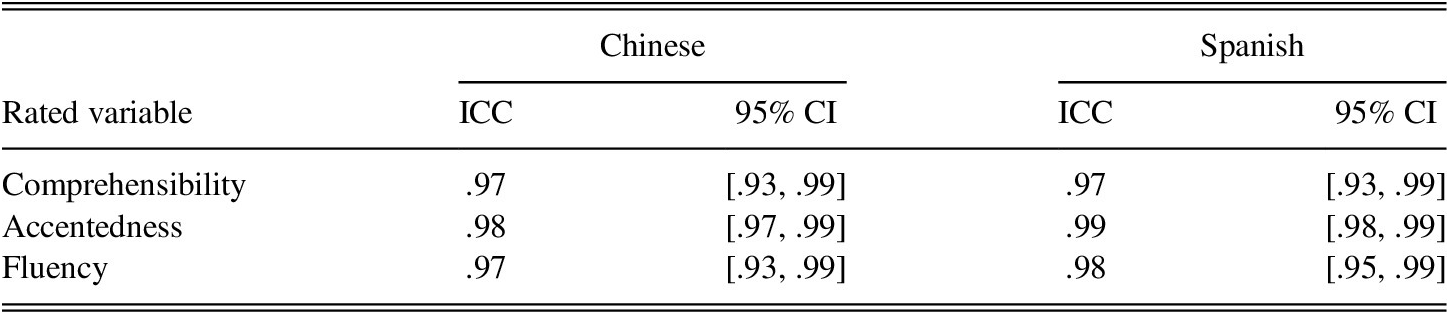
All speech ratings were first checked for internal consistency using two-way, consistency, average-measure intraclass correlations (ICCs), separately by speaker group (L1 Chinese, L1 Spanish). As summarized in Table 4, ICC values were very high.
Interrater reliability for speech ratings across 60 raters by speaker group

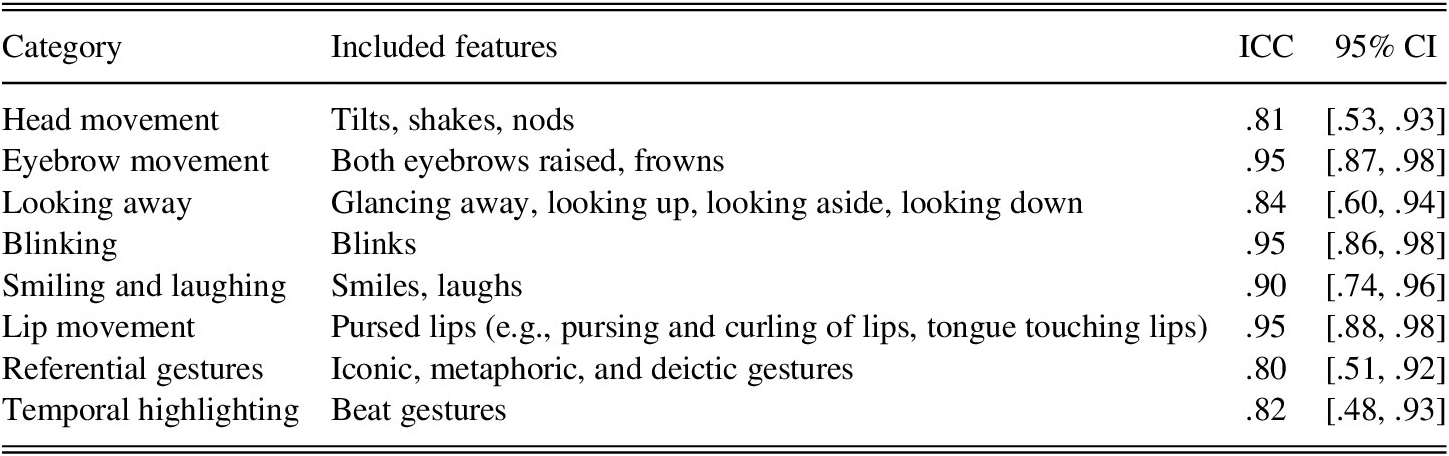
To examine L2 speakers’ use of visual cues, the videos were analyzed for facial expressions and hand gestures. The coding followed a bottom-up, data-driven approach because there were no a priori expectations for which visual cues may be related to global L2 speech ratings. Initially, the first and second researchers independently watched four sample videos to identify facial expressions and gestures that occurred in each video. Based on their occurrence in the dataset, facial expressions and head movements were classified, through discussion, into six major categories, as summarized in Table 5. To identify hand gestures, the researchers watched each video without volume to avoid influence from speech (Gullberg, Reference Gullberg2010). Hand gestures were defined in reference to a gesture phrase that happened between major resting positions around the stroke, which refers to the most effortful movement expressing a meaning (Stam & Buescher, Reference Stam, Buescher, Phakiti, DeCosta, Plonsky and Starfield2018). Because of low incidence of iconic gestures (illustrating the shape of an object or the motion of an action), metaphoric gestures (representing a concrete image to communicate an abstract idea), and deictic gestures (pointing a finger to indicate an object), they were merged into one category (referential gestures), but beat gestures were kept as a stand-alone category. After establishing the categories for coding facial expressions and hand gestures, the second researcher independently watched all videos and recorded raw frequency counts per category. The first researcher then reviewed all coding decisions, and any disagreement was resolved through discussion. Finally, a trained research assistant independently coded all videos to assess reliability. Two-way mixed, agreement, average-measure ICCs all exceeded .80, so the second researcher’s frequency counts were used in all further analyses. Because the videos for L1 Chinese and L1 Spanish speakers did not differ in length (see Table 2) and because all raters experienced the same materials with or without access to visual cues (depending on the condition), analyses of visual cues were based on raw (nonnormalized) frequency counts.
Interrater reliability for coding of visual cues

STATISTICAL MODELING
To address the first research question, which asked whether access to visual cues contributed to the variance in L2 speech ratings, we computed linear mixed-effects models in R (version 4.0.2; R Core Team, 2020) using the lme4 package (version 1.1-23; Bates et al., Reference Bates, Maechler, Bolker and Walker2015). In each set of models, comprehensibility, accentedness, and fluency served as the outcome variables while condition (audio only, audio with expressions, full video), speakers’ L1 (Chinese, Spanish), and their interaction served as fixed-effects predictors, and raters (60) and speakers (20) were entered as random-effects predictors, which yielded a total of 1,200 observations per model. In addition, each model included three fixed effects as control covariates to account for potential between-speaker differences in L2 proficiency and use: (a) length of residence in Canada, (b) self-assessed L2 speaking and listening proficiency1 (mean across separate self-ratings for speaking and listening on a 9-point scale), and (c) self-reported amount of daily L2 use (mean across separate estimates for English use at home, work, and school on a 0–100% scale). All continuous fixed-effects predictors were z-transformed to improve the interpretability of results, so that estimates for predictor variables could be interpreted in relation to the intercept (i.e., the grand mean) of the outcome variable. Among categorical predictors, the audio only (image) condition and the Chinese group were designated as the reference groups. However, because the condition variable included three levels, to obtain model estimates for the final comparison (audio with expressions vs. full video), the model was releveled, such that the audio with expressions condition was designated as the reference group. To perform multiple comparisons for the condition variable (audio only vs. audio with expressions vs. full video), a Tukey correction for p values was applied using the glht package in R (version 1.5.1; Lenth, Reference Lenth2020).2
To address the second research question, which focused on visual cues associated with rater assessments of L2 speakers’ comprehensibility, accentedness, and fluency, we computed another set of linear mixed-effects models to explore the relationship between L2 speech ratings and the coded visual cues in the full video condition, where all visual cues were available to the raters. In each set of models, comprehensibility, accentedness, and fluency served as the outcome variables while speakers’ L1 (Chinese, Spanish), eight visual cues (head movement, eyebrow movement, looking away, blinking, smiling and laughing, lip movement, referential gestures, temporal highlighting) and their interaction with speakers’ L1 served as fixed-effects predictors, and raters (60) and speakers (20) were entered as random-effects predictors (for a total of 400 observations per model). The Chinese group was designated as the reference group, and the raw counts of visual cues were z-transformed. Because these analyses were conducted using a smaller dataset, we did not include speaker-level covariates in these models to ensure they were sufficiently simple to converge (Baayen et al., Reference Baayen, Davidson and Bates2008).
All models for both research questions were fit using the maximum likelihood method, and model fit was evaluated through pairwise likelihood ratio tests (Barr et al., Reference Barr, Levy, Scheepers and Tily2013), comparing simpler to more complex models. Random slope models were examined, separately for raters and speakers. However, the inclusion of random slopes did not improve model fit for any outcome variable or the models did not converge, so only the random intercepts of speakers and raters were included in the final models. For selecting fixed-effects predictors, we took an exploratory approach by forward-testing the predictors, and then tested the interactions only when the inclusion of a predictor improved model fit. Although there are no agreed-upon criteria for estimating adequate sample sizes for mixed-effects models (Maas & Hox, Reference Maas and Hox2005; McNeish & Stapleton Reference McNeish and Stapleton2016), the estimates provided by Scherbaum and Ferreter (Reference Scherbaum and Ferreter2009) suggested that a sample of 20 speakers and 60 raters was sufficient to achieve power of .80 with a medium effect size. Therefore, the current data sample was deemed sufficiently large for mixed-effects modeling. Similarly, because there is no consensus regarding the criteria for considering statistical significance in mixed-effects modeling, for example, with some researchers using t values greater than 2 to imply statistical significance (Linck & Cunnings, Reference Linck and Cunnings2015), we obtained p values using MuMIn package in R (version 1.43.17, Bartoń, Reference Bartoń2020) but examined 95% confidence intervals (CIs) to check the statistical significance of each parameter (interval does not cross zero).
RESULTS
RATERS’ ACCESS TO VISUAL CUES
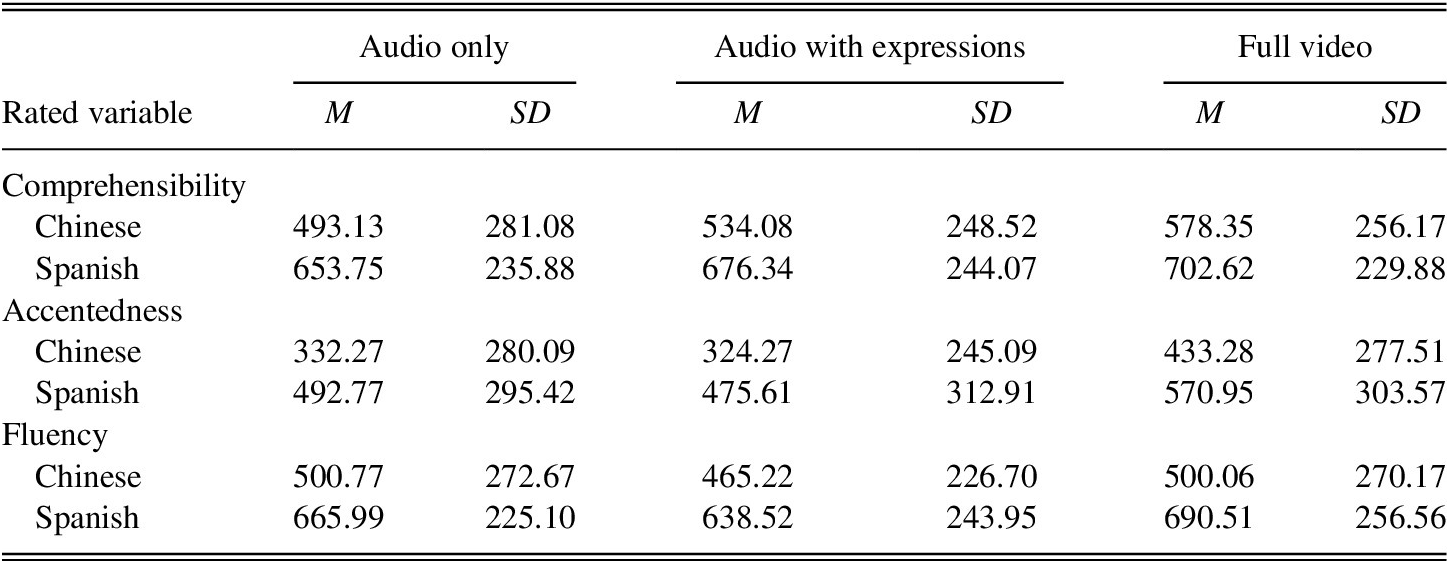
The first research question asked whether there was a difference in comprehensibility, accentedness, and fluency ratings based on the raters’ access to an L2 speaker’s visual cues. As shown in Table 6, descriptively the Chinese speakers generally elicited lower ratings from the raters than the Spanish speakers, and comprehensibility and accentedness (but not fluency) ratings tended to increase from the visually least informative condition (audio only) to the most informative condition (full video).
Summary statistics for speech ratings by condition and speaker group

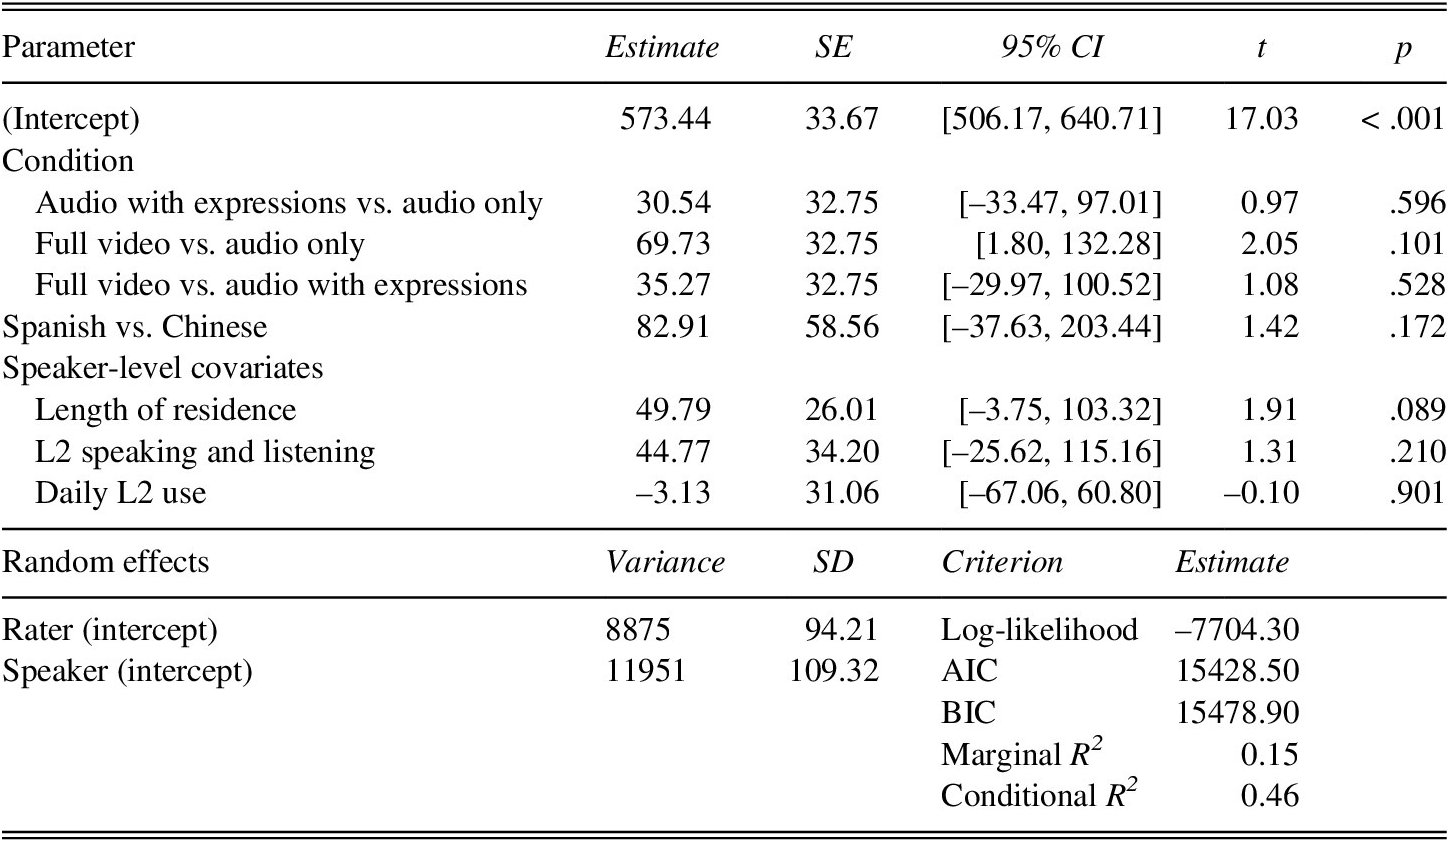
Table 7 summarizes the final mixed-effects model for comprehensibility. The interaction between condition and speakers’ L1 was not significant, Estimate = –36.36, SE = 27.19, t = –1.34, p = .182, and it did not improve model fit, χ2(2) = 1.79, p = .409, so the interaction term was excluded from the final model. With respect to the role of visual cues, there were no statistically significant differences in comprehensibility ratings across the three conditions, suggesting that comprehensibility did not vary dramatically based on the raters’ access to a speaker’s visual cues. However, the raters who had access to the full video tended to provide higher ratings than those with access to audio only (on average +70 points on a 1,000-point scale). Although this difference was not statistically significant after a conservative (Tukey) adjustment for multiple comparisons (p = .101), this finding is nevertheless noteworthy, inasmuch as the 95% CI for this effect did not cross zero and the t value was greater than 2 (Linck & Cunnings, Reference Linck and Cunnings2015). At minimum, the raters appeared to demonstrate an upward trend in their comprehensibility ratings (see Table 6) from the least visually informative condition (audio only) to the most visually informative situation (full video). In terms of speakers’ L1, although the magnitude of the estimate was large, the raters assigned similar comprehensibility ratings to the Spanish and Chinese speakers after we controlled for speaker-level covariates capturing various aspects of the speakers’ self-assessed L2 proficiency and use (length of residence, speaking and listening proficiency, daily L2 use). None of the covariates explained any additional model variance in comprehensibility ratings.
Summary of final mixed-effects model for comprehensibility

Note: AIC = Akaike information criterion, BIC = Bayesian information criterion, marginal R2 = variance explained by fixed factors, conditional R2 = variance explained by fixed and random factors. Final model formula: Comprehensibility ~ condition + speakers’ L1 + length of residence + L2 speaking and listening + daily L2 use + (1|speaker) + (1|rater).
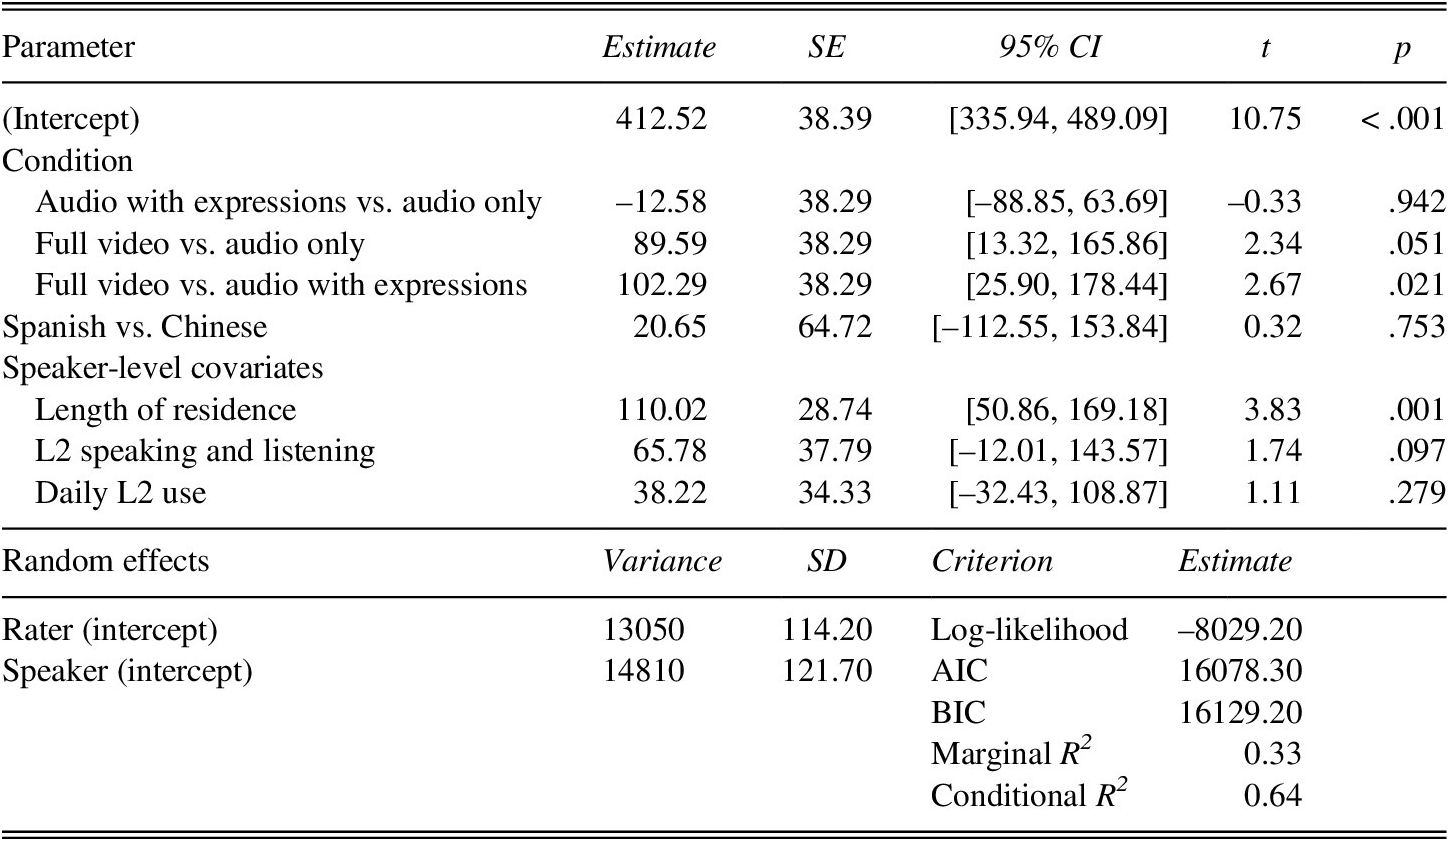
Table 8 summarizes the final mixed-effects model for accentedness. As with comprehensibility, the interaction between condition and speakers’ L1 was not statistically significant, Estimate = –22.82, SE = 25.36, t = –0.90, p = .368, and it did not improve model fit, χ2(2) = 0.82, p = .663; therefore, the interaction term was excluded from the final model. With respect to the role of visual cues, accentedness ratings in the full video condition were significantly higher than those in the audio only condition (p = .051) and in the audio with expressions condition (p = .021), which did not differ between each other. Thus, the raters who had access to both facial expressions and gestures perceived the speakers as being significantly less accented than those seeing only static images (+90 points) and those exposed only to the speakers’ facial expressions (+102 points). For speakers’ L1, as with comprehensibility, the effect of speaker group was not significant after controlling for speaker-level covariates. However, the speakers’ length of residence in Canada accounted for additional variance in accentedness ratings (p = .001), such that the speakers with longer residence in Canada (regardless of the visual condition they were evaluated in) were rated as less accented (+110 points) than those with shorter residence in Canada.
Summary of final mixed-effects model for accentedness

Note: AIC = Akaike information criterion, BIC = Bayesian information criterion, marginal R2 = variance explained by fixed factors, conditional R2 = variance explained by fixed and random factors. Final model formula: Accentedness ~ condition + speakers’ L1 + length of residence + L2 speaking and listening + daily L2 use + (1|speaker) + (1|rater).
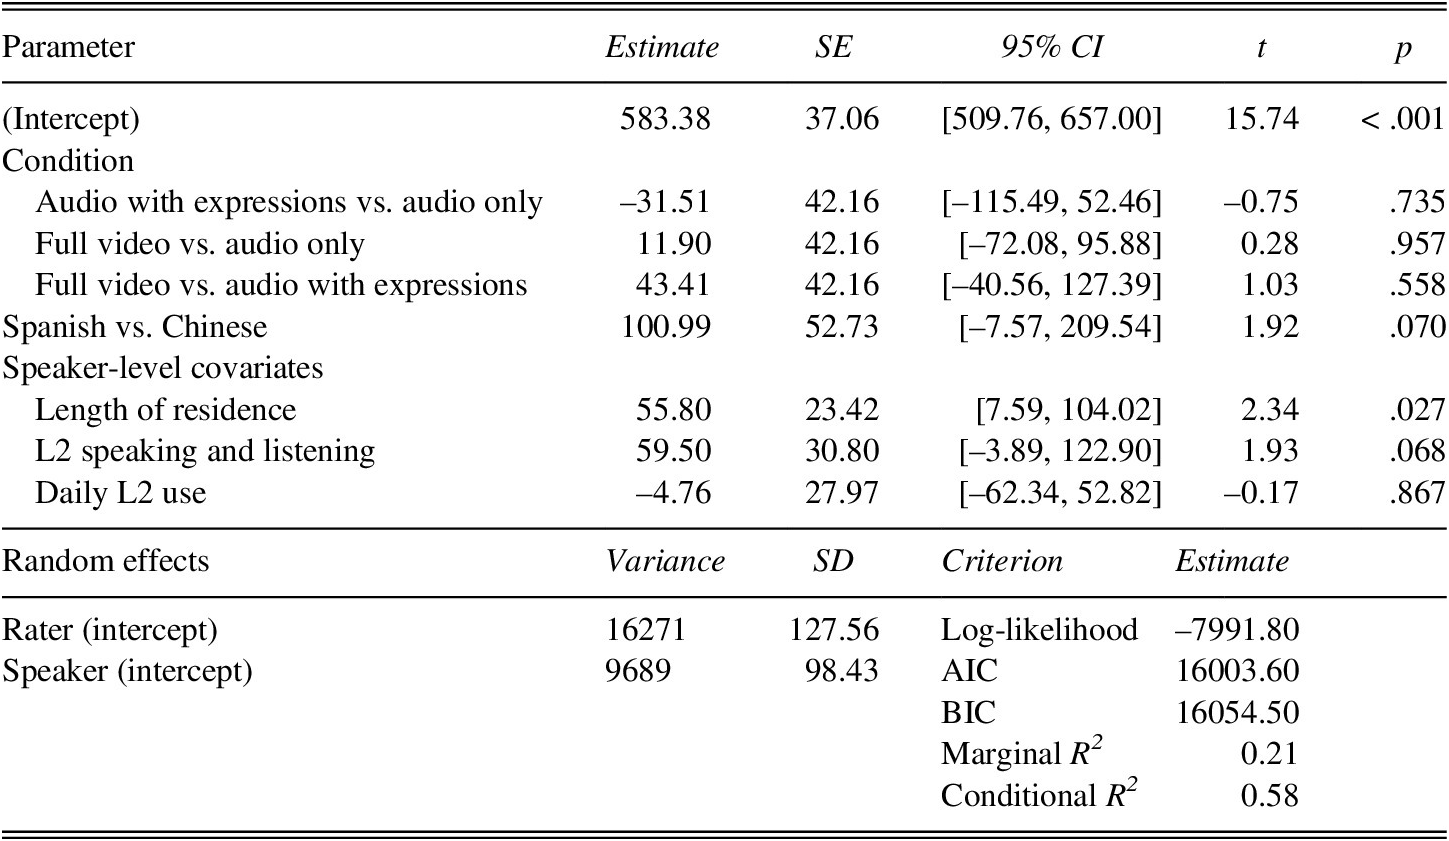
Table 9 summarizes the final mixed-effects model for fluency. Again, the interaction between condition and speakers’ L1 was not significant, Estimate = 25.23, SE = 24.49, t = –1.03, p = .303, and it did not improve model fit, χ2(2) = 1.11, p = .575, so the interaction term was not included in the final model. As for the role of visual cues, there were no significant differences in fluency ratings across the three conditions, suggesting that the raters’ perceptions of speaker fluency did not vary dramatically based on access to a speaker’s visual cues. After controlling for speaker-level covariates, although the magnitude of the estimate was large, there were again no differences between the fluency ratings assigned to the two L1 speaker groups. However, as with accentedness, the speakers’ length of residence in Canada accounted for additional variance in fluency (p = .027), such that the speakers who resided in Canada longer elicited higher fluency ratings (+56 points) than the speakers with shorter residence in Canada.
Summary of final mixed-effects model for fluency

Note: AIC = Akaike information criterion, BIC = Bayesian information criterion, marginal R2 = variance explained by fixed factors, conditional R2 = variance explained by fixed and random factors. Final model formula: Fluency ~ condition + speakers’ L1 + length of residence + L2 speaking and listening + daily L2 use + (1|speaker) + (1|rater).
SPECIFIC VISUAL CUES AND L2 SPEECH RATINGS
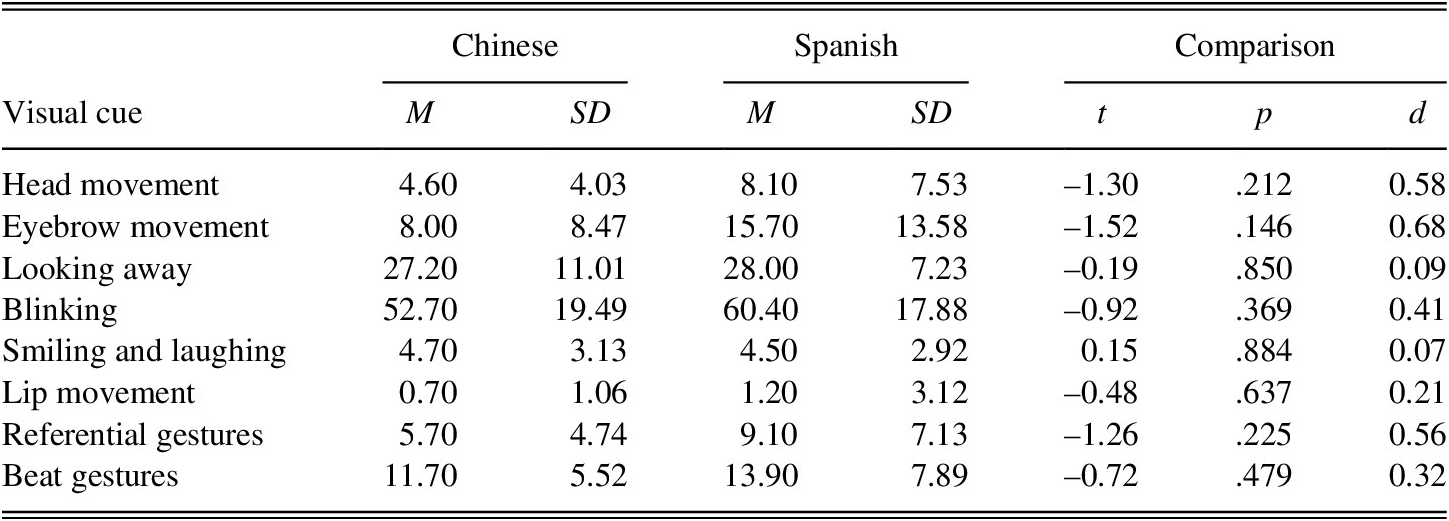
The second research question explored the relationship between L2 speakers’ use of individual visual cues (e.g., facial expressions, head movement, hand gestures) and rater perceptions of these speakers’ comprehensibility, accentedness, and fluency. This question also examined whether this relationship varied by speaker background (Chinese vs. Spanish) because the use of visual cues might differ across different cultures (Kita, Reference Kita2009; Nicoladis et al., Reference Nicoladis, Nagpal, Marentette and Hauer2018). Table 10 summarizes descriptive statistics for the occurrence of visual cues in the full video condition (i.e., where all visual cues were presumably accessible to the raters). The Chinese speakers generally tended to move their eyebrows less frequently (–6.35 counts per video), produced fewer head movements (–3.75 counts), and made fewer referential gestures (–2.65 counts) than the Spanish speakers, but no differences across any coded categories reached statistical significance, implying that (at least in this dataset) both speaker groups produced comparable frequencies of visual cues in the videos.
Descriptive statistics for occurrence of visual cues in full videos by speaker group

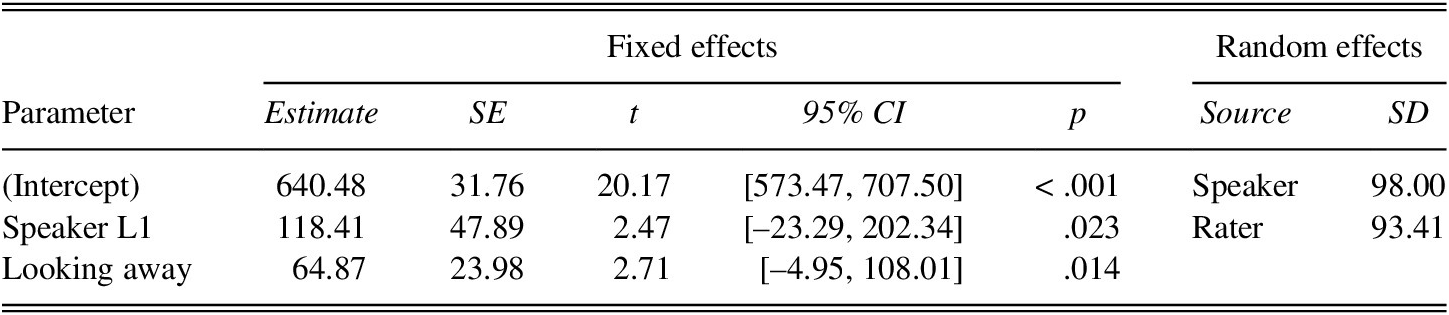
For comprehensibility (with the final model summarized in Table 11), among the eight visual cues examined, looking away was the only fixed-effects predictor that improved model fit compared to the baseline model (p = .014). The frequency of looking away did not interact with speakers’ L1, Estimate = 37.01, SE = 51.61, t = 0.72, p = .482, and did not improve model fit, χ2(1) = 0.51, p = .476, so the interaction term was excluded from the model. The speakers who tended to look away from their interlocutor more frequently elicited higher comprehensibility ratings from the raters (+65 points), compared to the speakers who engaged in this visual behavior less frequently. Although the Spanish speakers were generally rated as more comprehensible (+118 points) than the Chinese speakers, this result should be interpreted with caution because the 95% CI crossed zero. In addition, to minimize model complexity and maximize result interpretation, mixed-effects modeling for the second research question did not include speaker-level covariates, which tended to explain between-speaker differences in previous analyses.
Summary of final mixed-effects model for comprehensibility and visual cues

Note: Final model formula: Comprehensibility ~ speakers’ L1 + looking away + (1|speaker) + (1|rater).
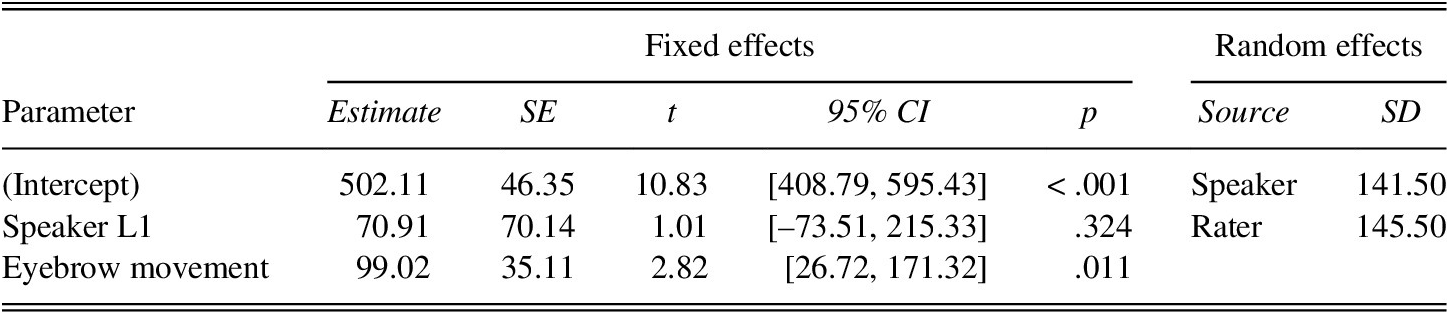
For accentedness (Table 12), only eyebrow movement emerged as a significant predictor (p = .011), and the frequency of eyebrow movement did not interact significantly with speakers’ L1, Estimate = 127.01, SE = 72.77, t = 1.75, p = .097, or improved model fit, χ2(1) = 2.83, p = .092. The speakers who moved their eyebrows more frequently were rated as less accented (+99 points) than the speakers who engaged in this visual behavior less often. Speakers’ L1 (Chinese vs. Spanish) did not explain additional variance in accentedness ratings.
Summary of final mixed-effects model for accentedness and visual cues

Note: Final model formula: Accentedness ~ speakers’ L1 + eyebrow movement + (1|speaker) + (1|rater).
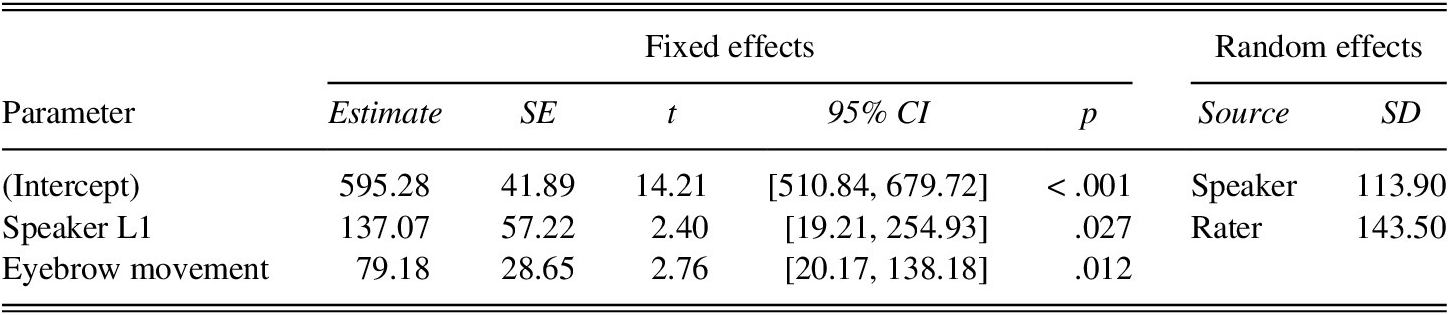
For fluency (Table 13), again, eyebrow movement was the only significant fixed-effects predictor (p = .012), and the frequency of eyebrow movement did not interact with speakers’ L1, Estimate = 56.20, SE = 62.52, t = 0.90, p = .380, or improved model fit, χ2(1) = 0.79, p = .374. The speakers who moved their eyebrows more frequently elicited higher fluency ratings from the raters than the speakers who showed less eyebrow movement (+79 points). The Spanish speakers were also generally rated higher than the Chinese speakers (+137 points); however, to minimize model complexity and maximize result interpretation, mixed-effects modeling for this research question did not include speaker-level covariates, which tended to explain between-speaker differences in previous analyses.
Summary of final mixed-effects model for fluency and visual cues

Note: Final model formula: Fluency ~ speakers’ L1 + eyebrow movement + (1|speaker) + (1|rater).
DISCUSSION
This study’s main objective was to examine whether rater assessments of L2 comprehensibility, accentedness, and fluency vary as a function of visual cues (facial expressions, hand gestures) available to raters. An additional goal was to explore possible relationships between individual visual cues (e.g., blinking, eyebrow movements, beat gestures) and raters’ evaluations of comprehensibility, accentedness, and fluency for speakers from different L1s (Chinese, Spanish), on the assumption that speakers from different backgrounds might vary in their use of visual cues. Visual information appeared to impact raters in their evaluations of L2 accentedness (with a similar trend for comprehensibility) but not fluency, such that the raters who had access to the full, dynamic videos (full video condition) rated L2 speakers as less accented and also tended to judge them as more comprehensible than the raters who evaluated the same speakers while looking at their static images (audio only condition). Although the Chinese speakers generally elicited lower evaluations from the raters than the Spanish speakers, these differences could be accounted for through individual differences in the speakers’ L2 proficiency and use (used as control covariates). Most importantly, there were few differences across the Chinese and Spanish speakers in their production of various visual cues, and the speakers’ language background did not interact with visual condition, implying that the impact of visual cues on the raters was similar for the speakers from the Chinese and Spanish backgrounds. In terms of specific visual cues associated with ratings, frequent eyebrow movements were associated with less accented and more fluent speech, while frequent looks away were linked to higher comprehensibility.
ROLE OF VISUAL CUES IN L2 SPEECH RATINGS
For comprehensibility, although only the difference between the static and the fully dynamic viewing conditions approached significance after a conservative adjustment for multiple comparisons, the raters tended to progressively enhance their evaluations as more visual information was available to them, assessing L2 speakers on average at 573 (on a 1,000-point scale) when looking at static images, at 605 when having access to facial expressions but not gestures, and at 640 while watching the entire video (facial expressions along with gestures). An incremental, additive effect of visual cues on comprehensibility is consistent with raters’ using the aural input in addition to various cues available from a speaker’s face, with additional support from gestures (Sueyoshi & Hardison, Reference Sueyoshi and Hardison2005). In terms of facial expressions, in addition to a speaker’s looks away from the interlocutor, the raters may have generally benefited from seeing a speaker’s articulatory configurations (e.g., lip and jaw movement) and facial cues (e.g., eyebrow raises co-occurring with speech rhythm), which highlighted linguistic information (Chui, Reference Chui2005; Swerts & Krahmer, Reference Swerts and Krahmer2008) and made it easier to understand the speaker. Similarly, a speaker’s visual display of emotional reactions (e.g., surprise, confusion), particularly in an emotion-laden task such as exchanging close-call narratives, may have helped the raters anticipate what kind of information was going to be shared (Wagner, Reference Wagner2008), thereby decreasing their processing effort.
For accentedness, there was no evidence of an incremental, additive effect, in the sense that the raters perceived a speaker as less accented only when the full dynamic video was available to them, assessing the speakers on average at 502 (on a 1,000-point scale), compared to the situation when the raters had no access to visual information (412) or when they observed a speaker’s dynamic face but no gestures (400). This finding, which implies that the visual cues available in a speaker’s face presented alone (with no hand gestures) were largely inconsequential to rater evaluations of accent, aligns well with prior work on visual cues in phoneme-focused tasks, where listeners did not benefit from seeing a speaker’s face in their identification of L2 vowels (Inceoglu, Reference Inceoglu2019) or in their transcription of monosyllabic verbs spoken with or without vowel errors (Wheeler, Reference Wheeler2019).3
The raters seemed to benefit the most from having access to a speaker’s gestures, as only the full dynamic condition resulted in significantly enhanced accentedness (i.e., with speakers rated as less accented) and in a similar trend for increased comprehensibility (i.e., with speakers rated as more comprehensible), relative to the other viewing situations. Although the visual behaviors with the strongest links to comprehensibility and accentedness in the full video condition were a speaker’s eyebrow movements and looks away from the interlocutor (see Tables 11 and 12), it is possible that a speaker’s hand gestures—and especially beat gestures that were the most prevalent gesture category—provided complementary visual information to the raters, leading them to perceive the speaker as being easier to understand and less accented. At minimum, beat gestures highlighted prosodic structure for the listener, which simplified speech segmentation, and emphasized particularly important content, which aided listener comprehension (Drijvers & Özyürek, Reference Drijvers and Özyürek2017, Reference Drijvers and Özyürek2020; Hardison, Reference Hardison2018; Sueyoshi & Hardison, Reference Sueyoshi and Hardison2005; Wheeler, Reference Wheeler2019). Alternatively, the use of gestures may have allowed speakers to project a greater level of speaking proficiency or confidence (Neu, Reference Neu, Scarcella, Andersen and Krashen1990), which may have been captured in less accented (and more comprehensible) speech ratings from the raters who had access to gestures.
The positive impact of the full audiovisual viewing condition on rater evaluations of accentedness may have also stemmed from other visual cues available in the full video but absent in the other conditions. Apart from a speaker’s hand gestures, the full video condition allowed the raters to observe a speaker’s body posture and body movement, which may have influenced the ratings. For example, a speaker’s relaxed body position might signal confidence to raters, leading them to evaluate the speaker more favorably in job interviews (Jenkins & Parra, Reference Jenkins and Parra2003) and perhaps also to upgrade the speaker in their ratings. Similarly, natural body movements (e.g., leaning forward, turning, raising shoulders), particularly if they are congruent with discourse content and are synchronized with the social cues provided by the interlocutor, might be perceived as showing greater engagement (e.g., Hardison, Reference Hardison2018) and might therefore contribute to enhanced ratings. Put differently, access to the full, embodied representation of the speaker telling a story may have assisted the raters in predicting story content, resolving potential ambiguities, and ultimately arriving at mutual understanding (Hostetter & Alibali, Reference Hostetter and Alibali2008), which may have been captured in rater evaluations of speakers’ accentedness (and possibly comprehensibility).
Finally, when it comes to fluency ratings, there were no differences across the three viewing conditions in assessments of L2 speakers’ fluency, suggesting that fluency ratings are not susceptible to the effects of input modality, at least in this study (but see Nakatsuhara et al., Reference Nakatsuhara, Inoue and Taylor2021). Fluency ratings can largely be accounted for by temporal measures of speech, such as articulation speed, pausing, and syllable length (Bosker et al., Reference Bosker, Pinget, Quené, Sanders and de Jong2013; Kahng, Reference Kahng2018). For instance, when raters assessed L2 speakers’ audios, as much as 84% of the total variance in fluency ratings could be attributed to temporal measures, including mean length of syllables and frequency and duration of pausing (Bosker et al., Reference Bosker, Pinget, Quené, Sanders and de Jong2013). Because temporal dimensions of speech would likely be salient to the listener from the audio channel alone, with or without access to visual cues, it is unsurprising that visual information made little contribution to rater-assessed fluency.
SPECIFIC VISUAL CUES AND L2 SPEECH RATINGS
An additional goal of this study was to examine which individual visual cues are associated with rater perceptions of L2 comprehensibility, accentedness, and fluency for speakers from different language backgrounds. The L1 Chinese and Spanish speaker groups were examined separately, on the assumption that the use of visual cues might be related to speakers’ linguistic or cultural background (Gullberg, Reference Gullberg2006; Iverson et al., Reference Iverson, Capirci, Volterra and Goldin-Meadow2008; Kita, Reference Kita2009). Contrary to our expectations, there were few differences in the use of visual cues between the two speaker groups (see Table 10), which implies that the occurrence of visual behaviors during conversation may not always be attributable to cultural or linguistic differences, at least in interactions involving two university-level students using English to communicate with each other. Additionally, L2 speakers’ language background did not interact with the visual condition to yield a difference in ratings for either group, which suggests that the raters relied on visual information in similar ways as they evaluated speakers from both language backgrounds. Lastly, L1 group effects were either weak or inconsistent (e.g., with 95% CI crossing zero) in the analyses of specific visual cues used by the speakers. Instead, individual differences in speakers’ proficiency and use, such as their length of residence in Canada, predicted their accentedness and fluency ratings, highlighting the experiential dimension of pronunciation learning.
Although comparisons across the three visual conditions only implied that some visual cues may have factored into the raters’ assessments, focused analyses of individual visual cues provided (preliminary) evidence of the relevance of specific cues to each rating. Briefly, when all visual cues were available to raters (i.e., in the full video condition), eyebrow movements, such as raises and frowns, were positively associated with the raters’ assessments of accentedness and fluency. Eyebrow movement is known to highlight speech prosody by signaling important content and marking phrase boundaries (Pelachaud et al., Reference Pelachaud, Badler and Steedman1996), and the raters may have benefited from this information (to a greater or lesser extent) because it enhanced prosodic cues to speech segmentation and comprehension (Krahmer & Swerts, Reference Krahmer and Swerts2007). In this dataset, eyebrow movement seemed to co-occur with speakers’ use of hand gestures to highlight their production of prosodic (nuclear) stress in an intonation phrase, as illustrated in the following examples (where | marks a phrase boundary, italics designate the word carrying nuclear stress, and ↑ indicates the location of an eyebrow raise along with a speaker’s use of a hand gesture).
S200: and in the ↑back | because it’s a vehicle that’s a little bit ↑bigger | it has a fire extinguisher that’s ↑attached | just in case there’s a ↑fire
S101: I feel very like ↑relaxed | and I want to hang out | and I went to ↑shopping mall
For some speakers, such as S200, many nuclear stresses coincided with an eyebrow movement and a beat (hand) gesture, whereas for others, like S101, only some stresses were accompanied by such visual cues. Yet even infrequent visual signals (especially when they involve dual cues, such as an eyebrow raise and an up-down hand gesture) may have enhanced L2 speakers’ use of prosody for the raters, highlighting important content (Hardison, Reference Hardison2018; Krahmer & Swerts, Reference Krahmer and Swerts2007) and leading to more favorable evaluations of L2 speakers. That such favorable assessments extended to accentedness and fluency is not altogether surprising, given strong links between prosody and accentedness (Kang, Reference Kang2010) and fluency (Préfontaine & Kormos, Reference Préfontaine and Kormos2016). What must be clarified in future work, however, is whether temporal highlighting of prosody through facial expressions (e.g., eyebrow movement) is more salient and thus more useful for raters as a cue, with and without temporal highlighting through hand gesture.
Looking away (breaking eye contact) was the only visual cue associated positively with comprehensibility. Looking away may have been particularly beneficial for the raters because speakers tend to look away during speech planning or when processing complex information (Knapp & Hall, Reference Knapp and Hall2001). Continuous eye contact with an interlocutor appears to interfere with a speaker’s production of spontaneous speech (Beattie & Hughes, Reference Beattie and Hughes1987), whereas gaze aversion, particularly during complex tasks, seems to aid a speaker in cognitive functioning, leading to improvement in performance, such as when answering complex arithmetic and reasoning questions (Glenberg et al., Reference Glenberg, Shroeder and Robertson1998). Inspection of the data indeed showed that the L2 speakers most frequently looked away while pausing, presumably when they were planning their next utterance (Beattie & Hughes, Reference Beattie and Hughes1987) or dealing with an increased arousal while describing personally relevant emotional experiences (MacPherson et al., Reference MacPherson, Abur and Stepp2017). As illustrated in the following examples, for some speakers, such as S52, looking away (enclosed in brackets) coincided with filled pauses or hesitations, while for others, like S269, looking away occurred at phrase boundaries.
S52: I almost got robbed uh … on the street [by uh by uh … like] three or two kids [and uh … it was uh …] it was the night, and I walk with my friends [and uh we were walking uh] in a dark street
S269: I was spending the whole week doing this project [look away] so I almost lost it [look away] but then I remember I send it in my iCloud [look away] so when I open my computer I had to start my computer again
Also, the frequency of L2 speakers looking away from their interlocutor likely captured the attested tendency for listeners to look at their interlocutor’s face for sustained periods but for speakers to alternate between brief eye gazes to the interlocutor and looks away (Bavelas et al., Reference Bavelas, Coates and Johnson2002; Turkstra, Reference Turkstra2005). It may well be, then, that those L2 speakers who engaged in such expected behaviors (i.e., alternating their eye gaze between looking at their partner and looking away, without staring at the interlocutor while speaking) tended to be evaluated higher by the raters. An interim conclusion, until confirmed in future work, is that looking away not only was the behavior associated with speech planning, which may have promoted cohesive storytelling, but also one that was expected by an external observer, with the consequence that this visual behavior alleviated at least some processing burden for the raters.
In this dataset, the coded categories of blinking, lip and head movement, instances of laughter and smiling, and referential gestures were not associated with any rater-assessed speech dimensions. Although blinking as well as lip and head movement have been shown to facilitate listeners’ processing of linguistic information in speech, typically in phoneme-focused tasks (Drijvers & Özyürek, Reference Drijvers and Özyürek2017, Reference Drijvers and Özyürek2020; Munhall et al., Reference Munhall, Jones, Callan, Kuratate and Vatikiotis-Bateson2004; Zheng & Samuel, Reference Zheng and Samuel2019), this work generally targeted specific articulatory configurations (e.g., lip rounding in production of particular vowels) through fine-grained measures, such as movement velocity, distance between lips, or angles of head movement. By contrast, in this study, L2 speakers’ blinking as well as lip and head movements were coded broadly (e.g., pursing and curling of lips, tongue touching lips), without any reference to specific articulatory configurations, which may explain why these categories were not strongly linked to L2 speech assessments. As for instances of positive emotion (smiling, laughter) and referential gestures, our findings (at least with respect to gestures) may seem to contradict prior work showing positive contribution of gesture to improving word-level intelligibility (Drijvers & Özyürek, Reference Drijvers and Özyürek2017, Reference Drijvers and Özyürek2020; Wheeler, Reference Wheeler2019) and utterance-level comprehension (Sueyoshi & Hardison, Reference Sueyoshi and Hardison2005). However, the lack of strong associations involving positive emotion and referential gestures could be partly explained by the relatively infrequent use of these cues in this dataset (see Table 10), which made it challenging for meaningful associations to emerge. Also, it is plausible that raters may attend to not only frequency but also function (Gullberg et al., Reference Gullberg, De Bot and Volterra2008) and appropriateness (Jenkins & Parra, Reference Jenkins and Parra2003) of referential gestures and displays of positive emotion when assessing L2 speech. Therefore, these issues may need to be revisited in a targeted future investigation using a larger, more representative dataset.
IMPLICATIONS, LIMITATIONS, AND FUTURE WORK
The current findings offer several implications for the use of visual stimuli in L2 speech assessment. In the context of a global health crisis, people are increasingly taking advantage of multimedia, such as videoconferencing tools, with visual stimuli now routinely used for language training and testing. Because having access to facial expressions and hand gestures appears to enhance perceptions of L2 speech for the listener (particularly for accentedness), whenever possible, L2 speakers may benefit from choosing video over an audio format, for instance, for communication involving work, online learning, or job interviews. In terms of instruction, teachers might wish to raise L2 speakers’ awareness of the potential relevance of visual cues (e.g., eyebrow raises) to listener perceptions (Hardison, Reference Hardison2018), particularly for such listener-centered constructs as accentedness and comprehensibility. In terms of language assessment, our results are in agreement with Nakatsuhara et al.’s (Reference Nakatsuhara, Inoue and Taylor2021) findings, where test-takers’ speaking performances elicited higher IELTS scores in terms of fluency, lexis, grammar, and pronunciation in the video and live (face-to-face) assessment conditions than in the audio condition. Taken together, these findings suggest that both trained test examiners and untrained raters are sensitive to visual cues when assessing L2 speech for a variety of rated dimensions. However, to understand the nature and scope of modality effects on rater-based assessments of L2 speech, researchers may need to examine whether specific speech ratings, such as fluency, might be more or less susceptible to modality effects as a function of rater training or experience. Researchers might also need to continue exploring modality effects for L2 comprehensibility and accentedness, with a focus on a potential threshold beyond which raters’ access to audiovisual information may no longer enhance their perceptions but instead may detract them from L2 speech (e.g., Mayer & Moreno, Reference Mayer and Moreno2003; Ockey, Reference Ockey2007), causing variability in performance.
To close, a few limitations to this exploratory work should be acknowledged. First, to provide a more nuanced understanding of language and culture differences in the impact of visual cues on the listener, future research needs to examine L2 speakers from more diverse language and culture backgrounds. Because only a select few visual cues emerged as relevant to L2 speech ratings (and only in quantitative analyses), it would be important to investigate rater perception of various visual cues through targeted qualitative investigations. Although we captured the incidence of some visual cues through frequency counts, future studies also need to capture not just the frequency of visual cues but also their function and appropriateness, which was outside the scope of this initial, exploratory work. Similarly, as shown by large differences between marginal and conditional R2 values in mixed-effects models, a substantial amount of variance in the ratings was attributable to random effects (i.e., individual differences) across speakers and raters. Although we have controlled for a few speaker-level covariates, researchers might wish to isolate such sources of variance targeting, for example, differences in L2 proficiency and personality for speakers (Gregersen et al., Reference Gregersen, Olivares-Cuhat and Storm2009; Hostetter & Potthoff, Reference Hostetter and Potthoff2012; O’Carroll et al., Reference O’Carroll, Nicoladis and Smithson2015) and variation in cognitive ability for raters (Chu et al., Reference Chu, Meyer, Foulkes and Kita2014; Smithson & Nicoladis, Reference Smithson and Nicoladis2013). Finally, because this study’s findings are associational in nature, we do not know if the raters noticed, attended to, or in any way processed specific visual cues available to them. While informal observations of the raters’ behaviors during the rating sessions suggested that they remained engaged with video stimuli, other methodologies must be employed to show whether and to what degree the listener attends to a speaker’s visual cues (e.g., Gullberg & Holmqvist, Reference Gullberg and Holmqvist2006). Thus, we call for future research using eye-tracking accompanied by stimulated recall to investigate raters’ cognitive processing while assessing L2 speech.
FUNDING
This research was supported by the Social Sciences and Humanities Research Council of Canada (SSHRC) grants 435-2016-1406 (to Pavel Trofimovich and Sara Kennedy) and 435-2019-0754 (to Kim McDonough and Pavel Trofimovich).
Appendix A
Instructions for the Close-Call Narrative Task
Close-Call Story
Tell about a close call or a near-miss incident that happened to you in as much detail as you can.
A close call is something that happened where you were almost hurt, or something scary or bad almost happened, but in the end everything turned out okay.
Make sure that you tell something that you are comfortable sharing.
To give you some ideas, people have told stories about skiing accidents, nearly losing a term paper on the computer, or getting lost.
Don’t hesitate to ask questions or exchange comments while your partner is sharing their story.
Appendix B
A Screenshot of the Rating Interface