Introduction
The mechanisms underlying neurodegeneration are multifactorial and include both genetic and environmental factors. An increasing body of evidence regards the spectrum of degenerative diseases that encompasses frontotemporal lobar degeneration (FTLD), the second most common cause of early-onset dementia, and amyotrophic lateral sclerosis (ALS), a multisystem disease primarily but not exclusively affecting motor abilities. These two neurological disorders have been recognized as representative of a neuropathological continuum as they share several common genetic, pathogenic, and clinical features.Reference Burrell, Halliday and Kril 1 – Reference Ling, Polymenidou and Cleveland 3 Notably, the finding that mutations on chromosome 9p have been independently described in both ALS and FTLD populations, as well as in ALS/FTLD cases, has allowed us to discover that exanucleotide expansions within the C9ORF72 gene represent a probable genetic link between the two syndromes.Reference De Jesus-Hernandez, Mackenzie and Boeve 4 , Reference Renton, Majounie and Waite 5 Furthermore, the advent of next-generation sequencing has led to the discovery of novel ALS-related genes and mutations in more than 20 genes that have been suggested to cause ALS/FTLD. These genes have been grouped according to their involvement in: protein quality control (i.e., C9ORF72; ubiquilin-2 [UBQLN2], TANK binding kinase 1 [TBK1]);Reference De Jesus-Hernandez, Mackenzie and Boeve 4 – Reference Cirulli, Lasseigne and Petrovski 7 cytoskeletal dynamics (i.e., TUBA4A);Reference Smith, Ticozzi and Fallini 8 RNA homeostasis (i.e., TAR DNA binding protein [TARDBP]; fused in sarcoma/translocated in liposarcoma [FUS/TLS]; matrin 3 [MATR3]);Reference Benajiba, Le Ber and Camuzat 9 – Reference Johnson, Pioro and Boehringer 11 and DNA damage response (i.e., FUS/TLS; never in mitosis A-related kinase 1 [NEK1]).Reference Cirulli, Lasseigne and Petrovski 7 , Reference Brenner, Müller and Wieland 12 Moreover, the main pathogenic pathways linked to all of these genes mutations are functionally connected to the process of intracytoplasmic aggregation of ubiquitinated proteins, such as TAR DNA binding protein-43 (TDP-43) or FUS, which may represent the neuropathological hallmarks of the ALS–FTLD continuum.Reference Arai, Hasegawa and Akiyama 13 , Reference Neumann, Sampathu and Kwong 14
Interestingly, among emerging pathogenic mechanisms linked to dysregulation of the axon guidance proteins, changes in neuronal connectivity and synaptic disruption have been revealed to play a probable causative role in triggering onset and progression of ALS and other neurodegenerative disorders.Reference Van Hoecke, Schoonaert and Lemmens 15 – Reference Van Battum, Brignani and Pasterkamp 17
From the phenotypical point of view, the continuum between ALS and FTLD is confirmed by the fact that a relevant, though variable in magnitude, degree of cognitive and/or behavioral impairment has been found in most patients with ALS,Reference Burrell, Halliday and Kril 1 , Reference Phukan, Pender and Hardiman 18 , Reference Ringholz, Appel, Bradshaw, Cooke, Mosnik and Schulz 19 while up to 15% of FTLD patients display symptoms typical of motor neuron degeneration, more commonly described in the behavioral variant subtype of FTLD (behavioral variant of frontotemporal dementia or bvFTD) and less frequently in the language variants, such as the nonfluent and semantic variants of primary progressive aphasia (PPA).Reference Burrell, Halliday and Kril 1
In consideration of the broadly described clinical, genetic, and pathological overlap between ALS and FTLD, in the last decades structural and functional neuroimaging correlates across this continuum have been increasingly investigated in order to discover radiological markers useful for differential diagnosis and clinical staging. Specifically, increasing investigations on brain connectivity, using both structural and resting-state functional magnetic resonance imaging (RS–fMRI) and magnetoenchefalography (MEG) analyses have considerably contributed to show patterns of widespread structural and functional abnormalities, principally involving frontal and temporal lobes, in several cohorts of ALS patients.Reference Abrahams, Goldstein and Suckling 20 – Reference Proudfoot, Rohenkohl and Quinn 31 Remarkably, in advanced stages of ALS, brain connectivity alterations were found to resemble those previously described in a number of cohorts of bvFTD patients.Reference Lillo, Mioshi, Burrell, Kiernan, Hodges and Hornberger 29 , Reference Trojsi, Esposito and de Stefano 30 , Reference Whitwell, Josephs and Avula 32 – Reference Lee, Khazenzon and Trujillo 37 To note, early extramotor involvement in ALSReference Phukan, Pender and Hardiman 18 – Reference Agosta, Canu and Valsasina 23 and damage of the corticospinal pathway and of the sensorimotor networks in bvFTDReference Lillo, Mioshi, Burrell, Kiernan, Hodges and Hornberger 29 , Reference Trojsi, Esposito and de Stefano 30 have been widely recognized. Moreover, since several structural studies have found significant WM extramotor abnormalities in cohorts of ALS patients without profound cognitive decline and explored in relatively early disease stages,Reference Agosta, Pagani and Rocca 21 , Reference Kasper, Schuster and Machts 38 – Reference Christidi, Karavasilis and Riederer 40 an early damage of extramotor regions in ALS might be a potential marker of clinical symptoms more evident in later disease stages, such as cognitive and behavioral alterations.
More recently, by using a “graph-theoretical” approach, which allows us to explore the organization of widespread structural and functional brain networks or “connectome,”Reference Van den Heuvel, Stam, Kahn and Hulshoff Pol 41 intriguing insights into reorganization of brain networks in neurodegenerative diseases have emerged.
Based on this background, considering the crucial role that could be played in the future by network-based approaches for better understanding and monitoring in vivo the potential connectivity changes in the neurodegenerative process, we reviewed the current knowledge about the most advanced neuroimaging findings revealed across the ALS– frontotemporal spectrum disorders (ALS–FTSDs),Reference Strong, Abrahams and Goldstein 42 emphasizing the perspectives in terms of identification of new potential neuroimaging markers for disease monitoring. In particular, given that increasing evidence showing that in the TDP-43 proteinopathies the neurodegenerative process spreads across the brain in a prion-like manner,Reference Feiler, Strobel and Freischmidt 43 it has been hypothesized that the quality of interactions and connections between distinct brain areas might reflect the underlying pathological process and might therefore be exploited to achieve better classification and monitoring of patients.
Connectivity and Brain Network Changes in the ALS–FTLD Continuum
Brain network connectivity: definition of basic network metrics
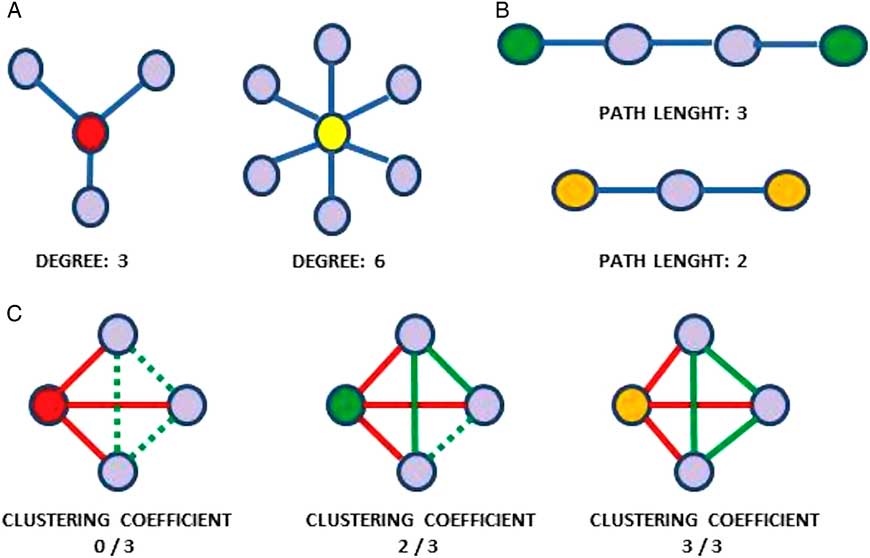
The term “connectivity” means the estimate of the relationship between brain areas in a pairwise fashion and, according to Friston et al.,Reference Friston, Worsley, Frackowiak, Mazziotta and Evans 44 it can be subdivided into structural, functional, and effective connectivity. However, considering that all the brain areas have been proven to be connected to each other and that specific properties of the brain emerge when several areas exert coordinated activity, it has been revealed how pairwise estimation might not capture most part of the integrated brain activity or even show unreliable information.Reference Bullmore and Sporns 45 To overcome this limitation, a possible approach is to consider the brain as a network that is defined as a set of nodes and edges.Reference Bullmore and Sporns 45 In particular, nodes are the brain areas while edges are the estimates of the relations between areas. The edges connecting the nodes allow defining the topology of the network, thus contributing to capture the relevant properties of the network itself or of its nodes. For instance, the number of edges of a given node, called “degree,” has been interpreted as a measure of the importance of that node in the network.Reference Thivard, Pradat and Lehéricy 46 Note that all the connections of a node across the brain contribute to its degree. Moreover, the minimum number of edges needed to connect two given nodes is called “path length” (for basic network metrics, see Figure 1).Reference Bullmore and Sporns 45
Basic network metrics: (A) Degree of a node. (B) Path length: the minimum number of edges needed to connect two nodes; the shorter the average path length, the more integrated the network. (C) Clustering coefficient: the number of the existing connections between the nearest neighbors of a node (in red: links of the node being considered; in green: dashed lines indicate possible links between node’s neighbors; full lines indicate existing links between node’s neighbors). The higher the clustering coefficient, the more segregated the network.
Structural connectivity changes in the ALS–FTLD continuum
Insights from diffusion tensor MRI studies
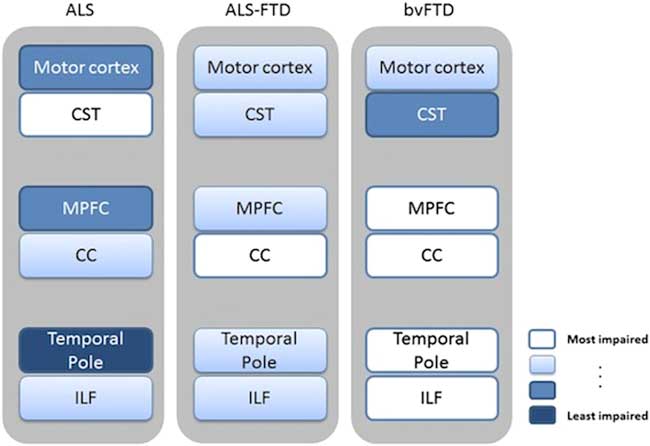
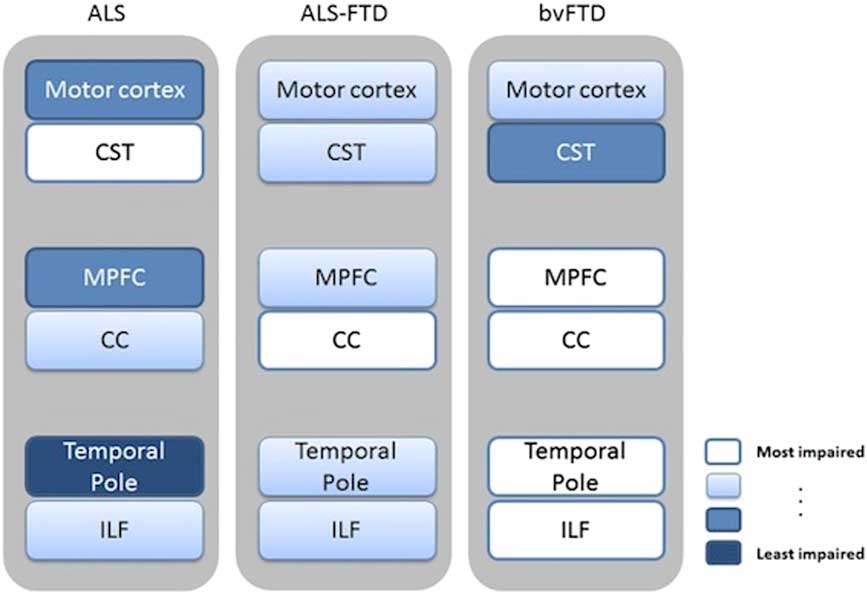
From the anatomical point of view, network-level structural connectivity, which has been shown to underlie functional interactions between brain areas, can be investigated with diffusion tensor (DT) MRI. Recent whole-brain DTI analyses have described a distributed white matter (WM) damage in ALS, especially by applying tract-based spatial statistics approaches, mostly reporting changes of fractional anisotropy (FA) and radial and mean diffusivity (RD, MD) in the corticospinal tracts, connecting the upper and lower motor neurons, in the corpus callosum and in several frontotemporal extramotor areas.Reference Abrahams, Goldstein and Suckling 20 – Reference Agosta, Pagani and Petrolini 22 , Reference Filippini, Douaud, Mackay, Knight, Talbot and Turner 25 , Reference Lillo, Mioshi, Burrell, Kiernan, Hodges and Hornberger 29 , Reference Thivard, Pradat and Lehéricy 46 – Reference Müller, Turner and Grosskreutz 50 In this regard, the spread of the diffusivity changes toward the associative tracts of the frontal lobes reported in several cohorts of ALS patientsReference Agosta, Pagani and Petrolini 22 , Reference Lillo, Mioshi, Burrell, Kiernan, Hodges and Hornberger 29 , Reference Cirillo, Esposito and Tedeschi 49 was consistent with similar diffusivity changes described in patients with bvFTD.Reference Whitwell, Avula and Senjem 34 In particular, Lillo et al.Reference Lillo, Mioshi, Burrell, Kiernan, Hodges and Hornberger 29 investigated WM changes across the whole ALS–FTLD continuum by comparing DTI patterns identified in three cohorts of patients affected by ALS, ALS–FTD, and bvFTD versus healthy controls. The authorsReference Lillo, Mioshi, Burrell, Kiernan, Hodges and Hornberger 29 showed that ALS and ALS–FTD were mainly differentiated from bvFTD on the basis of degeneration of corticospinal tracts, especially in the brainstem and underneath the motor cortex, and of WM underneath the temporal pole. Moreover, the authors compared the two ALS subtypes with each other. On the one hand, the ALS–FTD group showed more pronounced degeneration of the forceps minor, anterior corpus callosum, and inferior longitudinal fasciculus than the pure ALS group. On the other hand, pure ALS patients showed more extensive degeneration of the corticospinal tract compared to ALS–FTD patients. Finally, overlapping DTI changes across the three groups included degeneration of the corticospinal tract, inferior longitudinal fasciculus, and anterior corpus callosum (Figure 2).
More recently, several DTI studies emphasized the significant WM changes in nondemented ALS patients with or without cognitive impairment, explored in the early stages of the disease.Reference Kasper, Schuster and Machts 38 – Reference Christidi, Karavasilis and Riederer 40 Specifically, the WM abnormalities in the corpus callosum and in the frontotemporal WM tracts, especially in the uncinate and superior longitudinal fasciculi, appeared to be more pronounced in ALS patients with cognitive impairment as compared to those without cognitive impairment, thus revealing more profound alterations in the former group.Reference Agosta, Ferraro and Riva 39 ,40
Structural connectivity alterations reflecting neuropathological abnormalities
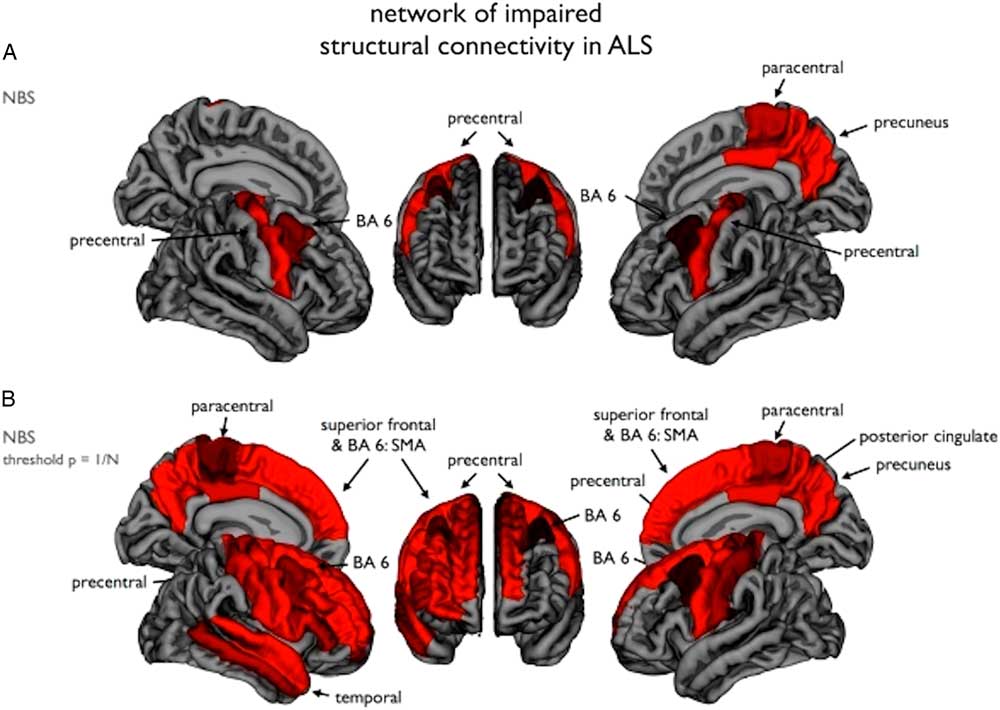
In both ALS and FTLD, anatomical connections have been suggested to be a conduit for spreading of misfolded proteins across areas that are synaptically connected.Reference Müller, Turner and Grosskreutz 50 , Reference Ayers, Fromholt and O’Neal 51 In this regard, Brettschneider and colleaguesReference Brettschneider, Del Tredici and Toledo 52 proposed four time-sequential stages of neuropathology in ALS considering levels of phosphorylated TDP-43 (pTDP-43) aggregation. Based on this evidence, Schmidt et al.Reference Schmidt, de Reus, Scholtens, van den Berg and van den Heuvel 53 revealed that regions involved in pTDP-43 pathology form a strongly interconnected component of the brain network, by crossreferencing stages of pTDP-43 pathology with in-vivo diffusion-weighted imaging data from 215 adult healthy control subjects. These findings appear to strengthen the hypothesis that pTDP-43 pathology spreads across the brain along axonal pathways. Remarkably, a recent large-scale multicenter study, performed on DTI datasets from 253 patients with ALS compared to 189 healthy controls, confirmed the most significant alterations in the corticospinal tracts, although significant WM changes were also reported in the frontal lobe, brainstem, and hippocampal regions of ALS patients, resembling the neuropathological stages based on pTDP-43 pathology.Reference Müller, Turner and Grosskreutz 50 Moreover, in support of the view that widespread WM changes make up a subnetwork of impaired connectivity, recent graph-theoretical analyses revealed a typical involvement of primary and secondary motor connections in ALSReference Verstraete, Veldink, Mandl, van den Berg and van den Heuvel 54 , Reference Buchanan, Pettit, Storkey, Abrahams and Bastin 55 (Figure 3), and, over time, this subnetwork has been shown to expand, with mainly propagation to frontal and parietal brain regions.Reference Seeley, Menon and Schatzberg 57 Similarly, in bvFTD, WM tracts connecting the key regions of the “salience” resting-state network (RSN) (i.e., uncinate fasciculus, anterior cingulum, and genu of the corpus callosum), typically impaired in this syndrome,Reference Seeley, Menon and Schatzberg 57 have been shown to be damaged in cross-sectionalReference Whitwell, Avula and Senjem 34 and longitudinalReference Mahoney, Simpson and Nicholas 58 analyses. In particular, in bvFTD patients carrying C9ORF72 repeat expansion, an earlier involvement of posterior WM regions has been reported,Reference Mahoney, Beck and Rohrer 59 as well as decreased structural connectivity between the key salience network hubs (i.e., high-degree nodes).Reference Lee, Khazenzon and Trujillo 37
Schematic summary of DTI (and voxel-based morphometry) patterns revealed in ALS, ALS–FTD, and bvFTD. Regions of WM damage and the corresponding damaged gray matter areas are indicated using text boxes colored on a white-blue scale, where white indicates a more severe impairment and blue a lesser impairment. Image reproduced from Lillo et al.Reference Lillo, Mioshi, Burrell, Kiernan, Hodges and Hornberger 29 under the Creative Commons license (CC–BY); no permission needed. CC=corpus callosum; CST=corticospinal tract; ILF=inferior longitudinal fasciculus; MPFC=medial prefrontal cortex.
Impaired structural connectivity in ALS: (A) Using the network-based statistics (NBS) procedure, a subnetwork of brain regions showing significantly reduced structural connectivity in ALS patients compared to the healthy controls was revealed, comprising bilateral primary motor cortices and supplementary motor areas (BA6). (B) Using an NBS threshold of p=1/N (N being the number of nodes of the network), a similar but more extended network was revealed. Image reproduced from Verstraete et al.Reference Verstraete, Veldink, Mandl, van den Berg and van den Heuvel 54 under the Creative Commons license (CC–BY); no permission needed.
The hallmark pattern of WM damage in a semantic variant of PPA has been shown to be in the ventral pathways involving the temporal lobes, revealing in this variant a prevalent impairment of the inferior longitudinal and uncinate fasciculi and of the left arcuate fasciculus and the left temporoparietal component of the superior longitudinal fasciculus.Reference Whitwell, Avula and Senjem 34 , Reference Galantucci, Tartaglia and Wilson 60 Conversely, in nonfluent PPA, structural pathways mainly connecting areas involved in speech fluency and grammatical processing, such as frontal and anterior-superior temporal regions, usually in the left hemisphere (i.e., the arcuate/superior longitudinal, the inferior frontooccipital and the uncinate fasciculi, the anterior half of the corpus callosum and the cingulum), have been shown to be altered, allowing to identify large-scale neural networks underlying speech production, syntactic processing, and lexical representations of words in sentences.Reference Grossman, Powers and Ash 61
Finally, in order to discriminate in vivo the different subtypes of FTLD pathology, a significant future contribution could be derived by WM neuroimaging using high-quality DTI procedures, as has been recently revealed by McMillan et al.,Reference McMillan, Irwin and Avants 62 who found a greater whole-brain WM disease burden in FTLD cases with tau inclusions at autopsy when compared to FTLD cases with TDP-43 inclusions.
Functional connectivity changes in the ALS–FTLD continuum
Advanced neuroimaging approaches for investigating functional brain connectivity
Neuroimaging techniques able to investigate functional connectivity, such as fMRI, which uses the blood oxygenation level-dependent (BOLD) signal as a surrogate of neuronal activity, or electroencephalography (EEG) and MEG, which directly record the electric/magnetic fields produced by the neuronal activity, have been increasingly implemented to study functional brain activity in healthy and diseased subjects.Reference Mantini, Perrucci, Del Gratta, Romani and Corbetta 63 , Reference Hall, Robson, Morris and Brookes 64 However, it is to be taken into account that the BOLD signal, given its nature, suffers from a low temporal resolution and does not allow a reliable interpretation of its phase, restricting the analysis to estimations of correlations.Reference Hall, Robson, Morris and Brookes 64 , Reference Hämäläinen 65 On the other hand, EEG, while having an excellent temporal resolution, does not have good enough spatial resolution, since the signals produced by the brain are distorted by the skull and meninges. Conversely, MEG achieves temporal resolutions equivalent to that of EEG, while retaining good spatial resolution, considering that the magnetic field is not distorted by the structures surrounding the brain.Reference Hall, Robson, Morris and Brookes 64 , Reference Hämäläinen 65
The whole-brain investigation of functional brain activity has been initially carried out by applying single-photon emission computed tomography (SPECT) with 99 mTc-hexamethylpropylene and (18F)2-fluoro-2-deoxy-d-glucose positron emission tomography (FDG–PET) analyses, which indirectly evaluate functional brain activity by measuring respectively the regional perfusion and cerebral uptake of glucose. With regard to the ALS–FTLD continuum, several SPECT and FDG–PET studies have reported widespread frontotemporal lobe involvement in ALS patients with or without cognitive impairment,Reference Kew, Goldstein and Leigh 66 – Reference Vercelletto, Belliard and Wiertlewski 68 showing, in some cohorts of patients, significant relationships between functional changes within the frontotemporal areas (i.e., anterior and medial orbitofrontal cortex, anterior and medial frontal cortex, and anterior temporal lobes) and neuropsychological performance. Interestingly, recent evidence depicted PET signatures of neurodegeneration in some genetic variants across the ALS–FTLD continuum.Reference Jacova, Hsiung and Tawankanjanachot 69 – Reference Cistaro, Pagani and Montuschi 71 In particular, with regard to C9ORF72 mutations, Cistaro et al.Reference Cistaro, Pagani and Montuschi 71 compared C9ORF72-positive ALS patients to sporadic ALS patients with or without bvFTD, showing a more widespread central nervous system involvement in C9ORF72–ALS.
Insights from RS–fMRI and multimodal studies
In the last two decades, the whole-brain analysis of functional connectivity by RS–fMRI has allowed a better understanding of sensorimotor or cognitive functions in several neurodegenerative diseases, with only a few studies exploring the functional connectivity of the brain networks in ALSReference Agosta, Canu and Valsasina 23 , Reference Mohammadi, Kollewe, Samii, Krampfl, Dengler and Münte 24 , Reference Douaud, Filippini, Knight, Talbot and Turner 27 , Reference Tedeschi, Trojsi and Tessitore 28 , Reference Trojsi, Esposito and de Stefano 30 and bvFTD.Reference Trojsi, Esposito and de Stefano 30 , Reference Zhou, Greicius and Gennatas 33 , Reference Farb, Grady and Strother 35 , Reference Filippi, Agosta and Scola 36 In particular, the most consistent RS–fMRI features of the two syndromes were a suppressed connectivity within the sensorimotor network (i.e., involving primary and supplementary motor areas) in ALS patientsReference Mohammadi, Kollewe, Samii, Krampfl, Dengler and Münte 24 , Reference Douaud, Filippini, Knight, Talbot and Turner 27 , Reference Tedeschi, Trojsi and Tessitore 28 , Reference Trojsi, Esposito and de Stefano 30 and a weakening of connectivity within the so-called “salience” network (i.e., including the anterior cingulate and orbitofrontal insular cortices), involved in socially and emotionally relevant information processing, in bvFTD patients,Reference Trojsi, Esposito and de Stefano 30 , Reference Zhou, Greicius and Gennatas 33 , Reference Farb, Grady and Strother 35 , Reference Filippi, Agosta and Scola 36 with evidence of some overlapping aspects between ALS and bvFTD.Reference Trojsi, Esposito and de Stefano 30 In particular, with regard to functional activity in RSNs identified in the cognitive domain, such as the default mode network (i.e., composed of the posterior cingulate, precuneus, and medial prefrontal cortices) and the bilateral frontoparietal networks (i.e., including regions subserving attention, executive processing, planning, and working memory), some authors have described a weaker connectivity in frontal areas in both ALSReference Mohammadi, Kollewe, Samii, Krampfl, Dengler and Münte 24 , Reference Douaud, Filippini, Knight, Talbot and Turner 27 , Reference Tedeschi, Trojsi and Tessitore 28 , Reference Trojsi, Esposito and de Stefano 30 and bvFTD,Reference Trojsi, Esposito and de Stefano 30 , Reference Farb, Grady and Strother 35 , Reference Filippi, Agosta and Scola 36 while posterior connectivity has been shown to be increased in some cohorts of ALS patients compared to healthy controls.Reference Agosta, Canu and Valsasina 23 , Reference Tedeschi, Trojsi and Tessitore 28 similar to what is commonly reported in bvFTD patients.Reference Whitwell, Josephs and Avula 32 , Reference Zhou, Greicius and Gennatas 33
By integrating information from structural and functional networks in a combined RS–fMRI and DTI analysis, a spatial pattern of increased functional connectivity, spanning sensorimotor, premotor, and the prefrontal and thalamic regions, was described by Agosta et al.Reference Agosta, Canu and Inuggi 72 in a cohort of patients with primary lateral sclerosis (PLS) (i.e., characterized by selective impairment of corticospinal tracts) compared to healthy controls. In particular, PLS patients exhibited an increased functional connectivity between the left sensorimotor cortex and the right cingulate cortex, the parahippocampal gyrus, and the cerebellum, with a more widespread pattern of increased connectivity in patients who did not show structural damage in the corticospinal tract, as monitored by DTI. This evidence is particularly valuable, since it might point toward the idea that an increased connectivity in RSNs may be interpreted as a compensation mechanism, that would be less efficient in patients with wider structural damage. Although it remains unclear whether a neurodegenerative disease can cause a network connectivity upregulation, current hypotheses in this direction refer to the activation of compensatory mechanism (i.e., increased functional connectivity at rest in regions close to the atrophic areas)Reference Tedeschi, Trojsi and Tessitore 28 , Reference Rytty, Nikkinen and Paavola 73 or to a progressive imbalance between motor neuron excitability and dysfunction of cells critical in regulating motor neurons activity, such as astrocytes and interneurons.Reference Douaud, Filippini, Knight, Talbot and Turner 27 , Reference Do-Ha, Buskila and Ooi 74
Insights from MEG studies
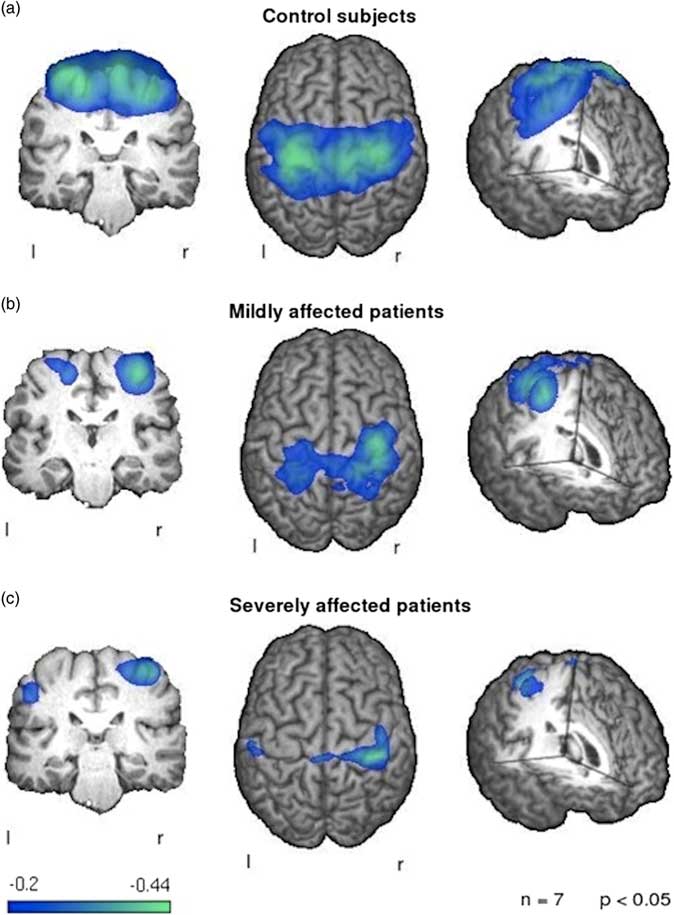
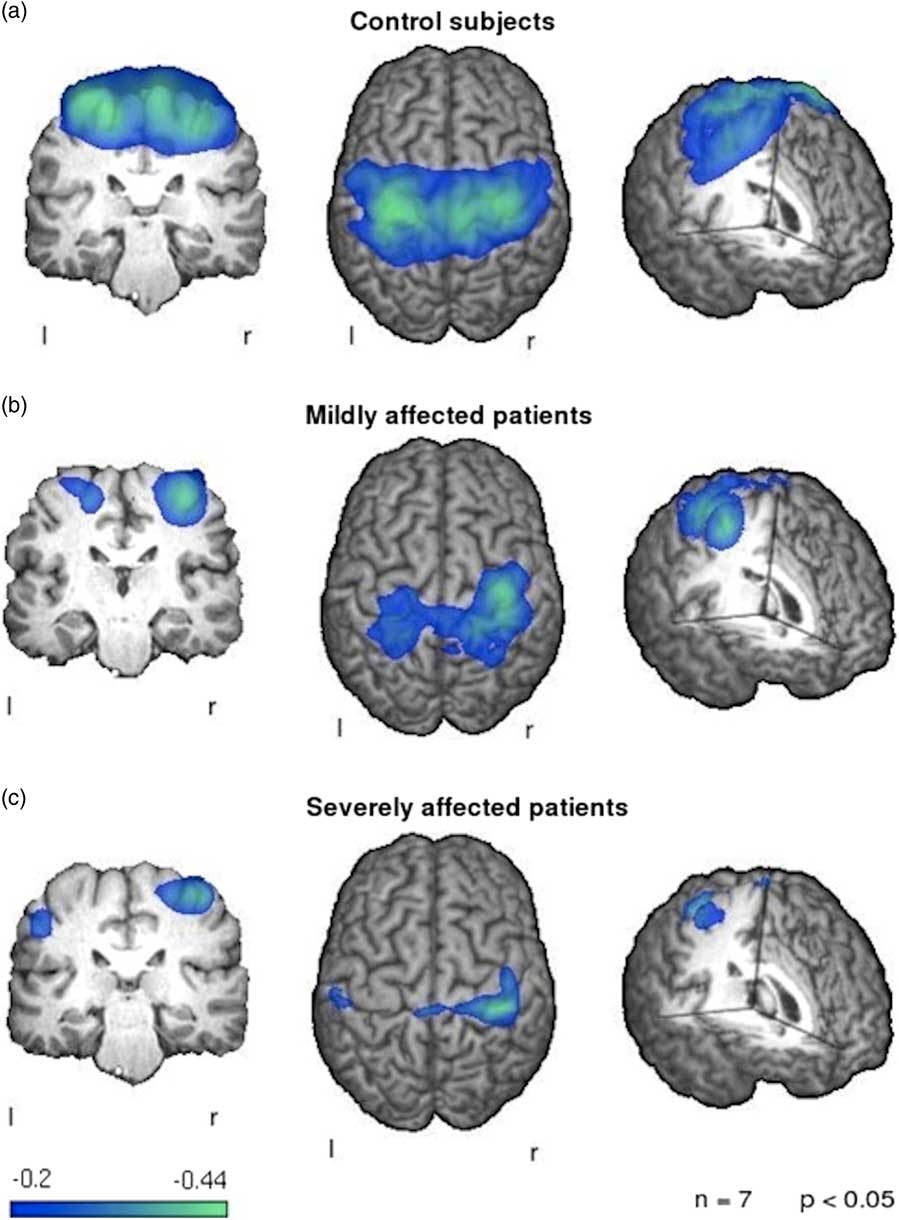
With regard to MEG findings on reorganization of brain networks in ALS, a first preliminary analysis by Teismann et al.Reference Teismann, Warnecke and Suntrup 75 focused on the cortical correlates of swallowing impairment in ALS patients. As one might expect, the authors found a reduction of swallowing, proven to be related to cortical activity, in ALS patients compared to healthy controls. More interestingly, while reduced functional activity was shown within the left cortex of all patients, higher activation was observed in the right sensorimotor cortex of patients with dysphagia, thereby suggesting that a potential compensation mechanism might underlie this pattern (Figure 4). More recently, Proudfoot et al.Reference Proudfoot, Rohenkohl and Quinn 31 used MEG during preparation and execution of a motor task in a cohort of 11 ALS patients, describing an increased beta-desynchronization in both the ipsi- and contralateral motor cortices. Interestingly, these abnormalities were also observed in a group of asymptomatic carriers of ALS-related gene mutations. Thus, these results seem to confirm the hypothesis that high time resolution techniques, such as MEG, might be able to capture alterations of brain functional activity also in the preclinical stage of disease. Moreover, with regard to the identification of potential correlations between measures of network reorganization and disability scores in patients with ALS, a recent resting-state EEG analysis revealed that some network metrics—such as the degree distribution (k), the leaf fraction (fraction of nodes with degree 1), and the tree hierarchy—were significantly different in a cohort of ALS patients compared to healthy controls.Reference Fraschini, Demuru and Hillebrand 76 Interestingly, those measures were also shown to be linearly related to disability score.
Patterns of event-related desynchronization in ALS patients compared to healthy controls during swallowing. Control subjects (a) show a strong and bilateral activation of the primary sensorimotor cortex. The mildly affected patients (b) exhibit a weaker activation of both sensorimotor cortices with a stronger activation of the right hemispheric side. The severely affected patients (c) show little activation of the left hemisphere with a reduced right hemispheric activation in comparison to healthy controls. Image reproduced from Teismann et al.Reference Teismann, Warnecke and Suntrup 75 under the Creative Commons license (CC–BY); no permission needed.
Insights from graph-theoretical analyses
Only in a few studies has the network theoretical approach been applied to investigate brain functional activity across the ALS–FTLD continuum. With regard to FTLD, a recent graph-theoretical analysis by Agosta et al.Reference Agosta, Sala and Valsasina 77 revealed global and local functional alterations of networks in bvFTD that exhibited some divergences in comparison to connectivity patterns described in ALS. In fact, the greatest decrease in interregional connectivity was shown between the frontal and occipital regions, and the insular cortices and occipital, temporal, and frontal regions. Moreover, in a cohort of patients with a semantic variant of PPA, Agosta et al.Reference Agosta, Galantucci and Valsasina 78 revealed a loss of hubs and a reduced local connectivity (i.e., reduced nodal degree) within the inferior and ventral temporal regions and the occipital cortices, and this pattern was prone to extend into the medial and ventral frontal cortex bilaterally, the left amygdala and/or hippocampus, and the left caudate nucleus. Conversely, in ALS patients Schmidt et al.Reference Schmidt, Verstraete, de Reus, Veldink, van den Berg and van den Heuvel 79 showed that both structural and functional connections at greater topological distance from the motor cortex appeared less affected in comparison to the direct brain connections with the motor cortex. Moreover, a strong positive correlation was shown between changes in structural and functional connectivity, thereby suggesting that structural and functional network degeneration appears to be coupled in ALS.
Concluding Remarks and Future Perspectives
The increasing evidence of a genetic and clinicopathological continuum between ALS and FTLD has been recently reinforced by neuroimaging findings. In particular, network-based approaches applied to neuroimaging techniques (such as RS–fMRI, DTI, and MEG) offered exciting opportunities to investigate new aspects of brain structure and function in health and disease, allowing to hypothesize that ALS–FTLD disorders start and propagate following disease-specific patterns that resemble the architecture of healthy brain connectivity networks. Moreover, similar neural networks, comprising motor cortical, medial prefrontal cortex, and temporal pole regions and their afferents and efferents seem to be affected across the whole ALS–FTLD continuum, showing overlapping or mildly diverging characteristics when comparing the different phenotypes of disease. Moreover, the identification of significant associations between neuroimaging profiles and genetic variants across the ALS–FTLD spectrum of disease has been proven extremely useful for investigating in-vivo neurobiological mechanisms underlying the neurodegenerative process. Undoubtedly, future approaches combining advanced imaging, molecular pathology, and genetics will further enhance our understanding of the pathophysiology of the disease continuum existing between ALS and FTLD. We anticipate that the expected results will provide valuable information for a better classification of the clinical syndromes belonging to this spectrum of disorders and a more accurate design and management of therapeutic trials.
Disclosures
Dr. Trojsi reports personal fees from Italfarmaco, grants from Novartis, and personal fees from the Italian Association for Amyotrophic Lateral Sclerosis, outside the submitted work.
Prof. Tedeschi reports grants from Purytra, grants from Abbvie, grants from the Ministry of Health, and grants from Genzyme, outside the submitted work.
Dr. Pierpaolo Sorrentino and Prof. Giuseppe Sorrentino have nothing to disclose.