


Introduction
Antarctica contains >90% of the total global land-based ice, so positive/negative changes in the ice-sheet mass balance can lead to a lowering/rise in global sea level. It is still an open question whether polar ice sheets will grow or decay with a warming climate (Reference HoughtonHoughton and others, 2001). Polar ice sheets also provide valuable proxy archives of millennial-scale climatic events and past atmospheric composition. Spatial and temporal variability in snow accumulation can have a significant impact on the interpretation of ice cores, particularly for chemical species that show a strong seasonal dependence either in atmospheric loading or in the atmosphere-to-snow transfer process. Proper interpretation of these records requires a thorough knowledge of the processes which govern snow accumulation in ice sheets. Knowledge of the seasonal variability in accumulation processes will also be necessary for interpretation of the new generation of precise satellite altimetric measurements on ice sheets.
Although long-term, annually averaged Antarctic ice-sheet mass accumulation data based on glaciological investigation are available (Reference Giovinetto and BentleyGiovinetto and Bentley, 1985; Reference Vaughan, Bamber, Giovinetto, Russell and RVaughan and others, 1999), information is sparse on intra-annual snow accumulation. Reference BromwichBromwich (1988) has acknowledged the difficulty of obtaining frequent, direct measurements of precipitation amount and snow accumulation in the remote interior regions of Antarctica. However, these data are critical for determining whether general circulation models (GCMs) and other numerical techniques correctly simulate the seasonal forcings that control mass input to the ice sheet. Intra-annual measurements of surface height variations have been made using automatic snow-depth gauges or snow-stake arrays at several sites on the ice sheet (Reference Fujii and KusunokiFujii and Kusunoki, 1982; Reference McConnell, Bales and DavisMcConnell and others, 1997; Reference BraatenBraaten, 2000; Reference ReijmerReijmer, 2001; Reference McMorrow, Curran, van Ommen, Morgan and AllisonMcMorrow and others, 2002) or ice shelves (Reference BraatenBraaten, 1997). There are no prior data, however, for the Princess Elizabeth Land region of East Antarctica, and to address this the Chinese National Antarctic Research Expedition (CHINARE) and the Australian Cooperative Research Centre for Antarctic Climate and Ecosystems (CRC) plan to install a series of automatic weather stations (AWSs) with snow-depth gauges along the CHINARE inland traverse route from Zhongshan station to Dome A. In this study, surface height variation data from the first AWS, installed at site LGB69, are discussed for the period 22 January 2002 to 31 March 2003.
Characteristics of the Site and the AWS
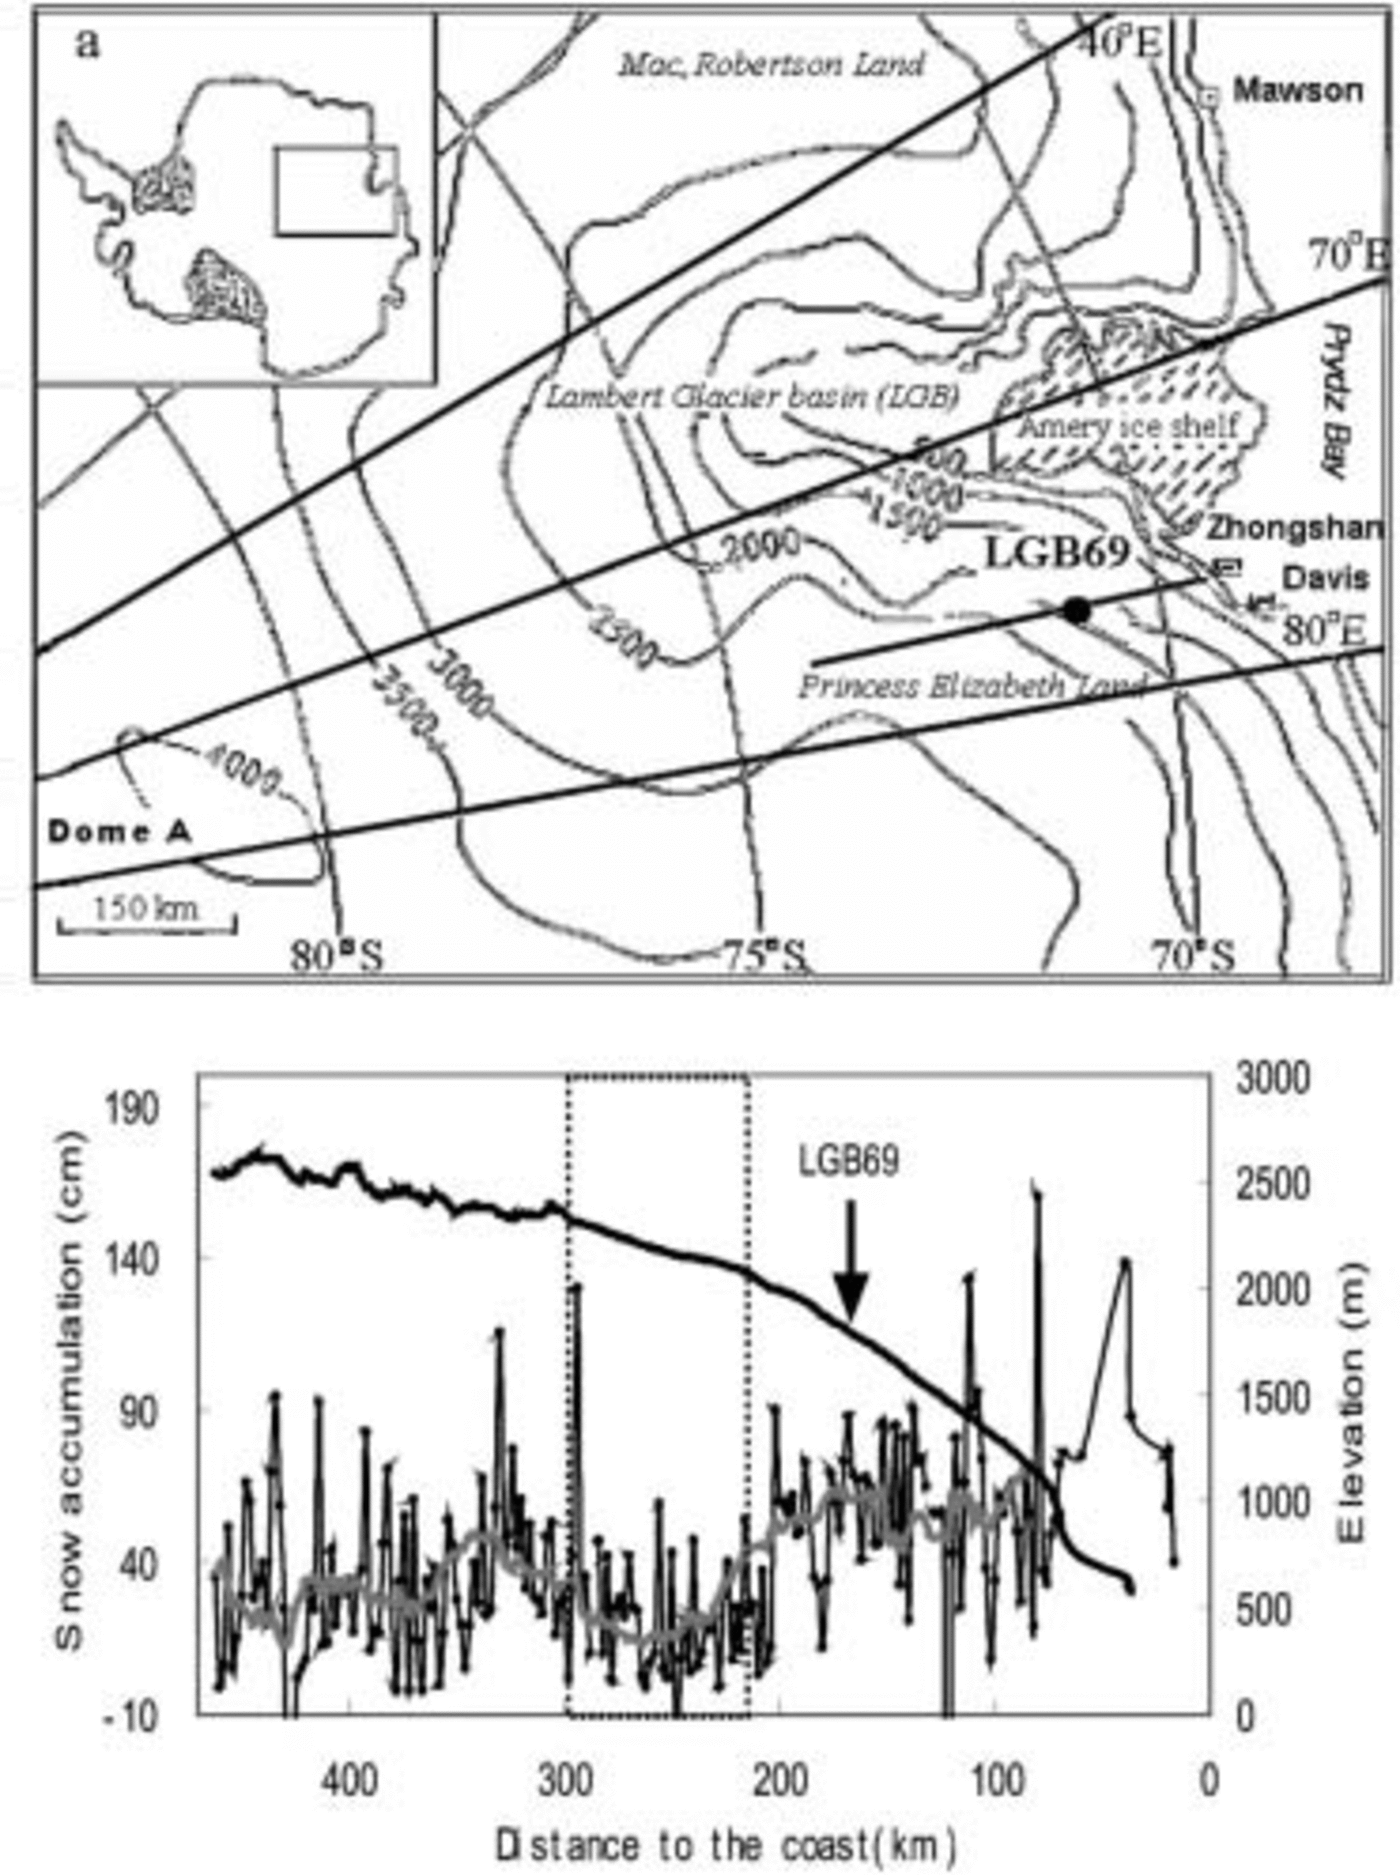
On 22 January 2002, an AWS was installed at LGB69 (70.835˚ S, 77.075˚ E; 1850 ma.s.l.), Princess Elizabeth Land, (Fig. 1) by the 18th CHINARE. This site is 160 km from the coast. The surface microrelief consists of sastrugi approximately 0.2 m high, oriented with their longitudinal axis at approximately 60˚ true, which is perpendicular to the contour line. During the past 5 years, several over-surface traverses have been made along the route from Zhongshan towards Dome A (Fig. 1a; Reference DaheQin and others, 2000). Figure 1b shows the spatial distribution of the 1996–98 average surface accumulation rate measured by bamboo stakes for the initial 476 km of this route. LGB69 is located in a relatively high-accumulation region with an accumulation rate of approximately 0.70 ma–1. A minimum in accumulation of about 0.20 ma–1 occurs between 200 and 300 km (dotted area in Fig. 1b), possibly because there is a combination of less atmospheric moisture and strong wind erosion. Southward from 300 km, the accumulation decreases with increasing distance from the coast.
(a) CHINARE over-snow traverse route in Princess Elizabeth Land, Antarctica, and location of AWS LGB69. (b) The distribution of snow accumulation rate along the initial 470 km of the route; the grey line represents 30 km smoothed variations, and the dotted area denotes the section of the minimum accumulation along the traverse line.
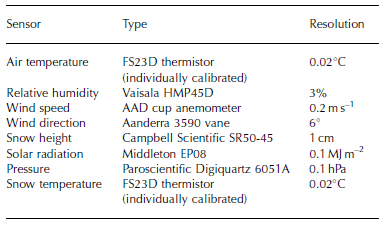
The AWS at LGB69 is a Series 098 station, designed and built by the Australian Antarctic Division (AAD). The AWS provides hourly measurements of air temperature (at nominal 1, 2 and 4 m levels), wind speed and direction, atmospheric pressure, relative humidity, solar radiation, surface snow height and subsurface temperatures at 0.1, 1, 3, 5 and 10m depths. Data are relayed via the Argos system on US National Oceanic and Atmospheric Administration satellites. Table 1 lists the major sensors and their resolutions.
Sensor types and resolution for the AWS at LGB69
Snow surface height (SSH) was measured every hour with a Campbell Scientific SR50-45 ultrasonic distance sensor mounted on the 4 m arm of the AWS. The sensor has a field of view of approximately 22˚ and measures the distance to
the closest object within this field of view (e.g. the top of a snow surface feature) with a resolution of 0.01 m. Total snow accumulation is calculated as the difference between the originally installed height of the SR50-45 sensor above the surface and subsequent measured distances. Data recovery from the surface height detector was better than 99%.
Meteorological observations from the closest occupied station (160km north-northeast), Davis, are also used to investigate factors impacting the surface height changes at LGB69. These observations, made every 3 hours, include the total cloud covers (in oktas) and cloud heights (in metres).
Seasonal Changes in Snow Surface Height
Changes in SSH measured by the acoustic sounder are independent of changes due to ice flow, since the AWS moves with the ice. Densification occurs after the snowfall, so the change in SSH is not equal to net snow accumulation. The snow may also be redistributed by the wind (e.g. dune migration). But in this study, in the absence of specific observations on these processes, we assume that they are relatively small over a longer period and that SSH variations provide a record of seasonal variability of net accumulation.
After quality-control checks of the data, cumulative SSH changes and daily increase in SSH were calculated and plotted (Fig. 2). The overall characteristics of the seasonal changes in SSH are as follows.
Cumulative SSH and daily change in SSH from 22 January 2002 to 28 February 2003. The dashed line separates the 2002 and 2003 years. Numbers 1–4 and 10 denote five episodic increases of SSH.
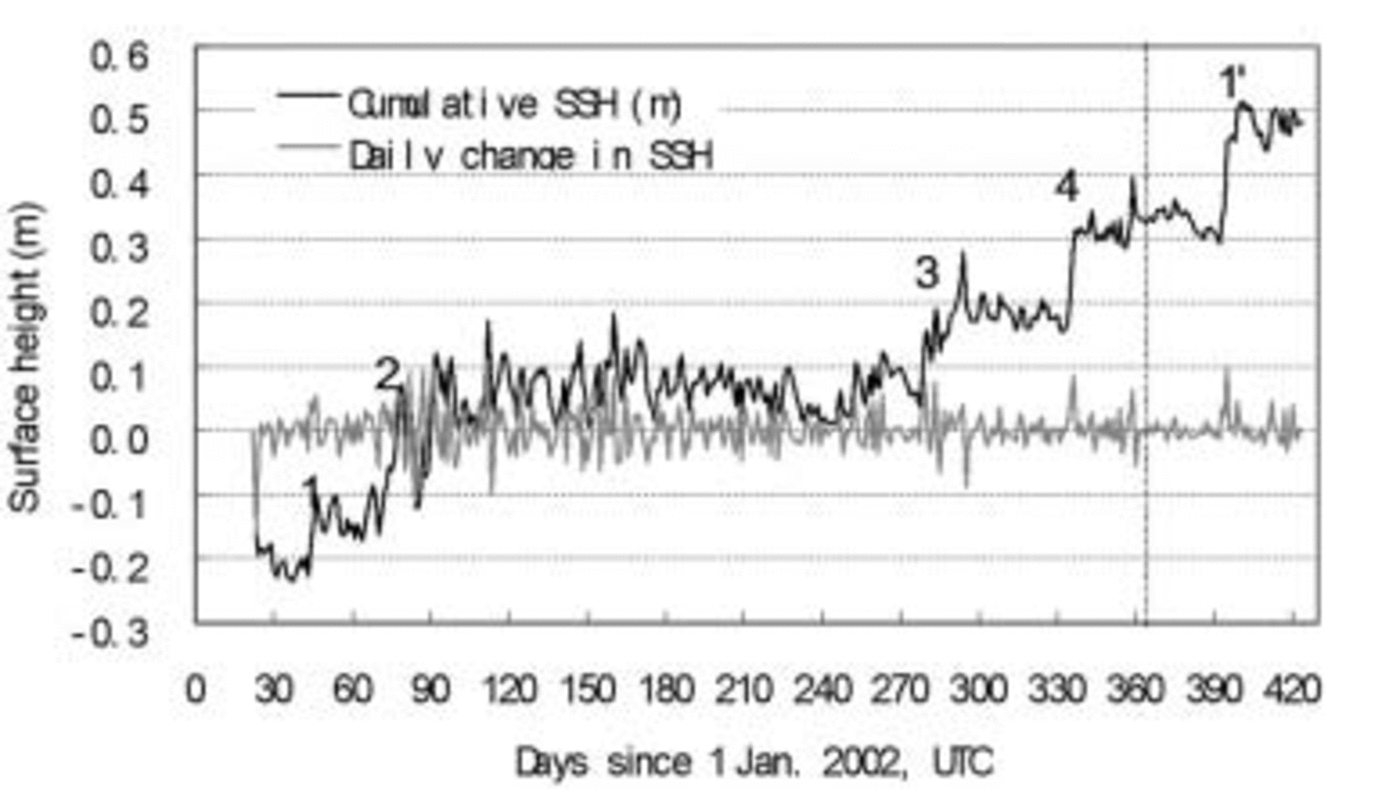
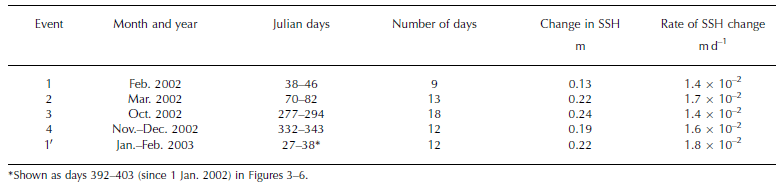
1. The major accumulation period is between October and March the next year. The snow accumulation process at this site is episodic, with most of the annual accumulation being associated with only four events (Table 2). Abrupt increases in SSH occurred from 7 to 15 February (event 1), 11 to 23 March (event 2), 4 to 21 October (event 3) and 28 November to 9 December (event 4) 2002, as well as from 27 January to 7 February (event 10) 2003. The SSH change for the five events (four in 2002 and one in 2003) ranges between 0.13 and 0.24 m, partly depending on the duration of the event. The rate of daily change was 1.4–1.8×10⁻² m d–1. Reference BraatenBraaten (2000) also found periodic increases of surface height during only five events at a site in West Antarctica (AGO2; 85.67˚ S, 46.38˚ W) in 1996/97. While it is likely that other precipitation events such as condensation or clear-sky precipitation may sometimes occur, it is not possible to quantify the frequency of occurrence or magnitude of these inputs, because of snow transport by winds and the resolution limitations of the sensor. The positive SSH changes may be associated with precipitation or windblown transport of snow into the target area. The surface height measurements alone cannot determine which process, or what combination of the two, causes the change, but, as discussed further below, we believe that precipitation is probably the dominant factor. Little increase in SSH occurs between the episodic events, even during the accumulation period October–March.
Change in SSH associated with identified snow accumulation events at the LGB69 AWS
2. The net SSH remains relatively unchanged during the austral winter. This could be a result of either very little precipitation and slight snow redistribution, or offset of any precipitation by wind erosion and sublimation. But sublimation at LGB69 will be small and will mainly occur during warm, windy periods in summer. For inland regions >150km from the coast, sublimation is near zero (Reference BromwichBromwich, 1988). As discussed below, during the study period the mean accumulation rate was greater during stronger winds. Therefore for snow redistribution, this site is probably an accumulating rather than a wind-erosion area, and the constant SSH during winter is probably due to only rare precipitation during the period.
The annual SSH change is 0.68m which, for a measured mean density of the annual accumulation layer of 380 kg m–3, is equivalent to 0.26 mw.e. This is similar to the mean annual 1999–2001 accumulation rate (0.28 ma–1 w.e.) determined from the stake array, which was installed in a 6 ×6 matrix at LGB69 in January 1999 to characterize annual variability of snow accumulation over a 100 m×100m area. The SSH change from October 2002 to March 2003 was 0.69 m, which is nearly the total annual change, while a negative SSH change from April to September 2002 was only 0.07 m. Negative changes to the surface may be due to wind erosion of surface snow, surface sublimation, and/or metamorphic changes and densification of the firn.
Meteorological Assessment of Accumulation Events
Precipitation at the coast of Antarctica is episodic and associated with synoptic-scale storm systems (Reference BromwichBromwich, 1988). Routine measurement of precipitation amounts in Antarctica is a difficult and often impossible task using surface-based collection techniques since precipitation usually occurs in conjunction with strong surface wind. Reference Goodison, Louie and YangGoodison and others (1998) summarized techniques and methods for measuring solid precipitation but these still lack application over the Antarctic ice sheet. A recent workshop in Alaska, USA, on solid precipitation suggested developing a network of a critical number of snow accumulation stations in Antarctica to provide data with 1 month latency. Studies of blowing snow over the polar ice sheet have been undertaken and some empirical functions have been established (Reference Fujii and KusunokiFujii and Kusunoki, 1982; Reference Pomeroy, Jones, Wolff and BalesPomeroy and Jones, 1996; Reference BintanjaBintanja, 1998a, Reference Bintanjab; Reference Mann, Anderson and MobbsMann and others, 2000). Traditional glaciological point estimates of Antarctic interannual precipitation variability often assume that the accumulation and precipitation rates are the same.
Increase in SSH vs wind speed
The accumulation events observed at LGB69 may be due to precipitation alone, wind-blown snow alone or some combination of the two. Measured wind speed during an event can offer some insights into the mechanism. The formation of snowdrifts by wind-blown snow requires the movement of snow grains along the surface in a process called saltation (Reference Pettre, Pinglot, Pourchet and ReynaudPettré and others, 1986). However, this process only occurs if the wind speed exceeds some threshold speed. Typically the threshold speed for the onset of drifting varies between 7 and 13 ms–1 depending on surface roughness (Reference BromwichBromwich, 1988).
Unfortunately the bearings of the AWS anemometer shaft ‘freeze’ during very cold periods and the instruments give a zero reading. For LGB69 the 1m anemometer did not operate between 23 June and 25 September 2002, whereas the 4m anemometer was stopped between 30 July and 16 September.
A plot of surface wind speed vs wind direction at the 4 m level for the periods 22 January to 29 July 2002 and 16 September 2002 to 28 February 2003 (Fig. 3) shows that the prevailing wind direction is around 60˚ true, from Princess Elizabeth Land towards the Amery Ice Shelf. The annual average wind speed at the 4 m level is 9.6 ms–1, with a daily average wind speed of 0–17.7ms–1.
(a) Wind speed vs wind direction at 4 m, from 22 January 2002 to 28 February 2003 (no data between 30 July and 16 September 2002). (b, c) Relationship between daily change in SSH (only positive changes are shown) and wind speed higher than 7 ms–1 at the 1m level (WM1), for days 22–173 (b) and 269–424 (c).

Figure 3 also shows the relationship between daily increases in SSH and wind speed at the 1 m level exceeding 7 ms–1, for two periods when wind-speed data are available (days 22–173 and days 269–424). We are concerned only with snow accumulation events, due either to precipitation or to wind transport to the site, and not with subsequent firnification or wind erosion. Hence only positive daily changes in SSH are shown in Figure 3 and subsequent figures. It is apparent that higher wind speeds are associated with larger changes in SSH. LGB69 is located inland of the transition zone (300–500km from the coast (Fig. 1b): Reference Van den BroekeVan den Broeke and others, 1999; Reference Cunde, Allison, Jiawen, Dahe, Mingjun and ZhongqinXiao and others, 2004), and receives both precipitation and drift snow. Although the monthly transport (Q T) and sublimation (Q E) of snow could be calculated by the methods developed by Reference Pomeroy, Jones, Wolff and BalesPomeroy and Jones (1996), the lack of data on one parameter, monthly snowfall, would make these values imprecise.
Increase in SSH vs humidity
Atmospheric humidity is another potential indicator of meteorological phenomena such as precipitation, moisture convection and/or wind-blown snow (Reference Mann, Anderson and MobbsMann and others, 2000). Daily increases in SSH between spring and autumn show a close positive correlation with the daily variation of relative humidity (RH) at the AWS (Fig. 4a). But since both precipitation and wind-blown snow can increase the humidity, RH alone is insufficient to identify precipitation events. However, the humidity sensor is mounted at a height of 4m, above the level of saltation or drift snow due to katabatic wind, and high RH is probably related to precipitation events or storms. Figure 4b shows the relationship between SSH and RH greater than 70%. Again, ‘pulses’ of RH coincide with abrupt increases in SSH.
(a) Correlation between relative humidity and daily change in SSH (only positive changes are shown) from 7 October 2002 to 28 February 2003 (days 280–424). (b) Cumulative SSH vs relative humidity when higher than 70%, during the same period; numbers 3, 4 and 10 represent events of abrupt SSH increase.

Increase in SSH vs cloudiness
Figure 5a shows the SSH compared to daily total incoming shortwave radiation measured at the AWS, and Figure 5b and c show the shortwave radiation compared to daily increases in SSH. There is no incoming shortwave radiation during the polar night (approximately days 120–240). There are also several other periods outside the polar night when the AWS records no incoming shortwave radiation, probably due to an instrumental fault. These are excluded from analysis. Figure 5b and c show a tendency for the episodic increases in SSH, which occur mostly in autumn and spring, to be anticorrelated with incoming shortwave radiation, indicating that the SSH increases occur during cloudy periods, and are hence likely to be precipitation events. However, because a dense cloud cover does not necessarily result in precipitation, the correspondence between SSH peaks and radiation troughs is not one on one.
(a) Relationship between cumulative SSH and total daily incoming solar radiation at LGB69. Numbers 1–4 and 10 represent events of abrupt SSH increase. (b, c) Relationship between daily change in SSH (only positive changes are shown) and solar radiation for days 22–60 (b) and 300–424 (c).

Are major increases of SSH attributable to storms in the coastal region? In Figure 6 the daily change in SSH is compared with cloud observation at Davis station, 160 km north-northeast of LGB69. Figure 6a shows the total cloud amount and Figure 6b shows the elevation of the lowest cloud layer. During summer the increase in SSH at LGB69 is associated with both a greater cloud fraction and lower-level clouds at Davis. This relationship is less distinct in winter.
(a, b) The relationship between daily change in SSH (only positive changes are shown) at LGB69 and fractional cloud cover (a), and the lowest cloud height (b) at Davis station.
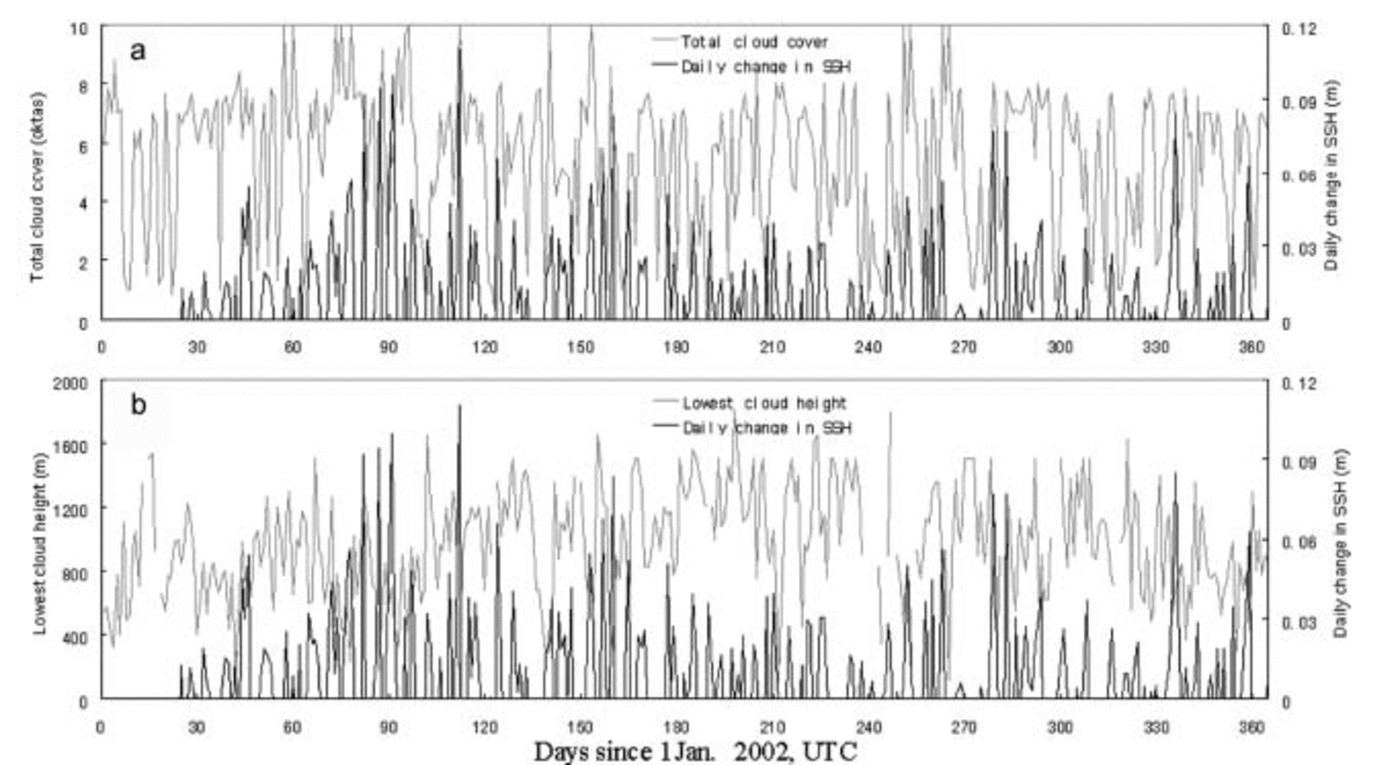
Low-level clouds (500–1500m above surface) are the dominant source of precipitation. Synthesis of airflow into Antarctica suggests that upslope advection of warm air into the interior of Antarctica is a frequent and persistent phenomenon (Reference HoganHogan, 1997). This low-level circulation in turn affects the accumulation on the coastal ice sheet. The Antarctic circumpolar trough is at its deepest and most southerly location during the equinoxes, but, for the sole year of record that we present here, the accumulation episodes are all on the summer side of the equinoxes. However, Reference Cunde, Allison, Jiawen, Dahe, Mingjun and ZhongqinXiao and others (2004) use ice-core records to show that a Southern Indian Ocean low located over the north of the Prydz Bay region governs interannual variability of the accumulation and decadal climate change in Princess Elizabeth Land. Longer records are required to establish any links between accumulation seasonality, storminess and the propagation and strength of the circumpolar trough.
Conclusion
An AWS was used to monitor SSH at a site in Princess Elizabeth Land about 160 km from the coast. Significant increases in SSH at this site were episodic, with large increases being associated with only five events in the months between February 2002 and March 2003. All events occurred between late spring and early autumn. The total initial increase in surface height that occurred during the four 2002 events was 0.78 m, which is greater than the total annual change of 0.68 m, but significant surface height decreases occurred subsequent to the events due to a combination of snow compaction, wind erosion and sublimation. During the winter months (April–September) individual SSH increases were considerably smaller than during the spring and autumn episodes, and were typically followed by approximately equivalent SSH decreases: the net change to the surface height over the six winter months was only 0.07 m.
The acoustic ranger on the AWS cannot discriminate whether the increases in SSH are due to precipitation or to wind transport of snow into the site. But SSH increases, and particularly the episodic ones, tend to be associated with periods of strong wind, high humidity and low solar radiation at the site, and with high fractional cloud cover and low cloud height at Davis station, 160 km to the north-northeast. We suggest that the strong accumulation events at the site are associated with major storms in the region and inland transport of moist air from the coast. However, the major SSH episodes occurred over periods of 9–18 days, and they are therefore not associated with a single synoptic event, but rather with a series of events.
However, the seasonality of the accumulation at this site may not be the same over all of East Antarctica. For instance, the seasonality is similar for Wilkes Land, Mizuho Plateau and Dronning Maud Land (Reference Fujii and OhataFujii and Ohata, 1982; Reference Allison, Wendler and RadokAllison and others, 1993; Reference Noone, Turner and MulvaneyNoone and others, 1999), but is different for Kemp Land (Reference Van den BroekeVan den Broeke, 2000; Reference Cunde, Jiawen, Dahe, Hongqin, Weizhen and AllisonXiao and others, 2001) and for the West Antarctic ice sheet (Reference BraatenBraaten, 1997, Reference Braaten2000).
Acknowledgements
The authors are grateful to D. Shepherd at the Bureau of Meteorology, Australia, for providing the meteorological data from Davis station. Field installation of the AWS was assisted by Xiaxing Xu, Limin Xia, Xinsheng Gao and Fudong Wang. This work is supported by the National Natural Science Foundation of China (40305007), the Ministry of Science and Technology of China (2001CB711003, 2001DIA50040) and the Chinese Academy of Sciences (KZCX2-303).



