Blood cultures are an invaluable diagnostic tool for the detection of potentially life-threatening infections. Results of blood cultures can provide a definitive diagnosis, direct the therapeutic course, and offer key prognostic information.Reference Bryan 1 The performance of automated blood culture systems is volume dependent; decreased sensitivity or specificity is associated with under- or overfilling blood culture bottles.Reference Hall, Ilstrup and Washington 2 – Reference Meessen and Jacobs 7 Furthermore, optimization of the volume of blood collected can decrease the time to positivity, thus potentially expediting appropriate diagnosis and treatment.Reference Weinstein, Mirrett, Wilson, Reimer and Reller 8 – Reference Lin, Liu, Tien, Ho, Hsu and Lu 11
Factors that influence culture contamination include proper skin preparation, the use of dedicated phlebotomy teams, single versus double needles for bottle inoculation, and blood draw site (ie, peripheral venipuncture versus central venous catheter access).Reference Hall and Lyman 12 Additionally, higher volumes of blood collection are associated with reduced levels of blood contamination.Reference Bekeris, Tworek, Walsh and Valenstein 13 , Reference Gonsalves, Cornish, Moore, Chen and Varman 14
Diagnostic errors associated with blood cultures due to decreased test performance and improper interpretation carry serious consequences. Poor test sensitivity can lead to false-negative results that may delay diagnosis and therapy, leading to increased patient morbidity and mortality. False-positive results or contamination can lead to longer hospital stays, unnecessary antibiotic use, and additional laboratory testing.Reference Bates, Goldman and Lee 15 The financial impact is estimated at $3,000 in excess healthcare costs per contaminated culture.Reference Boyce, Nadeau and Dumigan 16
A recent internal quality control study performed at the University of Nebraska Medical Center (unpublished) indicated that blood culture volumes were not meeting recommended levels and that draw site was implicated as a possible reason for the insufficient volumes. The goal of this survey of blood cultures was to model the impact of draw site and other clinical variables on the volume of blood cultures in usual clinical practice circumstances.
METHODS
Blood Culture Bottle Processing
During a consecutive 6-day observation period, all blood cultures performed on adult patients at our facility were studied to determine the volume of blood deposited in each culture bottle. Blood cultures were performed using the Bactec Plus Aerobic and Bactec Lytic Anaerobic bottles in conjunction with a continuous blood culture monitoring system (BACTEC 9240; Becton Dickinson Microbiology Systems, Franklin Lakes, NJ). Institution guidelines dictate that dedicated phlebotomy staff perform peripheral venipuncture draws and cultures taken from a central catheter are done by nursing staff. Per institution and manufacturer guidelines, blood cultures are drawn as a set (ie, 1 aerobic and 1 anaerobic bottle), with a target blood volume of 10 mL per bottle, or 20 mL per set, with a minimum tolerance of 3 mL per bottle. If <6 mL total is recovered, it is advised that cultures should be performed as an aerobic bottle only. Blood cultures positive for microbial growth are removed from the monitoring system and undergo organism identification and susceptibility testing. Cultures are designated as contaminated if microbial growth is observed in only a single bottle within a multiple-draw blood culture set and identified organisms are consistent with skin flora (eg, coagulase-negative staphylococci, Corynebacterium spp., or viridans group streptococci).
Blood Volume Estimation
The volume of blood in each culture bottle was estimated by weight after incubation. The volume was calculated by subtracting the mean bottle weight preinoculation from the recorded weight with an adjustment for blood density (ie, 1.055 g/mL), according to the following formula: volume=(weight of bottle with blood – mean weight of preinoculated bottle)/blood density.Reference Bouza, Sousa, Rodriguez-Creixems, Lechuz and Munoz 5
Data Collection
The selection of clinical variables included in our model was based on 3 general categories that were anticipated to potentially influence volume recovery: ease of vascular access, patient factors, and phlebotomist factors. We hypothesized that it would be easier to obtain blood from a central venous catheter than peripheral venipuncture because of several factors including improved patient cooperation, reduced likelihood of infiltration and/or venous collapse, and procedural ease provided by pre-established access. Patient-specific factors that were thought to possibly influence volume recovery included hospital department, age, gender, body mass index (BMI), and mean arterial pressure. Potential phlebotomist factors included active antibiotic dosing and Charlson comorbidity index (CCI) score based on the premise that, with active antibiotic dosing or with higher CCI score, phlebotomists and nursing staff may perceive a greater need for higher blood volumes due to increased suspicion of true infection.
We recorded the blood volume, type of bottle (aerobic vs anaerobic), time of blood draw, and specimen number for each culture bottle. We then used the electronic medical record to obtain the following clinical variables: blood draw location (central venous catheter access vs peripheral venipuncture), microorganism grown, patient gender, body mass index (BMI), mean arterial pressure nearest time of blood draw, concomitant systemic antibiotic use, hospital department, and patient diagnoses according to International Classification of Disease, Ninth Revision (ICD-9) codes. We used the process defined by Quan et alReference Quan, Sundararajan and Halfon 17 , Reference Quan, Li and Couris 18 to translate hospital encounter ICD-9 codes to obtain an updated CCI score for each patient.
Statistical Analysis
For modeling, we used conditional hierarchical linear regression models with random effects for patient and draw occasion and a Kenward-Roger degrees-of-freedom correction to account for correlations between values collected from the same patient and during the same draw occasion.
RESULTS
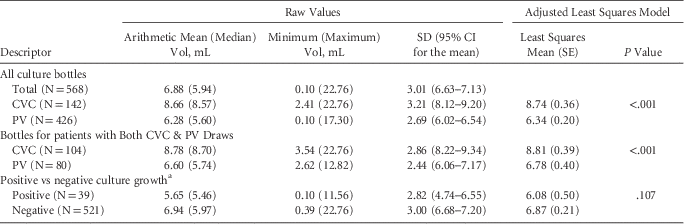
Data from 568 culture bottles from 128 unique patients and 273 unique draw occasions were evaluated. Table 1 shows the unadjusted and model-adjusted blood volume values based on blood draw site for all patients, limited to patients with cultures taken from both peripheral venipuncture and central venous catheter sites. The table also includes a comparison of volumes based on culture positivity. We recorded a culture positivity rate of 8.27% (47 of 568); 8 of these were determined to be contaminants, for an overall contamination rate of 1.4% (8 of 568), a 1.4% contamination rate for central venous catheter access (2 of 142), and a 1.4% contamination rate for peripheral venipuncture (6 of 426). Of the bottles collected from central venous catheters, 58.5% had >8 mL, but only 25.2% contained the recommended range of 8–10 mL, and 23.0% of the bottles collected from peripheral venipuncture contained >8 mL, with only 10.3% falling in the recommended 8–10 mL range.
Blood Culture Bottle Volumes

NOTE. CI, confidence interval; SE, standard error; CVC, central venous catheter access; PV, peripheral venipuncture.
a Does not include cultures determined to be contaminated.
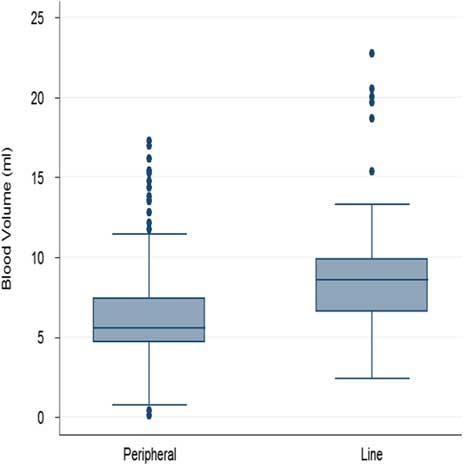
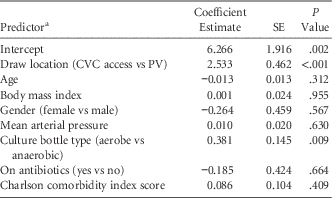
Our final multivariable model for the relationship between clinical variables and blood culture volume is presented in Table 2. Of the 8 variables included in our final model, only 2 reached statistical significance. We found that blood draws obtained from central venous catheters yielded 2.53 mL more blood (95% CI, 1.63–3.44 mL; P<.001) than those taken from peripheral venipuncture. Additionally, aerobic bottles contained 0.38 mL (95% CI, 0.1–0.67 mL; P=.009) more blood than the anaerobic bottles. Figure 1 shows the box-and-whisker plot for the volumes collected from peripheral venipuncture versus central venous catheters.
Box-and-whisker plot of blood culture volumes based on draw site—peripheral venipuncture (peripheral) versus central venous catheter (line) access. The median and the upper and the lower quartiles are given in the box. The whisker end lines are drawn at the sample values farthest from the median without exceeding 1.5 interquartile ranges beyond the 25th and 75th percentiles. Outliers beyond these points are indicated by dots.

Final Model for the Relationship Between Clinical Variables and Blood Culture Volume (N=437)

NOTE. SE, standard error; CVC, central venous catheter access; PV, peripheral venipuncture.
a For categorical variables, the coefficient estimate is the expected change in milliliter of blood volume for being in the first category versus being in the second category; the coefficient for the Charlson comorbidity index
score is the volume increase in milliliters expected after a score increase of 1 unit.
Some limitations on data collection were encountered; not all variables of interest could be retrieved within the electronic medical record. Hence, the final model used an N of 437 from 103 unique patients after excluding bottles from patients with any missing variable contained within the model. Hospital department was omitted from the final model because the type 3 test of fixed effects found that the department was not a significant predictor of culture volume (P=.578) and the numerous categories added unnecessary complexity. Although the small number of positive blood cultures precluded meaningful analysis, we observed no association between culture volume or draw location (ie, peripheral vs central venous catheter) and culture positivity.
DISCUSSION
Appropriate sample volume for blood culture remains an important factor in reducing contamination, increasing culture yield, and reducing time to detection. At our institution under normal practice conditions, blood culture volume is significantly greater when blood is obtained from a central venous catheter versus peripheral venipuncture. Although this observation may be explained by ease of access, the focus of the study was to identify clinical variables and to define their relationship to blood culture volume. The other significant finding from our study is that aerobic culture bottles contain greater blood volumes than anaerobic bottles. The greater volume noted in aerobic bottles is likely explained by the manufacturer and institutional guideline instructions to place less volume in the anaerobic bottle if the total volume for a culture set is <16 mL.
The practice of using catheter access for obtaining blood cultures is controversial. One argument in favor of this method is increased culture sensitivity. A 2008 systematic review by Falagas et alReference Falagas, Kazantzi and Bliziotis 19 found cultures obtained from a vascular catheter to be more sensitive and have better negative predictive value than those obtained from venipuncture.Reference Falagas, Kazantzi and Bliziotis 19 The sensitivity of blood cultures in the adult population is volume dependent with an increased yield of 0.6%–4.7% for each additional mL collected.Reference Hall, Ilstrup and Washington 2 – Reference Bouza, Sousa, Rodriguez-Creixems, Lechuz and Munoz 5 , Reference Plorde, Tenover and Carlson 9 , Reference Brown and Warren 20 , Reference Ilstrup and Washington 21 Unfortunately, low culture volume collection has long been a recognized clinical problem.Reference Mermel and Maki 3 , Reference Washington and Ilstrup 4 , Reference Kim, Kim, Lee, Choi and Kim 10 Using the same automated culture system that is in use at our institution, Bouza et alReference Bouza, Sousa, Rodriguez-Creixems, Lechuz and Munoz 5 showed a 3.3% increased detection rate for each additional milliliter cultured. Applying these findings to the variance in volume recovered from peripheral venipuncture versus central venous catheter access in our study, we would expect to see an 8.4% increase in detection rate among true-positive cultures. Based on recent patient census data and blood culture rates, we estimate that increasing the amount of blood collected by 2.5 mL (ie, the volume difference between central catheter and peripheral vein phlebotomy obtained cultures) would result in the detection of an additional ~220 patients with true bacteremia per year at our institution. Timely and accurate identification of patients with bacteremia has obvious clinical significance.
While increased volume may contribute to increased sensitivity among cultures taken from vascular catheters, there has been long-standing concern that regular use of vascular catheters for blood cultures may lead to false-positive results and negative consequences of contaminated blood cultures, namely increased financial cost and unnecessary use of antibiotics.Reference Baron, Miller and Weinstein 22 Therefore, we believe that institutional policy should (1) recommend the use of peripheral venipuncture as the generally preferred method to obtain blood for culture; (2) state that if a vascular catheter is thought to be the potential source of sepsis, blood cultures should be obtained from the catheter and the periphery; (3) continue to stress the importance of adequate volume of blood obtained regardless of source; and (4) recommend that if a vascular catheter is to be accessed to obtain blood for culture, additional measures should be taken to minimize the risk of contamination. 23
Increased culture volume generally results in a faster time to positivity.Reference Weinstein, Mirrett, Wilson, Reimer and Reller 8 – Reference Lin, Liu, Tien, Ho, Hsu and Lu 11 Blot et alReference Blot, Schmidt and Nitenberg 24 described the first method to use differential positivity times between catheter and peripheral venipuncture drawn cultures as a method for diagnosing catheter associated sepsis. They recommend having equivalent volumes in the peripheral venipuncture and the catheter-drawn cultures. However, many studies examining differential positivity time as a diagnostic tool did not monitor culture volume.Reference Park, Lee and Lee 25 – Reference Nunes, Marra, Edmond, da Silva Victor and Pereira 30 Our work introduces a possible confounder of the accuracy of differential time-to-positivity as a diagnostic tool due to the difference in volumes taken from peripheral venipuncture versus central venous catheter, and further studies may be warranted.
Our study has several limitations. Not all clinical variables could be linked to every blood draw occurrence, which reduced the final number of cultures included in our models. Additionally, our data set was derived over a short period, which could lead to bias. However, the blood culture positivity and contamination rates observed during the study period are similar to historic institution levels, which offers reassurance that our sample is representative of typical culture patterns. In addition, our observations herein are in keeping with our previous unpublished quality assurance survey. We did not obtain an illness severity score (eg, APACHE-II) at the time of blood draw, which has previously been shown to influence culture volumes and could have attributed to phlebotomy bias due to an increase in the perceived need for diagnostic accuracy.Reference Bouza, Sousa, Rodriguez-Creixems, Lechuz and Munoz 5 Finally, a possible confounder to our primary observation that blood cultures obtained from central venous catheters contain significantly greater volumes could be staff related and not intrinsic to the draw site. All catheter access is conducted by nursing staff, and venipuncture for blood culture is usually performed by dedicated phlebotomists. Notably, however, this is likely a standard protocol among other large academic and community health centers and supports the generalizability of our observations.
In conclusion, in examining the effect that pretest clinical variables have on blood culture volume, the volume of blood recovered from a central venous catheter was significantly greater than that obtained by peripheral venipuncture. To the best of our knowledge, this observation has not been previously documented, and it may have clinically important implications regarding the diagnostic yield of blood cultures and the application of the differential time-to-positivity test in determining whether an intravascular catheter is the source of bacteremia. When interpreting the results of blood cultures, clinicians must remain cognizant of the potential relationship between the site of sample acquisition (vascular catheter vs peripheral vein) and volume sampled, and they should seek to determine how this may influence test performance.
ACKNOWLEDGMENTS
We would like to thank Purnima Guda, PhD, for facilitating data extraction from the institution’s electronic medical record.
Financial support: No financial support was provided relevant to this article.
Potential conflicts of interest: All authors report no conflicts of interest relevant to this article.