Introduction
Functional materials possess peculiar native properties such as magnetism, energy storage, superconductivity, piezoelectricity, and ferroelectricity, among others. These can be exploited in several areas of materials science. Modulation of properties is achieved through several routes, such as chemical doping(s), defect creation/control, nanostructuring, and thin-film fabrication, with the aim of enhancing or tuning specific characteristics. Hydrostatic pressure is an effective tool to control the fundamental properties of a functional material, and its effects can possibly be reproduced through chemical substitution within the lattice (resulting in chemical pressure and strain in thin films).
Among the different structural families of functional materials, perovskites are ubiquitous, being the basic motif of several superconductors, magnets, energy-storage, ferroelectric, and piezoelectric materials. They are intriguing materials from a structural point of view, characterized by subtle structural phase transitions (induced by temperature and chemical doping), strongly affecting their physical properties, and by a relatively soft lattice (easily deformable). These two characteristics make them ideal candidates for high-pressure investigations.
To illustrate the properties of functional materials manipulated by the application of an external pressure, we present selected results of high-pressure studies on two highly representative examples of perovskite-based materials—manganites and organic–inorganic halide perovskites. While possessing the same crystal structure, these two classes of materials show significantly different features and are suited to different potential applications, in particular, colossal magnetoresistance (manganites) and photovoltaics (hybrid perovskites). In both cases, through high-pressure studies, we obtain a deeper understanding of the underlying microscopic mechanisms related to magnetoresistant or photovoltaic responses.
Manganites
Mixed-valence manganites, A1-x A′ x MnO3 (where A is a trivalent rare-earth and A′ a divalent alkaline-earth metal), show rich phase diagrams with a variety of magnetic, structural, and electronic phases upon varying x and temperature T. Reference Dagotto, Hotta and Moreo1–Reference Tao, Niebieskikwiat, Kie, Schoefield, Wu, Li and Zhu3 Several hole-doped manganites (x < 0.5) show colossal magnetoresistance (CMR), an anomalously large variation of resistance on applying a magnetic field, which results from a complex interplay between structural, magnetic, and electronic degrees of freedom driven by internal (x, chemical composition) or external (T, P, magnetic field) variables. Experimental and theoretical investigations concur that Jahn–Teller (JT) distortion of MnO6 octahedra is mainly responsible for CMR and the related insulator-to-metal transition (IMT). (The Jahn–Teller distortion refers to a nonlinear molecule in an electronically degenerate state, which undergoes distortion to remove the degeneracy by lowering the symmetry and thus lowering the energy.) Doped compounds are made by regular [MnO6]+4 and JT distorted [MnO6]+3 octahedra. The distortion removes the degeneracy of the outer Mn electrons and gives rise to a local potential well, which, in turn, localizes charge carriers. This self-trapping mechanism, whose efficiency depends on the extent of the octahedral distortion, profoundly affects the transport properties of manganites, ranging from insulating to metallic behavior. Reference Millis4,Reference Millis, Littlewood and Shraiman5
The archetypal CMR manganite, La1–x Ca x MnO3 (0.2 < x < 0.5), undergoes a transition from a paramagnetic-insulating to a ferromagnetic-metallic (FM-M) phase on decreasing T. This magnetoconductive coupling is ascribed to the magnetic double-exchange (DE) interaction Reference Zener6 that develops between ions in different oxidation states, (e.g., Mn+3 and Mn+4) increasing the electron mobility on entering the FM phase. IMT and CMR are thus governed by the competition between charge-localizing JT octahedral distortion and the DE that increases charge delocalization on entering the FM phase.
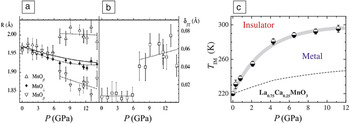
The metallic character of the system is expected to be enhanced by a reduction of the JT distortion by applying either chemical pressure (i.e., increasing the ionic radius of the rare earth), or hydrostatic pressure (i.e., compressing the volume around the rare earth). A strict equivalence between the two kinds of pressure was claimed, Reference Hwang, Cheong, Radaelli, Marezio and Batlogg7 and the first high-pressure experiments carried out at the end of the 1990s confirmed this idea. Nevertheless, this equivalence holds only in the low-P regime, whereas significant deviations are observed at high P. Reference Meneghini, Levy, Mobilio, Ortolani, Nunez-Reguero, Kumar and Sarma8 X-ray diffraction Reference Postorino, Congeduti, Dore, Sacchetti, Gorelli, Ulivi, Kumar and Sarma9 and infrared Reference Sacchetti, Postorino and Capone10 measurements on high-pressure La0.75Ca0.25MnO3 provided the structural evolution ( Figure 1a–b) and the determination of the IMT temperature, T IM(P), over a large P-region (Figure 1c). Over the 0–6 GPa P-range, the octahedra symmetrize and T IM(P) increases almost linearly with pressure, whereas, above 6–7 GPa, T IM(P) approaches an asymptotic value of approximately 300 K and the JT octahedral distortion abruptly increases. This behavior, also observed in other manganites, depicts a more complex scenario with the activation of a localizing interaction in the high-pressure regime.
(a) Mn-O distances and (b) orthorhombic distortion versus pressure (P) for La0.75 Ca0.25MnO3. Reprinted with permission from Reference Meneghini, Levy, Mobilio, Ortolani, Nunez-Reguero, Kumar and SarmaReference 8. © 2002 IOP Publishing. (c) P-T phase diagram, symbols represent experimental data, and the gray line is the best-fit curve from an empirical exponential function. Reference Hwang, Cheong, Radaelli, Marezio and Batlogg7

Theoretical Reference Baldini, Capogna, Capone, Arcangeletti, Petrillo, Goncharenko and Postorino11 and experimental Reference Congeduti, Postorino, Caramagno, Nardone, Kumar and Sarma12 studies have demonstrated that this interaction (magnetic superexchange) gives rise to antiferromagnetic-insulating (AFM-I) domains and that these new domains, competing with the DE-assisted conduction through FM domains, slow down the increase of T IM(P). Phase inhomogeneity thus appears to be relevant for CMR, where effective conduction paths are established among FM-M domains upon application of a magnetic field.
The new emerging microscopic scenario Reference Sarma, Shanthi, Barman, Hamada, Sawada and Terakura13 is in agreement with the idea that manganites are intrinsically inhomogeneous and show a strong tendency toward phase separation, involving FM-M and AFM-I domains. Reference Dagotto, Hotta and Moreo1 High-pressure studies on the parent LaMnO3 manganite, where the DE mechanism does not apply and CMR is not observed at ambient pressure, were also carried out. LaMnO3 at ambient conditions is regarded as the archetypal cooperative JT system and it transforms into an AFM (A-type) insulator below T N = 140 K. Reference Loa, Adler, Grzechnik, Syassen, Schwarz, Hanfland, Rozenberg, Gorodetsky and Pasternak14
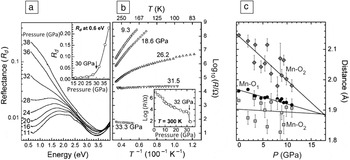
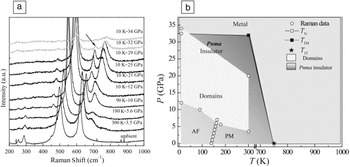
Optical, x-ray diffraction, and transport measurements on LaMnO3 suggested the JT distortion to be suppressed above 18 GPa (Mn-O distances in Figure 2c) and showed the onset of a metallic phase above the insulator-to-metal-transition pressure P IM ∼ 32 GPa (Figure 2a–b). Reference Baldini, Struzhkin, Goncharov, Postorino and Mao15 These results fostered an intense debate on the nature of the pressure-driven IMT and the disappearance/persistence of the JT distortion. Reference Congeduti, Postorino, Caramagno, Nardone, Kumar and Sarma12 A recent high-pressure Raman experiment on LaMnO3 shows the emergence of a phase-separation regime consisting of domains of JT-distorted and regular MnO6 octahedra ( Figure 3a) over a large P-T region, including the IMT (Figure 3b). Reference Baldini, Muramatsu, Sherafati, Mao, Malavasi, Postorino, Satpathy and Struzhkin16 The simultaneous appearance of phase separation and IMT thus closely resembles the conditions under which CMR is observed in doped compounds.
(a) Reflectance spectra for LaMnO3 at selected pressures; (b) resistivity versus 1/T at selected pressures; (c) Mn-O distances versus pressure (P). Reprinted with permission from Reference Loa, Adler, Grzechnik, Syassen, Schwarz, Hanfland, Rozenberg, Gorodetsky and PasternakReference 14. © 2001 American Physical Society.

(a) LaMnO3 Raman spectra at selected pressures and temperatures. The two peaks at around 600–700 cm–1 are spectroscopic markers of distorted/regular octahedra. (b) Pressure-temperature (P-T) phase diagram for LaMnO3. Reference Congeduti, Postorino, Caramagno, Nardone, Kumar and Sarma12 Note: AF, antiferromagnetic; PM, paramagnetic.

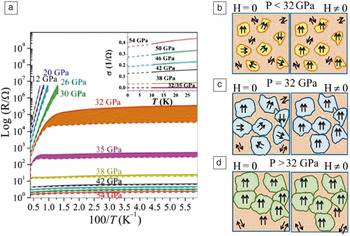
Occurrence of CMR in the phase-separation region close to IMT ( Figure 4a) was recently observed. Similar to mixed-valence manganites, a phase separation between FM-M and AFM-I domains was conjectured following the scheme in Figure 4b–d—charge transport among small, weakly connected FM-M domains is inhibited at low-P, whereas approaching P IM, the FM-M domains grow and, after crossing a percolation threshold, conductive paths are established. Applying a magnetic field under these conditions aligns the FM-M domains and enhances the charge mobility, giving rise to CMR. On further increasing the pressure, the effect of the magnetic field is strongly reduced and, although the metallic character of the system still increases, CMR vanishes. The balance between small- and large-scale interactions (interatomic versus interdomains) affects the onset and the magnitude of MR. Shaping the interaction over the two scales could represent a new and effective route for engineering MR materials.
(a) Resistivity versus 100/T at selected pressure with (full line) and without (dashed lines) applied magnetic field. Inset: conductivity versus T at selected pressures. (b–d) Schematic of the microscopic scenario at pressures below, at, and above P IM with (right) and without (left) applied magnetic field, respectively. Reference Sarma, Shanthi, Barman, Hamada, Sawada and Terakura13

Organic–inorganic hybrid perovskites
Hybrid organic–inorganic perovskites (HOIPs) are nowadays among the most investigated materials, due to their potential use in photovoltaics and optoelectronics. Reference Brenner, Egger, Kronin, Hodes and Cahen17–Reference Saparov and Mitzi19 These semiconducting compounds adopt the usual perovskite structure, ABX3, where A is a monovalent organic cation (protonated amine), B is a divalent metal ion, and X is a halogen. The most studied hybrid perovskite is MAPbI3 (MA = methylammonium, CH3NH3 +), also called MAPI, which was the first composition used as sensitizer in a photovoltaic cell, with a conversion efficiency of 3.8%. 20 The huge amount of research carried out on HOIPs in the last few years increased the conversion efficiency up to 22.1% in 2016, making it competitive with Si-based photovoltaics cells. Reference Brenner, Egger, Kronin, Hodes and Cahen17 The possible rich cation substitution(s) allowed by the perovskite lattice opened the way to effective tuning of HOIPs properties. Reference Kieslich, Sun and Cheetham21 While the use and optimization of hybrid perovskites in photovoltaic devices had impressive growth in a short time, many issues related to the microscopic origin of such performance are yet to be clearly understood. In this regard, high-pressure techniques can be used to manipulate the perovskite lattice, and in turn, modulate the optoelectronic properties with the aim of getting insights into the structure–properties correlation of HOIPs and to possibly enhance their performance.
A number of hybrid perovskite compositions have been the object of high-pressure studies, in particular, MAPbCl3, MAPbBr3, MAPbI3, FAPbI3, and FAPbBr3 (FA = formamidinium). Reference Capitani, Marini, Caramazza, Postorino, Garbarino, Hanfland, Pisanu, Quadrelli and Malavasi22–Reference Wang, Wang, Xiao, Zeng and Zou27 The role of pressure on the MAPbX3 series (X = I, Br, and Cl) is of interest because the A and B cations are fixed, while the anion is progressively changed along the 16 group, thus changing the size and the hardness of the anion.
At ambient pressure (and RT), MAPbBr3 and MAPbCl3 have a cubic lattice (space group, Pm-3m), while MAPbI3 is tetragonal (space group, I4/mcm) and becomes cubic by heating to about 50°C. Reference Mancini, Quadrelli, Amoroso, Milanese, Boiocchi, Sironi, Patrini, Guizzetti and Malavasi28 High-pressure x-ray diffraction (XRD) performed in diamond anvil cells (DACs) with applied pressures up to tens of GPa has highlighted several common features among different samples of MAPbX3 perovskites. All the compositions undergo a structural phase transition at relatively low pressures (0.3–1 GPa) to a cubic phase, which is usually correlated to the rotation of the MA group. Further increase in pressure to around 2–2.5 GPa leads to a more significant distortion of the perovskite lattice, which may either transform into an orthorhombic structure (MAPbBr3 and MAPbCl3), or to a highly disordered cubic cell (MAPbI3), which are related to a significant tilting distortion of the [PbX6]4– octahedra. Reference Capitani, Marini, Caramazza, Postorino, Garbarino, Hanfland, Pisanu, Quadrelli and Malavasi22,Reference Szafranski and Katrusiak23,Reference Wang, Wang, Xiao, Zeng and Zou27
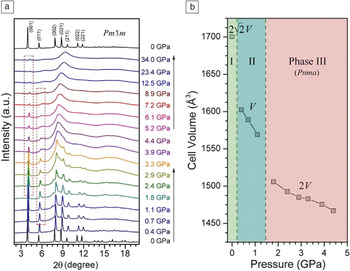
One interesting and peculiar phenomenon of MAPbX3 perovskites under pressure is the amorphization of the structure. This process starts around 2.5–3 GPa and, depending on the details of the experiments, results in a fully amorphous phase in the 10–20 GPa interval. Reference Capitani, Marini, Caramazza, Postorino, Garbarino, Hanfland, Pisanu, Quadrelli and Malavasi22,Reference Szafranski and Katrusiak23,Reference Wang, Wang, Xiao, Zeng and Zou27 Even more surprisingly, all the compounds recover their ambient pressure crystal structure upon pressure release, which is an uncommon behavior for a crystalline material. The structural evidence collected suggests that the amorphous material retains the cross-linking PbX6 perovskite skeleton, but with highly distorted MA molecules, as also suggested from a single crystal study on MAPbI3. Reference Szafranski and Katrusiak23 Figure 5 shows the structural behavior of MAPbBr3 as a function of pressure, highlighting the evolution of the amorphous phase appearing around 3 GPa (Figure 5a), while reporting the trend of the lattice parameters and of the different crystal structures observed as a function of pressure (Figure 5b). Reference Wang, Lu, Yang, Wen, Yang, Ren, Wang, Lin and Zhao24
(a) Synchrotron x-ray diffraction pattern of MAPbBr3 during compression up to 34 GPa and decompression (top pattern). (b) Cell volume evolution of MAPbBr3 as a function of pressure at room temperature. Reprinted with permission from Reference Wang, Lu, Yang, Wen, Yang, Ren, Wang, Lin and ZhaoReference 24. © 2015 American Chemical Society.

Such tuning of the perovskite lattice at relatively low pressures, especially the appearance of the amorphous phase, is of great interest, particularly when related to the evolution of the optical properties under pressure. From high-pressure photoluminescence studies, we can determine the variation of the bandgap as a function of pressure, and this variation can be correlated with the structural features previously described. Reference Capitani, Marini, Caramazza, Postorino, Garbarino, Hanfland, Pisanu, Quadrelli and Malavasi22–Reference Wang, Wang, Xiao, Zeng and Zou27 Again, several similarities are found for the MAPbX3 (X = Cl, Br, and I) perovskites, which undergo a first reduction of the bandgap (E g) values within the fully crystalline high-pressure phases, mainly due to the shortening of the Pb-X bond lengths, followed by an increase of the E g value when the amorphization process occurs, which strongly distorts the Pb-X-Pb (X = Cl, Br, I) bond angles.
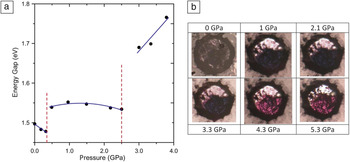
A representative example of the bandgap evolution with pressure is presented in Figure 6 for the MAPbI3 compound. Figure 6a shows changes in E g with pressure, while Figure 6b highlights the color change of MAPbI3 inside the DAC. Reference Capitani, Marini, Caramazza, Postorino, Garbarino, Hanfland, Pisanu, Quadrelli and Malavasi22,Reference Szafranski and Katrusiak23
(a) Pressure dependence of the optical energy gap of MAPbI3. The vertical dashed red lines define the pressure ranges of existence of different crystal structure. (b) Optical micrographs of MAPbI3 inside the diamond anvil cell at different pressures. Reference Capitani, Marini, Caramazza, Postorino, Garbarino, Hanfland, Pisanu, Quadrelli and Malavasi22,Reference Szafranski and Katrusiak23

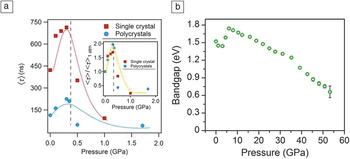
Another intriguing effect induced by relatively low applied pressure is the tuning of the carrier lifetime (τ) (i.e., the average time it takes for the carrier to recombine), which is a key property influencing the photovoltaic properties. Reference Kong, Liu, Gong, Hu, Schaller, Dera, Zhang, Liu, Yang, Zhu, Tang, Wang, Wei, Xu and Mao29 For both MAPbI3 and FAPbI3 compounds, an increase in the mean carrier lifetime 〈τ〉 of 100% or more has been observed at 0.3 and 1.7 GPa, respectively, Reference Liu, Kong, Gong, Yang, Mao, Hu, Liu, Schaller, Zhang and Xu25,Reference Kong, Liu, Gong, Hu, Schaller, Dera, Zhang, Liu, Yang, Zhu, Tang, Wang, Wei, Xu and Mao29 as shown in Figure 7a for MAPbI3. Reference Kong, Liu, Gong, Hu, Schaller, Dera, Zhang, Liu, Yang, Zhu, Tang, Wang, Wei, Xu and Mao29 Such enhancement of carrier lifetime could be used to enhance the photovoltaic properties, for example, by inducing strain through substrate engineering.
(a) Pressure dependence of the mean-carrier lifetime for MAPbI3 single- and polycrystalline samples. Peak values in carrier lifetimes of MAPbI3 were observed at 0.3 GPa. (Inset) Normalized results compared with the values of 〈τ〉 measured at ambient pressure. Reprinted with permission from Reference Kong, Liu, Gong, Hu, Schaller, Dera, Zhang, Liu, Yang, Zhu, Tang, Wang, Wei, Xu and MaoReference 29. © 2016 American Institute of Physics. (b) Bandgap variation with pressure for MAPbI3. Reprinted with permission from Reference Jaffe, Lin, Mao and KarunadasaReference 30. © 2017 American Chemical Society.

Finally, the achievement of a metal state (metallization) on MAPbI3 induced by the high-pressure application was recently reported. Reference Jaffe, Lin, Mao and Karunadasa30 Figure 7b shows E g as a function of pressure showing a variation from ca. 1.5 eV (semiconductor) to about 0.6 eV (metal) above 50 GPa. Reference Jaffe, Lin, Mao and Karunadasa30 These results strongly suggest that researchers can make use of the beneficial effects induced by pressure by engineering the compositions of hybrid perovskites (chemical pressure) or by designing devices which may induce a strain on the perovskite layer. Reference Postorino and Malavasi31
Summary
This article discussed the role of external applied pressure in modulating and tuning the properties of functional materials. In particular, we focused on two classes of perovskite-lattice-based compounds, which represent appealing materials from both the basic and applied point of view. The study of structural, optical, electrical, and magnetic properties in DACs opens the possibility of unprecedented comprehension of the microscopic phenomena underlying the functional properties. This knowledge, in turn, paves the way to the design of new and optimized materials through chemical substitution (i.e., chemical pressure) as well as device fabrication with suitable substrates inducing a strain on the active phase. The lesson we can learn from high-pressure studies on functional materials is pivotal, and thanks to the continuous development of suitable equipment for more challenging experiments, such areas of applied science will become more and more central in materials chemistry research.

Paolo Postorino is a professor of condensed-matter physics in the Physics Department of the Sapienza Università di Roma (The Sapienza University of Rome), Italy. He has been the head of the High-Pressure Spectroscopy Research Group since 2000. His research interests include the study of strongly correlated materials, including transition-metal oxides and high-Tc superconductors. His current research focuses on low-dimensional materials such as single/few layer systems, nanotubes, and nanowires, as well as plasmonic nanoparticles. He has authored more than 160 papers. Postorino can be reached by phone at +39 06 4991 3502 or by email at paolo.postorino@roma1.infn.it.

Lorenzo Malavasi is a professor of materials chemistry in the Chemistry Department at the University of Pavia, Italy. He was the recipient of the 2008 Alfredo di Braccio Prize for Chemistry of the Accademia Nazionale dei Lincei, and was featured in the “Emerging Investigator” issues of the Journal of Materials Chemistry and the journal Chemical Communications in 2010 and 2011. His research focuses on solid-state chemistry, with a particular interest in the investigation of structure–properties correlation in functional oxides, hybrid organic–inorganic perovskites, and high-temperature superconductors. He is the editor of the journal New Superconducting Materials. He has authored more than 140 papers. Malavasi can be reached by phone at +39 0382 987921 or by email at lorenzo.malavasi@unipv.it.