


Introduction
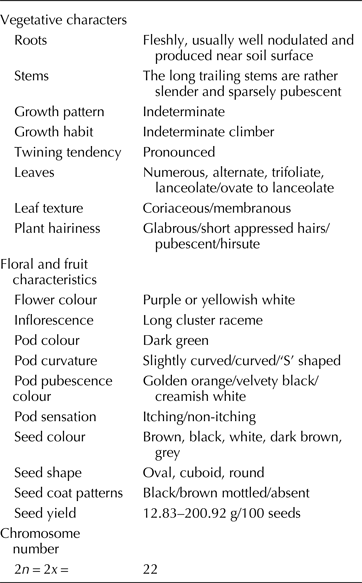
Mucuna pruriens (L.) DC – described as a self-pollinated species is a tropical legume classified within the Phaseoloid clade of Leguminosae, which also include soybean, common bean, mung bean and relatives. Reported to be native of eastern India and southern China (Wilmot-Dear, Reference Wilmot-Dear1987) – it is now distributed in several parts of the World including tropics exhibiting tremendous morphological and biochemical variability. It grows well under warm, moist conditions at altitudes below 1600 m both in wild and cultivated forms (Buckles, Reference Buckles1995; Pugalenthi et al., Reference Pugalenthi, Vadivel and Siddhuraju2005). Wild varieties are recognizable by highly itching pod due to which they are known by the name ‘cow itch’ or ‘itching bean’, while landraces, commonly termed as ‘velvet bean’ bear non-itching pods, and are grown in household/home-gardens as green vegetable in parts of central and southern India (Pugalenthi and Vadivel, Reference Pugalenthi and Vadivel2007a, Reference Pugalenthi and Vadivelb). It has a diploid genome with 22 pairs of chromosomes (2n = 2x = 22) (Sastrapradja et al., Reference Sastrapradja, Sastrapradja, Aminah, Lubis and Idris1974) and an estimated genome size of 1361 Mbp. The general characteristics of M. pruriens are presented in Table 1.
General characters of Mucuna pruriens (L.) DC
Agronomic and medicinal benefits
Cultivated velvet bean (M. pruriens var. utilis) offers promising agronomic benefits (Fig. 1). It produces seed yield of 2000 kg/hectare (Buckles, Reference Buckles1995); performs well under dry farming and low soil fertility conditions (Siddhuraju et al., Reference Siddhuraju, Becker and Makkar2000); shows resistance against a wide ranging diseases (Eilitta et al., Reference Eilitta, Bressani, Carew, Carsky, Flores, Gilbert, Huyck, St. Laurent, Szabo, Flores, Eilittä, Myhrman, Carew and Carsky2002); exhibits allelopathic properties (Fujii et al., Reference Fujii, Shibuya and Yasuda1991) and effective in lowering nematode population (Carsky and Ndikawa, Reference Carsky, Ndikawa, Buckles, Eteka, Osiname, Galiba and Galiano1998; Queneherve et al., Reference Queneherve, Topart and Martiny1998). Its impact as green manure cover crop is documented in a number of earlier reports (Eilitta et al., Reference Eilitta, Bressani, Carew, Carsky, Flores, Gilbert, Huyck, St. Laurent, Szabo, Flores, Eilittä, Myhrman, Carew and Carsky2002; Jorge et al., Reference Jorge, Eilitta, Proud, Barbara Maasdorp, Beksissa, Ashok Sarial and Hanson2007). Fast-growing habit of this plant allows ground-cover in 60–90 d resulting in large biomass accumulation vis-à-vis other cover crops (Tarawali et al., Reference Tarawali, Manyong, Carsky, Vissoh, Osei-Bonsu and Galiba1999). Due to this, and high N2 fixing ability, it is regarded as ‘featured example of green manures contribution to the sustainable agricultural system’ (Buckles, Reference Buckles1995). Besides, the seeds are also traditionally used as minor food by many indigenous communities in Asia and Africa (Iyayi and Egharevba, Reference Iyayi and Egharevba1998; Diallo et al., Reference Diallo, Kante, Myhrman, Soumah, Cissé, Berhe, Flores, Eilittä, Myhrman, Carew and Carsky2002). The seed powder can be beneficially supplemented with the livestock feed (Burgess et al., Reference Burgess, Hemmer and Myhrman2003; Muinga et al., Reference Muinga, Saha and Mureithi2003) and is a source high value industrial starch (Betancur-Ancona et al., Reference Betancur-Ancona, Chel-Guerrero, Bello-Pérez and Dávila-Ortiz2002; Lawal and Adebowale, Reference Lawal and Adebowale2004). Seed oil is used in the preparation of paint, polish, resin, dye, wood varnish, skin cream and soap (Ajiwe et al., Reference Ajiwe, Okeke, Nnabuike, Ogunleye and Elebo1997).
Overview on uses of M. pruriens (adopted from Bhat and Karim, Reference Bhat and Karim2009).

M. pruriens has a rich history in Ayurvedic system of Indian medicine, where the seeds are used as an integral part of over 200 drug formulations. It is reported to possess anti-diabetic, anti-neoplastic, anti-microbial, aphrodisiac and learning and memory enhancing properties (Oudhia, Reference Oudhia2002). Importantly, its efficacy in the treatment of Parkinson's disease is well recognized both in the alternative and allopathic system of medicine. When used as drug, 3,4 dihydroxy-L-phenylalanine (L-Dopa), which is copiously present in seeds crosses blood-brain barrier and acts as a precursor for the synthesis of neurotransmitter drug dopamine thus improving the dopamine concentration in Parkinson's patients (Farooqi et al., Reference Farooqi, Khan and Asundhara1999; Kavitha and Thanagmani, Reference Kavitha and Thanagmani2014). More recently it has also been shown to promote male fertility by recovering spermatogenic losses in rats (Singh et al., Reference Singh, Sarkar, Tripathi and Rajender2013).
Taxonomy
Mucuna Adans. include 100 species of annual and perennial legumes of pantropical distribution (Buckles, Reference Buckles1995). It has been revised by Wilmot-Dear for China and Japan (Reference Wilmot-Dear1984), the Indian subcontinent and Burma (Reference Wilmot-Dear1987), the Pacific (Reference Wilmot-Dear1989), Philippines (Reference Wilmot-Dear1990), Thailand, Indochina and the Malay Peninsula (Reference Wilmot-Dear1991). The genus was earlier subdivided into two subgenera, Stizolobium P. Browne and Mucuna. Stizolobium was first reported by Browne in 1736 to describe the cow-itch plant in Jamaica, commonly known as M. pruriens in the USA. However, (Bort, Reference Bort1909) showed the differences between the two especially in the shape of the hilum. The genus Stizolobium was however used to distinguish velvet bean from the perennial Mucuna sp., but this distinction was not maintained (Bailey, Reference Bailey1947; Burkill, Reference Burkill1966). As a result, Stizolobium was considered a synonym, and all its species were classified in the genus Mucuna (Capo-chichi et al., Reference Capo-chichi, Weaver and Morton2001). As a result, Stizolobium was considered a synonym, and all its species were classified in the genus Mucuna (Capo-chichi et al., Reference Capo-chichi, Weaver and Morton2001). Systematic studies involving rbcL and matK sequences established genus Mucuna as member of sub tribe Erythrininae – within the larger Phaseoloid group at a strong bootstrap support of 93%. Moreover, Mucuna (Phaseoleae – Erythrininae), like core Desmodieae taxa, lacked the rp12 intron (Bailey et al., Reference Bailey, Doyle, Kajita, Nemoto and Ohashi1997), and was strongly supported as sister to core Desmodieae in the rbcL trees (Doyle et al., Reference Doyle, Chappill, Bailey, Kajita, Herendeen and Bruneau2000; Lee and Hymowitz, Reference Lee and Hymowitz2001). Mucuna was created along with Desomodieae in one of the earliest splits in Phaseoloid history around 15 million years ago (Stefanovic et al., Reference Stefanovic, Bernard, Jeffrey and Jeff2009).
Notwithstanding this elucidation, considerable taxonomic confusions exist even now within this genus with several synonyms reported both at the species and sub-species level (Duke, Reference Duke1981). Quite a few taxa that were formerly considered separate species such as Mucuna cochinchinensis, Mucuna hassjoo, Mucuna nivea and Mucuna utilis are now shown to be merely varieties of M. pruriens (Burkill, Reference Burkill1966; Awang et al., Reference Awang, Buckles and Arnason1997). In addition, even within M. pruriens, two widely known botanical varieties: var. pruriens and var. utilis, presence of third group: var. hirsuta has been suggested by Wilmot-Dear (Reference Wilmot-Dear1987). Var. hirsuta was earlier classified as an independent species (Ellis, Reference Ellis1990; Saldanha, Reference Saldanha1996); but subsequent revisions especially by Wilmot-Dear (Reference Wilmot-Dear1987) categorically suggested its inclusion under the botanical varieties of M. pruriens. However, literatures continue to treat var. hirsuta as an independent species (Rajaram and Janardhanan, Reference Rajaram and Janardhanan1991). Such problems are even more prevalent in cultivated velvet bean, where extensive exchange of seed materials over the years has led to the emergence of several local names based on cultivation location and/or popular names with which they were introduced. Moreover, presence of several naturalized hybrids has also complicated this problem. Consequently literatures are ambiguous on the description of the species and such anomalies, while predominant in M. pruriens, are not uncommon in other taxa of this genus. Because of this and other confusions surrounding the taxonomy, it is necessary to conduct research both at the species and sub-species level to assess the phenetic relationships to place the species in a right taxonomic and phylogenetic perspective. Besides, the ongoing efforts under legume diversity assessment project by Asia-Pacific Biodiversity Observation Network named, among others, Mucuna Adans. as representative genera for genus specific phylogenetic diversity assessment using DNA sequence information. In view of this, the present authors have used karyotype and nrITS and cp-psbA-trnH gene sequences for barcoding and phylogenetic studies in Mucuna sp. the details of which are given elsewhere in this paper.
Gene pool collection and evaluation
Germplasm of M. pruriens is maintained in several research institutes/organizations across the World. This includes: US Department of Agriculture (USDA); International Institute of Tropical Agriculture, Nigeria; Centro Internacional de Agricultura Tropical (CIAT), Colombia; AVRDC – The World Vegetable Centre, Taiwan; National Biological Institute, Indonesia etc., (Jorge et al., Reference Jorge, Eilitta, Proud, Barbara Maasdorp, Beksissa, Ashok Sarial and Hanson2007). In India, a few national research organizations viz., National Bureau of Plant Genetic Resources (NBPGR), New Delhi (Jorge et al., Reference Jorge, Eilitta, Proud, Barbara Maasdorp, Beksissa, Ashok Sarial and Hanson2007; Archana Raina et al., Reference Archana Raina, Tomar and Dutta2012); Indian Institute of Horticultural Research, Bangalore (Mamatha et al., Reference Mamatha, Siddaramappa and Shivananda2010); Jawaharlal Nehru Tropical Botanic Garden and Research Institute, Thiruvananthapuram (Padmesh et al., Reference Padmesh, Reji, Jinish Dhar and Seeni2006); Zandu Foundation for health care, Valsad, Gujarat (Krishnamurthy et al., Reference Krishnamurthy, Chandrokar, Kalzunkar, Palsule Desai, Pathak and Gupta2005); Arya Vaidya Sala, Kottakkal; Bharathiar University, Coimbatore (Siddhuraju and Becker, Reference Siddhuraju and Becker2005) etc. are reportedly maintaining M. Pruriens germplasm even though exact number of collections available with these institutes is not known, except 182 reported in case of NBPGR.
Natural population of M. pruriens exhibits significant variations in pod, seed and flower characteristics. Some of the earliest clues on genetics governing them came from the pioneering works of Lubis and co-workers during 1970s and 80s. M. pruriens produces two distinct pod hair phenotypes – long rough and short smooth types. Aminah et al. (Reference Aminah, Sastrapradja, Lubis, Sastrapradja and Idris1974) showed that the former is produced only in wild genotypes and the cultivated type possesses smooth ones. Further, it was shown that this character is controlled by two genes viz., R and N and sometime abnormalities and pollen sterility results in recessive alleles either in homozygous or heterozygous condition, which results in alternative phenotypes (Lubis et al., Reference Lubis, Sastrapradja, Lubis and Sastrapradja1979). Similarly, in case of flower colour, of the two – white and purple flower colours produced by the plant, purple is dominant over the white and the genes controlling those lies on one locus (Lubis et al., Reference Lubis, Sastrapradja, Lubis and Sastrapradja1978). In case of seed coat colour, it was demonstrated that the range of phenotypes – from dark black to white including different shades of brown and mottled ones appear due to multigenic factors (Lubis et al., Reference Lubis, Sastrapradja, Lubis and Sastrapradja1980). Several independent evaluation both in India and elsewhere established good diversity for desirable traits in M. pruriens germplasm. Bennet-Lartey (Reference Bennett-Lartey1998) found major variability for morphological and phenological traits among velvet bean accessions from Ghana and identified early maturing genotypes. In India, good variability for traits such as days to flowering, fertility index, seed recovery percentage, harvest index etc. have been observed (Gurumoorthi et al., Reference Gurumoorthi, Senthil Kumar, Vadivel and Janardhanan2003). This lead to identification of early and late flowering accessions both in itching and non-itching genotypes in addition to elite lines producing bold seeds, higher seed weight with favourable physico-chemical properties such as swelling capacity, swelling index, hydration capacity and hydration index (Krishnamurthy et al., Reference Krishnamurthy, Chandrokar, Kalzunkar, Palsule Desai, Pathak and Gupta2005). Itching trichome lines also possessed higher L-Dopa (4.36–6.12%) content over non-itching ones (2.30–4.18%) possibly due to selection. Besides, nitrogen fixing ability of different M. pruriens accessions was found to have positive correlation with nodule number, nodule biomass and content of active principle in seeds (Mamatha et al., Reference Mamatha, Shivananda and Siddaramappa2006). These findings are also corroborated in studies by other workers (Pugalenthi and Vadivel, Reference Pugalenthi and Vadivel2007a, Reference Pugalenthi and Vadivelb; Mamatha et al., Reference Mamatha, Siddaramappa and Shivananda2010).
L-Dopa trait: variability in gene pool and genotype and environment (G × E) interaction effects
Of the numerous active principles present in M.pruriens, the most intriguing is L-Dopa – which is present in copious quantity in seeds (1.4–9.1%). Biochemically a non-protein amino acid produced as an intermediary product in the enzymatic synthesis of dopamine from L-tyrosine (Fig. 2) – its therapeutic potential against Parkinson's disease is established beyond uncertainty (Soares et al., Reference Soares, Marchiosi, Soares, Lima, Santos and Ferrarese-Filho2014). However, the drug is also known to induce severe side effects under non-diseased conditions in human as well as diminish performance and health in livestock (Gray et al., Reference Gray, Tse, Brian, Kim, Aaron, McMurtray and Nakamoto2013). Due to this, it is regarded as greater risk among all the anti-nutritional substances present in Mucuna seeds (Szabo, Reference Szabo2003).
Biosynthesis of dopamine (courtesy: Barron et al., Reference Barron, Sovik and Cornish2010).

According to Lorenzetti et al. (Reference Lorenzetti, MacIsaac, Arnason, Awang, Buckles, Buckles, Eteka, Osiname, Galiba and Galiano1998), the maximum daily dose of L-Dopa that can be tolerated by an adult individual without any side effects is 1500 mg/d. Therefore, a healthy person should be able to safely consume 500 g of Mucuna based food/d with 0.1% L-Dopa; and any dietary prescriptions based on it should strictly adhere to this limit. However, in case of long-term ingestion, or consumption by children, pregnant women and people with medical conditions this dose may vary (Szabo and Tebbett, Reference Szabo, Tebbett, Flores, Eilittä, Myhrman, Carew and Carsky2002). Teixeira et al. (Reference Teixeira, Rich and Szabo2003) also confirmed upper limit of L-Dopa for consumption based on their research in Fababean and Broad bean (Vicia faba) where it is present in 0.2–0.5% respectively, and consumed safely worldwide.
In this context, assessing the natural variability for L-Dopa content assumes importance for strategizing the breeding programs. Several earlier studies have reported on this aspect in different Mucuna sp. (Table 2). Even though different estimation methods have been followed, large number of them has used spectrophotometric methods, except Modi et al. (Reference Modi, Natvarlal Patel and Goyal2008) and Raman Singh et al. (Reference Raman Singh, Pawan Saini, Satish Mathur, Gyanendra Singh and Santosh Kumar2010) who used HPTLC and Archana Raina et al. (Reference Archana Raina, Tomar and Dutta2012), HPLC methods. Recently, a novel approach has been reported by Sampath et al. (Reference Sampath, Mohamed Faizal and Mani Babu2013) where methanolic extract of L-Dopa is obtained in semi pure form by chemical fractionation followed by its quantitative analysis using HPTLC.
L-Dopa variability reported in different Mucuna species

Besides, little is known on the genetics governing L-Dopa production in Mucuna sp.; particularly information on G × E interaction effects lack consensus. Three studies till date have attempted to address this issue. Lorenzetti et al. (Reference Lorenzetti, MacIsaac, Arnason, Awang, Buckles, Buckles, Eteka, Osiname, Galiba and Galiano1998), in their study where latitude was used for environmental factor found both environmental and genotypic factors responsible for L-Dopa production. This was further supported by St. Laurent et al. (Reference St. Laurent, Livesey, Arnason, Bruneau, Flores, Eilittä, Myhrman, Carew and Carsky2002) who found marginal impact of latitude, but concluded that other factors were influential too. On the contrary, Capo-chichi et al. (Reference Capo-chichi, Eilittä, Carsky, Gilbert and Maasdorp2003b) found genotype has greater influence on L-Dopa production, whereas, G × E interaction effect was minimal when compared with genotype/accession main effect. In view of these differing viewpoints, our group re-examined the role of G × E interaction on L-Dopa production. It was confirmed that the trait is relatively stable across environments with preponderance of genotype effect over environmental effects (Mahesh and Sathyanarayana, Reference Mahesh and Sathyanarayana2011b). This elucidation will serve as an important clue for devising relevant breeding program for L-Dopa content in M. pruriens.
Screening for resilient genotypes against biotic and abiotic stresses
Growth and yield of crop plants are limited by many biotic and abiotic stresses resulting in appreciable deficit between their realized and expected potential. Bray et al. (Reference Bray, Bailey-Serres, Weretilnyk, Gruissem, Buchannan and Jones2000) estimates 51–82% yield loss in annual crops due to different abiotic stresses such as water, heat, salinity, soil, etc. On the other hand, biotic stresses are equally devastating with more than 42% of yield loss attributed to them (Pimentel, Reference Pimentel1997). Of the various remedies available, enhancing the genetic resistance/potentials is seen as the most enduring one and has several obvious advantages such as genetic permanency, negligible cost once cultivars are developed and quite high efficiency. However, cost and labour involved in field studies are seen as major deterrent to achieve this. Therefore, screening under-green house and in vitro conditions are emerging handy. Accordingly, they have been widely employed in plants like tomato (Frary et al., Reference Frary, Göl, Keleş, Ökmen, Pınar, Şığva, Yemenicioğlu and Doğanlar2010), peas (Bruggeman et al., Reference Bruggeman, Hamdy, Karajeh, Oweis and Touchan2010), cucumber (Baghbani et al., Reference Baghbani, Forghani and Kadkhodaie2013) and a few legume species (Rai et al., Reference Rai, Kalia, Singh, Gangola and Dhawan2011).
Breeding M. pruriens varieties for stress tolerance widens its scope for introduction in larger landscape. During the course of field studies for several years now, our group observed greater vulnerability of M. pruriens to Fusarium wilt as well as soil salinity. Encouraged by differential response of genotypes in our collection detailed germplasm screenings for genetic response against these stresses were undertaken. The results identified five moderate to highly resistant and six highly susceptible accessions (Fig. 3) to Fusarium wilt (Mahesh and Sathyanarayana, Reference Mahesh and Sathyanarayana2011a, Reference Mahesh and Sathyanarayanab). Further, overlaying the wilt screening results with AFLP marker data identified several pairs of contrasting parents useful for mapping this trait. Likewise in case of salinity, we evaluated 35 accessions using nine indicative parameters. The results of the experiments carried out under controlled conditions revealed different levels of tolerance (Fig. 4) for the selected growth, physiological and biochemical parameters (Mahesh and Sathyanarayana, Reference Mahesh and Sathyanarayana2015). Based on this, several contrasting parents were identified for genetic mapping of this phenotype.
Distribution of disease severity class for Fusarium wilt in M. pruriens germplasm (blue-var. pruriens and red-var. utilis).

Distribution of salt tolerance in M. pruriens germplasm (blue-var. pruriens and red-var. utilis).

Karyotype and phylogenetic analysis
Conservation of basic chromosome number x = 11 is one of the prevailing features in Phaseoloid legumes. Chromosomal studies even in genus Mucuna suggests x = 11 as the base number even though x = 14 is reported in Mucuna gigantea and Mucuna benettii (Sastrapradja et al., Reference Sastrapradja, Sastrapradja, Aminah, Lubis and Idris1974; Jaheer and Sathyanarayana, Reference Jaheer and Sathyanarayana2010). So far, karyotype descriptions are available only for Mucuna atropurpurea, Mucuna monosperma, Mucuna nigricans and M. pruriens (Agostini et al., Reference Agostini, Sazima, Tozzi and Forni-Martins2009; Jaheer and Sathyanarayana, Reference Jaheer and Sathyanarayana2010). Recently our group completed karyotyping of two other Indian species viz., Mucuna sempervirens, Mucuna bracteata. Overall results show Mucuna species vary significantly in their karyotype features. Presence of pair of satellite chromosomes in M. nigricans and structural alterations observed at intra-species as well as intra-varietal levels in M. pruriens (Lahiri et al., Reference Lahiri, Mukhopadhyay and Mukhopadhyay2010) corroborates this viewpoint suggesting their utility as markers in phylogenetic analysis. Besides, our recent studies on meiotic behaviour in some of the species revealed high incidence of chromosome laggards and bridges in M. gigantea and M. atropurpurea. Another species M. bracteata showed formation of uneven pollens and unreduced meiocytes (Fig. 5; Jaheer et al., Reference Jaheer, Chopra, Kunder, Bhat, Rashmi and Sathyanarayana2015). The latter perhaps indicate chromosomal instability caused out of tendency towards annual growth habit. Morphologically, M. bracteata presents several characters that are transitional between annual and perennial species suggesting possible key role it might have played in emergence of annual species including M. pruriens. Extensive distribution of M. bracteata in Indo-China region – which is also centre of origin of annual M. pruriens, substantiates this argument. Nonetheless, detailed analysis is needed to get better insight on this.
Meiotic Chromosome abnormalities in different species: Laggards in M. gigantea (a) M. atropurpurea (c, f and h). Chromosome bridges in M. gigantea (b) and M. atropurpurea (d, e and g); unreduced pollens in M. bracteata (i and j).

Phylogenetic analysis involving nuclear and chloroplast genes have resolved relationship among several legume taxa including Phaseoloid members. In Mucuna, however, such efforts for are lacking. So far, it has been only shown to be a member of Erythrininae – a sister tribe to Desmodieae under larger Phaseoloid group (Stefanovic et al., Reference Stefanovic, Bernard, Jeffrey and Jeff2009) having plastid genome inversion of 78-kb with a loss of one copy of large inverted repeat (Palmer et al., Reference Palmer, Nugent and Herbon1987; Lavin et al., Reference Lavin, Doyle and Palmer1990). Given that, our group examined the potential of ITS and trnH-psbA sequences as diagnostic markers for species identification and phylogenetic studies in Mucuna species. The results not only revealed these genes to be phylogenetically informative, but also efficacy of combined ITS and psbA-trnH sequences for reliable species delineation (Jaheer et al., Reference Jaheer, Chopra, Kunder, Bhat, Rashmi and Sathyanarayana2015).
Molecular markers and genetic diversity
Understanding the pattern of diversity and relationships in a germplasm collection is another important component of breeding programs (Azhaguvel et al., Reference Azhaguvel, Vidya Saraswathi, Sharma and Varshney2006). Diversity based on morphological traits may not be reliable due to likely influence of environment (Tatikonda et al., Reference Tatikonda, Wani, Kannan, Beerelli, Sreedevi, David, Hoisington, Prathibha Devi and Varshney2009). In contrast, molecular markers are independent of such effects and can be reliably generated using DNA from any growth stage.
In Mucuna sp. earlier studies used random amplification of polymorphic DNA (RAPD) and AFLP markers for this purpose (Capo-chichi et al., Reference Capo-chichi, Weaver and Morton2001; Padmesh et al., Reference Padmesh, Reji, Jinish Dhar and Seeni2006; Sathyanarayana et al., Reference Sathyanarayana, Bharath Kumar, Vikas and Rajesha2008). Capo-chichi et al. (Reference Capo-chichi, Weaver and Morton2001) reported narrow genetic base (3–13%) among the US landraces in their study on 40 M. pruriens accessions using AFLP markers. Augmenting this with newer collections from CIAT apparently broadened the genetic base (0–32%) (Capo-chichi et al., Reference Capo-chichi, Weaver and Morton2003a). In case of Indian germplasm, Padmesh et al. (Reference Padmesh, Reji, Jinish Dhar and Seeni2006) first reported good diversity (10–61%) among the accessions collected from the Western Ghats of India using RAPD markers. However, they found narrow genetic base in var. utilis (SI-0.82) vis-à-vis var. pruriens (SI-0.70). This observation was further corroborated by an extended study by our group on a larger germplasm involving combined morphometric, biochemical, isozyme and RAPD analysis (Leelambika et al., Reference Leelambika, Mahesh, Jaheer and Sathyanarayana2010). It was also revealed that a few isozyme markers have diagnostic value in taxon identification (Leelambika and Sathyanarayana, Reference Leelambika and Sathyanarayana2011). Revision of genus Mucuna by Wilmot-Dear (Reference Wilmot-Dear1987) suggested new variety – var. hirsuta along with var. utilis and var. pruriens under M. pruriens indicating that it is distinguishable from var. pruriens only in having long crisped indumentum. Molecular data from our studies established its varietal status as against independent species suggested earlier (Baker, Reference Baker and Hooker1879; Nair and Henry, Reference Nair and Henry1983; Ellis, Reference Ellis1990; Saldanha, Reference Saldanha1996). Further, analysis of representative accessions from all the botanical varieties using AFLP markers confirmed even close genetic similarities between var. pruriens and var. hirsuta (Leelambika et al., Reference Leelambika, Mahesh, Jaheer and Sathyanarayana2010). In view of this, it is suggested to combine all the wild forms of M. pruriens viz. var. pruriens, var. hirsuta and their intermediate types in one subgroup under var. pruriens thus allowing only two sub-groups viz., var. utilis (cultivated + non-itching trichomes on pod) and var. pruriens (wild + itching trichomes on pod) to be recognized under M. pruriens. This not only reduces nomenclatural redundancies, but also provides for authentic systematic name to the genotype/variety under consideration in breeding programs.
Linkage map and quantitative trait loci (QTL) analysis
Genetic linkage maps have emerged as valuable resources to be used as framework for a number of plant breeding applications such as marker assisted selection, map based cloning, physical and comparative mapping etc. (Staub et al., Reference Staub, Serquen and Gupta1996). They are proved to be useful in detection of chromosomal locations and to study individual and interactive effects of genes for complex traits in several important legume species such as Lotus japonicus (Hayashi et al., Reference Hayashi, Miyahara, Sato, Kato, Yoshikawa, Taketa, Hayashi, Pedrosa, Onda, Imaizumi-Anraku, Bachmair, Sandal, Stougaard, Murooka, Tabata, Kawasaki, Kawaguchi and Harada2001); Medicago truncatula (Thoquet et al., Reference Thoquet, Gherardi, Journet, Kereszt and Ane2002); Medicago sativa (Julier et al., Reference Julier, Flajoulot, Barre, Cardinet, Santoni, Huguet and Huyghe2003); Phaseolus vulgaris (Yuste-Lisbona et al., Reference Yuste-Lisbona, Santalla, Capel, García-Alcázar, De La Fuente, Capel, De Ron and Lozano2012) and Pisum sativum (Sun et al., Reference Sun, Yang, Hao, Zhang, Ford, Jiang, Wang, Guan and Zong2014). Recently genetic maps have been successfully developed even for lesser known legume species such as Azuki bean (Han et al., Reference Han, Kaga, Isemura, Wang, Tomooka and Vaughan2005); Bambara groundnut (Ahmad, Reference Ahmad2012); Lima bean (Bonifácio et al., Reference Bonifácio, Fonsêca, Almeida, dos Santos and Pedrosa-Harand2012); Yardlong bean (Kongjaimun et al., Reference Kongjaimun, Kaga, Tomooka, Somta, Shimizu, Shu, lsemura, Vaughan and Srinives2012) etc.
However, little is realized in terms of developing genomic resources for underutilized plant species in general and M. pruriens in particular. A lone linkage map using US core collection (Capo-chichi et al., Reference Capo-chichi, Morton and Weaver2004), published earlier demonstrated prospects of good genome coverage for linkage studies with AFLP markers, in addition to segregation of pod colour and pod pubescence in F2 population. Beyond this, there was no report in the direction of trait-based mapping or QTL studies from this species or any other work from any part of the World, till date. Very recently, the first genetic map from Indian M. pruriens (Fig. 6) indicating QTL positions for floral, pod and seed traits using F2 intraspecific population has been reported by our group (Mahesh et al., accepted publication).
Location of quantitative trait loci (QTLs) for three qualitative and three quantitative traits based on combined results of SIM and CIM. The scale on the left side is the genetic distance in centiMorgan (cM), marker designations are given on the left side with distance and marker names spanning on both sides of the linkage group. QTLs are shown at the right side in vertical bars with trait names in different colours for different traits [black – seed width (SW); dark green – seed thickness (ST); blue – hundred seed weight (HSW); pink – flower colour (FC); orange – pod itchiness (PI); red – trichome colour (TC)]. The maps were drawn by the Map Chart 2.2 program. The vertical bar shows the LOD support interval and the line LOD interval of the QTL.

Comparative genomics and NGS for marker development
Development of codominant markers such as microsatellites and SNPs signifies key milestone in genomic resource development in M. pruriens. Microsatellite development based on expressed sequence tags (ESTs) is a promising alternative to cost intensive genomic-SSR for research in underutilized plants. Mining SSRs from the public databases is now sufficiently streamlined to make it cheaper and more efficient (Cordeiro et al., Reference Cordeiro, Casu, McIntyre, Manners and Henry2001; Kantety et al., Reference Kantety, La Rota, Matthews and Sorrells2002; Chen et al., Reference Chen, Zhou, Choi, Huang and Gmitter2006). Also large numbers of processed ESTs are now deposited in public databases. In this backdrop, we explored potential use of public legume EST databases for the development of gene-derived SSR-markers for M. pruriens.
Totally, 2,86,488 EST sequences from four legume species Vigna unguiculata, Glycine max, Phaseolus vulgaris and Cicer arietinum were analysed, which generated 22,457 SSR containing sequences. From these, 522 primer combinations were designed and 50 were screened against a diverse panel of 25 genotypes, which produced polymorphic profiles with an average PIC of 0.65 (unpublished data). As an extension of this project, currently we have undertaken transcriptome sequencing of the two contrasting parents from our germplasm to generate species specific microsatellite and SNP markers. So far de novo assembly has been constructed using P. vulgaris as a reference genome. Annotation of some of the gene clusters differentially expressed in different tissues is also in progress. We aim to develop several polymorphic SSR and SNP markers from this work in near future, which will greatly boost molecular breeding research in M. pruriens.
Conclusions and future prospects
Significant progress has been made in developing well characterized germplasm for the first time in M. pruriens at the laboratory for underutilized legume species at Sikkim University, Gangtok in collaboration with Sir M Visvesvaraya Institute of Technology, Bangalore. The projects currently underway are expected to pave a way for successful integration of molecular markers in breeding starting from development of saturated linkage maps and identification of markers/QTLs linked to L-Dopa and other economic traits. The co-localization of candidate genes with QTLs might even support ‘genomics-assisted breeding’ for these phenotypes. These advances will accelerate functional genomics or expression studies in near future. The genomic resources so developed will be greatly useful even in the field of taxonomy and evolutionary studies in genus Mucuna.
Acknowledgements
The authors acknowledge financial support from the Department of Science and Technology (DST) and Dept. of Biotechnology (DBT) – Govt. of India, Kirkhouse Trust (KHT), and UK for these projects. N. S. thanks Sikkim University, Gangtok and Sri Krishnadevaraya Educational Trust (Sri KET), Bangalore, India for the laboratory and field facilities.



